. 2013 Jul 31;33(31):12779-91.
doi: 10.1523/JNEUROSCI.4853-12.2013.

Structural and functional changes across the visual cortex of a patient with visual form agnosia

Affiliations

Structural and functional changes across the visual cortex of a patient with visual form agnosia

Holly Bridge et al. J Neurosci. .

Abstract

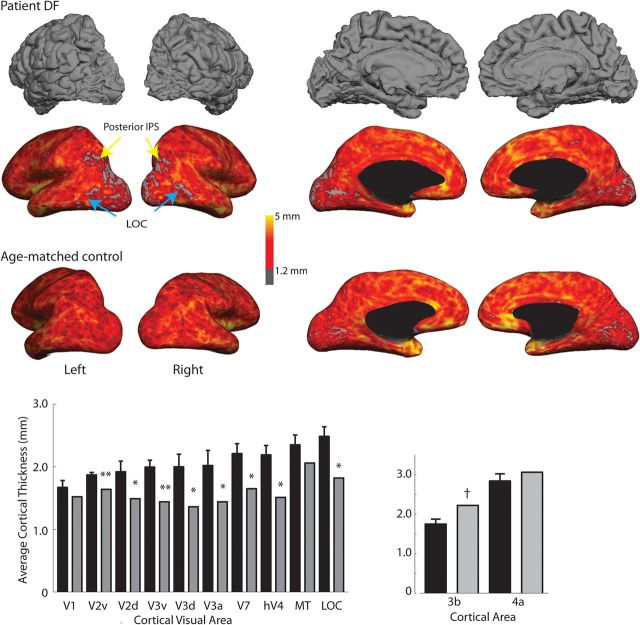
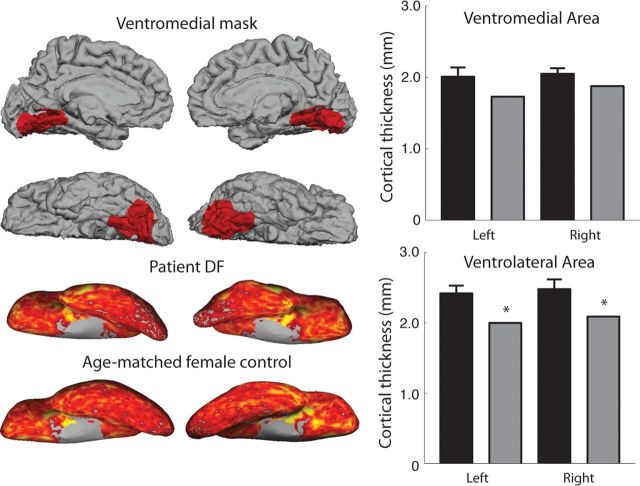
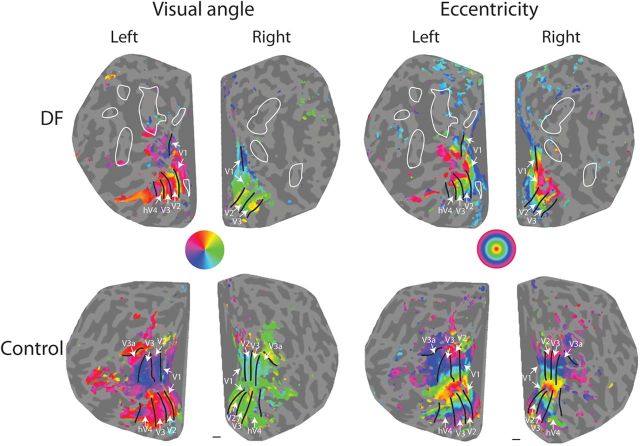
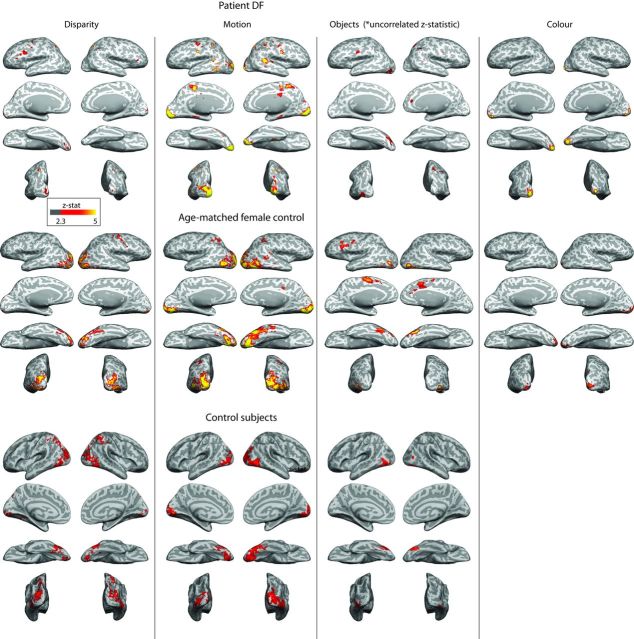
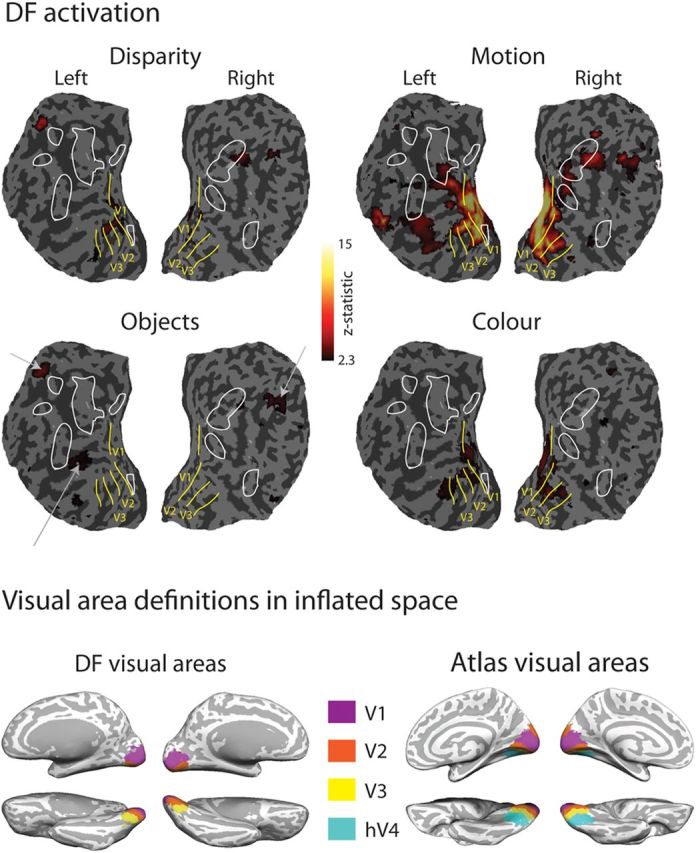
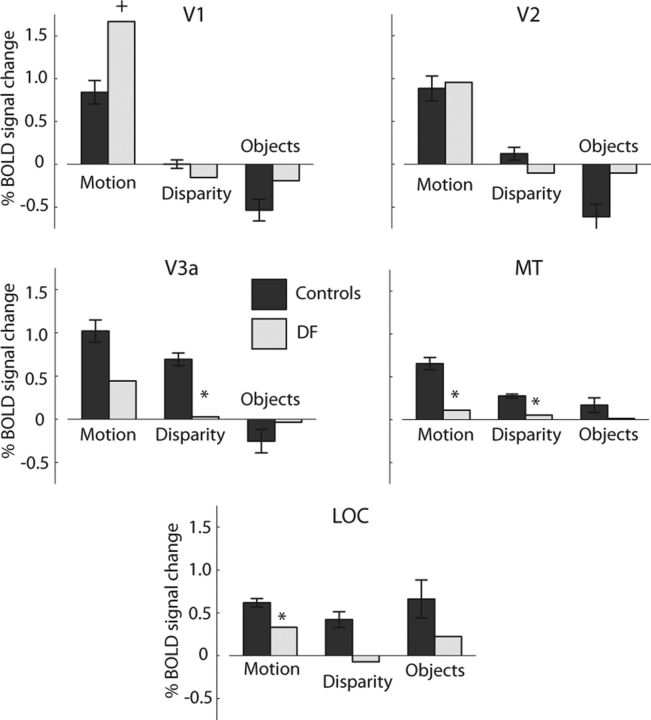
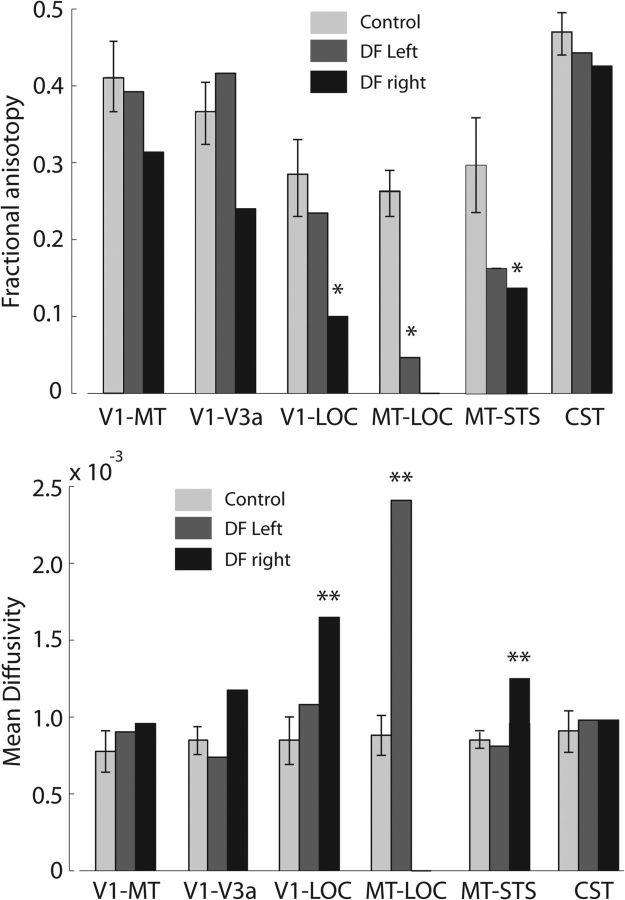
Loss of shape recognition in visual-form agnosia occurs without equivalent losses in the use of vision to guide actions, providing support for the hypothesis of two visual systems (for "perception" and "action"). The human individual DF received a toxic exposure to carbon monoxide some years ago, which resulted in a persisting visual-form agnosia that has been extensively characterized at the behavioral level. We conducted a detailed high-resolution MRI study of DF's cortex, combining structural and functional measurements. We present the first accurate quantification of the changes in thickness across DF's occipital cortex, finding the most substantial loss in the lateral occipital cortex (LOC). There are reduced white matter connections between LOC and other areas. Functional measures show pockets of activity that survive within structurally damaged areas. The topographic mapping of visual areas showed that ordered retinotopic maps were evident for DF in the ventral portions of visual cortical areas V1, V2, V3, and hV4. Although V1 shows evidence of topographic order in its dorsal portion, such maps could not be found in the dorsal parts of V2 and V3. We conclude that it is not possible to understand fully the deficits in object perception in visual-form agnosia without the exploitation of both structural and functional measurements. Our results also highlight for DF the cortical routes through which visual information is able to pass to support her well-documented abilities to use visual information to guide actions.


Figures

Figure 1.
Figure 1.
Cortical thickness is significantly reduced in extrastriate regions in DF compared with age-matched control participants. The top row shows the pial surface of DF's brain. Frontal and temporal regions appear to show normal gyrification, but the occipital cortex shows considerable reduction in gray matter, particularly on the lateral surface. The red scale for DF's brain in the second row indicates a quantification of the gray matter thickness. The arrows indicate areas LOC (cyan) and posterior IPS (yellow) in which the cortical thickness is <1.2 mm. Comparable data for an age-matched female control are shown below. The asterisks in the bottom left indicate visual cortical areas, for which the cortex in DF (gray bars) is significantly thinner than controls (black bars) across both hemispheres (using CGP-modified t tests from Crawford et al. (2010), with *p < 0.05 and **p < 0.01; see also Table 1). Only areas V1 (right hemisphere only) and MT do not differ from control participants. Cortical thickness for dorsal and ventral regions of V2 and V3 (V2d, V2v, V3d, V3v) are shown separately for comparison with retinotopic mapping results in Figure 3. Brodmann area 3b, indicated by † and used as a control region, is significantly thicker in DF than control participants.
Figure 2.
Figure 2.
Cortical thickness in ventromedial and ventrolateral occipital cortex. Cortical thickness values for the ventromedial cortex were extracted from the masks shown on DF's brain (top left). Bottom left shows a comparison of the cortical thickness values on the ventral surface of DF's brain and that of the age-matched female control subject. Cortical thickness in DF in ventromedial cortex does not differ from controls (top right). Black bars, Controls; gray bars, DF. In ventrolateral cortex (bottom right), there is a significant reduction in cortical thickness in DF (CGP-modified t tests from Crawford et al, 2010, with *p=0.05). See also Table 1.
Figure 3.
Figure 3.
Retinotopic maps of functional activity for patient DF and a control subject shown on flattened representations of the occipital cortex. The mapping in DF was sufficient to define the ventral portions of visual areas V1, V2, V3 (both hemispheres) and hV4 (right hemisphere only). The white arrows in the renderings of DF's brain indicate these visual areas. Responses in the dorsal sections were considerably less clear for both the rotating wedge stimulus used to define angular position (left column) and the expanding wedge stimulus to map eccentricity (right column). The locations and extents of structurally defined lesions of DF's cortex have been transferred from Figure 1 using a criterion of <1.2 mm cortical thickness and are shown as white outline contours. The small lesion in the peripheral field representation of ventral V1 in the left hemisphere is devoid of gray matter.
Figure 4.
Figure 4.
Activation to disparity, motion, object, and color stimuli in patient DF, an age- and gender-matched control participant, and the control group response. The activation to both disparity and objects is considerably reduced in DF. In contrast, the response to motion is extensive and highly significant. Note that, for DF, the cluster correction has not been applied to activations by objects, because this abolished any activation. The significance is lower in the images from the control group, because of the interparticipant variability, but the extent of activation is greater than in DF to all stimuli.
Figure 5.
Figure 5.
Top panel shows activations of DF's occipital cortex to motion-defined, disparity-defined, object, and color stimuli displayed on flattened cortical surfaces with retinotopically defined visual areas and extent of structural lesions overlaid. Extent of z-scaled BOLD activation is color coded according to the key (corrected for multiple comparisons), apart from activations to the object stimuli, which are indicated by white arrows pointing to the sites of activations shown in Figure 4, third column (which for DF were uncorrected for multiple observations). Bottom panel shows summary definitions of early visual cortical areas on inflated brain surfaces for comparison between this figure and Figure 4 for DF and from the atlas-based definitions of visual cortical areas for normal brains.
Figure 6.
Figure 6.
Summary of activations to motion-defined, disparity-defined, and object stimuli in control participants and DF. Areas showing activity significantly lower than the control mean (CGP-modified t test, p < 0.05) are shown by *. The activity to motion stimuli in V1 is significantly greater in DF than the control mean (CGP-modified t test, p < 0.05), denoted by †.
Figure 7.
Figure 7.
Measurements of white matter integrity in diffusion-weighted images. FA is significantly decreased particularly in the right hemisphere of DF. The left hemisphere shows very little difference from control participants in any of the pathways from V1. Only the pathway between MT and LOC is significantly affected in the left hemisphere, and it was not possible to define a tract in the right hemisphere. The increase in MD reflects the changes in FA, with very little difference in the left hemisphere, except for the MT–LOC connection. The asterisks indicate tracts in which the tract integrity is significantly different in DF compared with controls (CGP-modified t test, *p < 0.05 and **p < 0.001). The CGP-modified t tests were specifically designed for comparing a single case study against a group of control participants (Crawford et al., 2010).

References

    1. Acosta-Cabronero J, Williams GB, Pengas G, Nestor PJ. Absolute diffusivities define the landscape of white matter degeneration in Alzheimer's disease. Brain. 2010;133:529–539. doi: 10.1093/brain/awp257. - DOI - PubMed
    1. Amano K, Wandell BA, Dumoulin SO. Visual field maps, population receptive field sizes, and visual field coverage in the human MT+ complex. J Neurophysiol. 2009;102:2704–2718. doi: 10.1152/jn.00102.2009. - DOI - PMC - PubMed
    1. Antal A, Baudewig J, Paulus W, Dechent P. The posterior cingulate cortex and planum temporale/parietal operculum are activated by coherent visual motion. Vis Neurosci. 2008;25:17–26. doi: 10.1017/S0952523808080024. - DOI - PubMed
    1. Behrens TE, Berg HJ, Jbabdi S, Rushworth MF, Woolrich MW. Probabilistic diffusion tractography with multiple fibre orientations: What can we gain? Neuroimage. 2007;34:144–155. doi: 10.1016/j.neuroimage.2006.09.018. - DOI - PMC - PubMed
    1. Bondok AA, Sansone FM. Retrograde and transganglionic degeneration of sensory neurons after a peripheral nerve lesion at birth. Exp Neurol. 1984;86:322–330. doi: 10.1016/0014-4886(84)90190-0. - DOI - PubMed

Publication types

LinkOut - more resources