. 2013 Jul 31;33(31):12870-86.
doi: 10.1523/JNEUROSCI.2121-13.2013.

Glial scar borders are formed by newly proliferated, elongated astrocytes that interact to corral inflammatory and fibrotic cells via STAT3-dependent mechanisms after spinal cord injury

Affiliations

Glial scar borders are formed by newly proliferated, elongated astrocytes that interact to corral inflammatory and fibrotic cells via STAT3-dependent mechanisms after spinal cord injury

Ina B Wanner et al. J Neurosci. .

Abstract

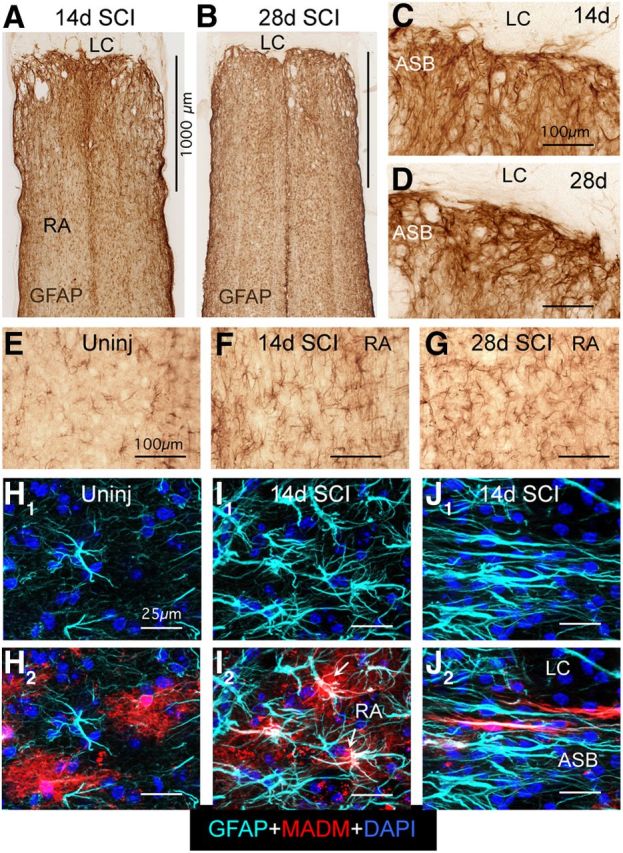
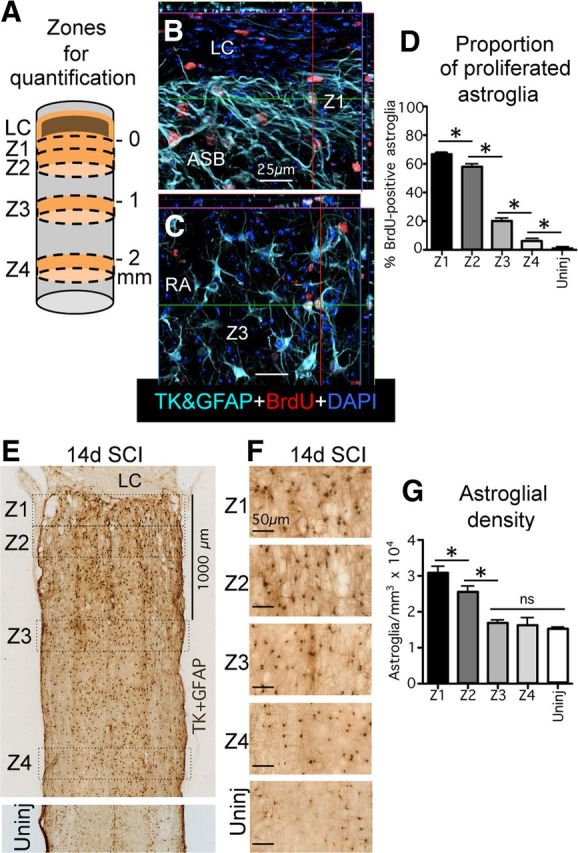
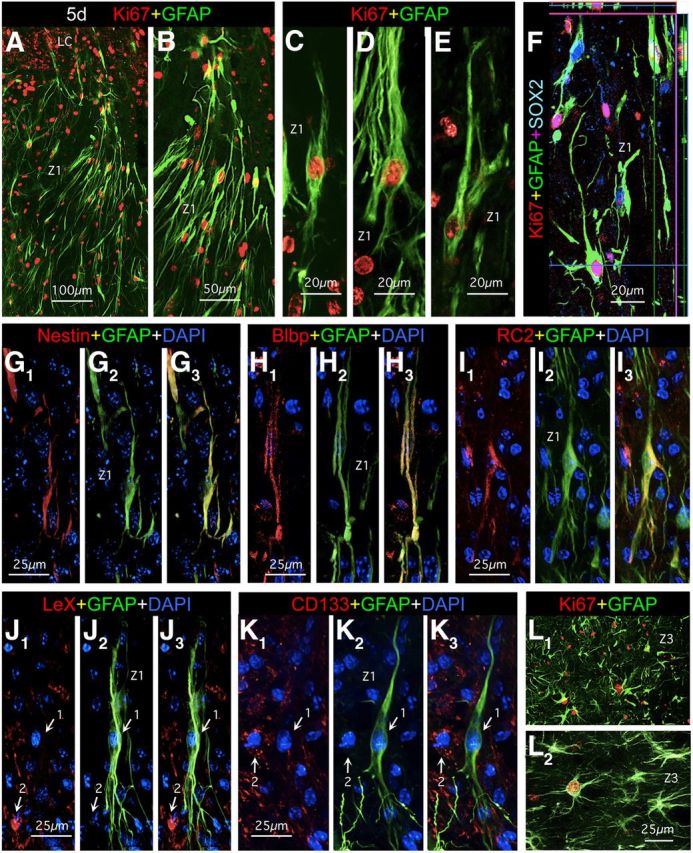
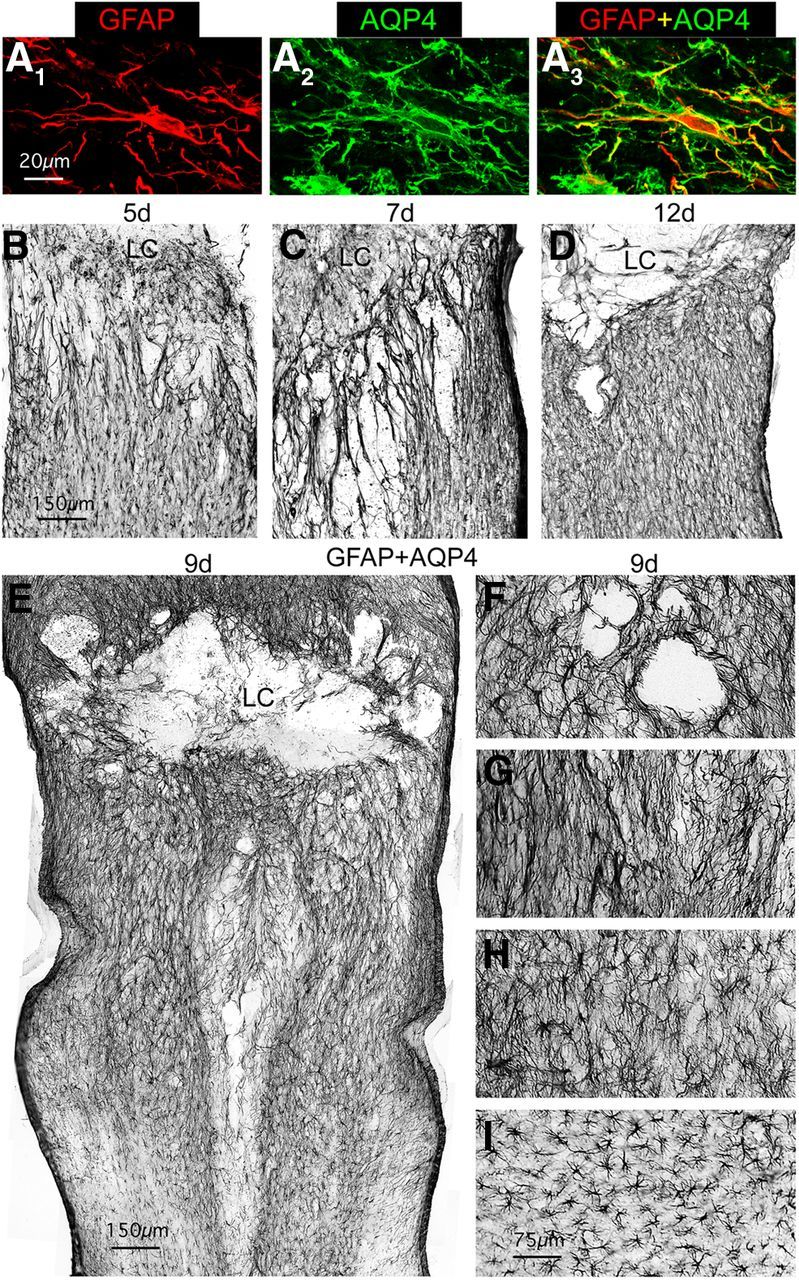
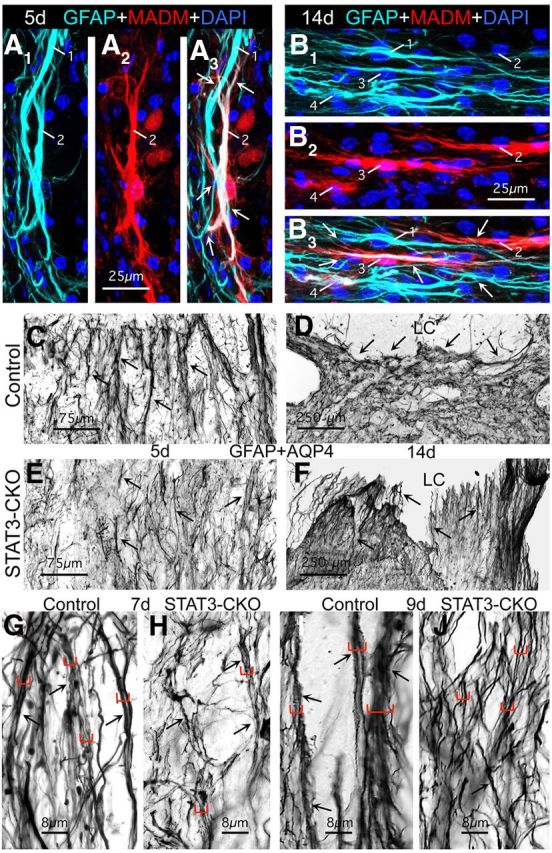
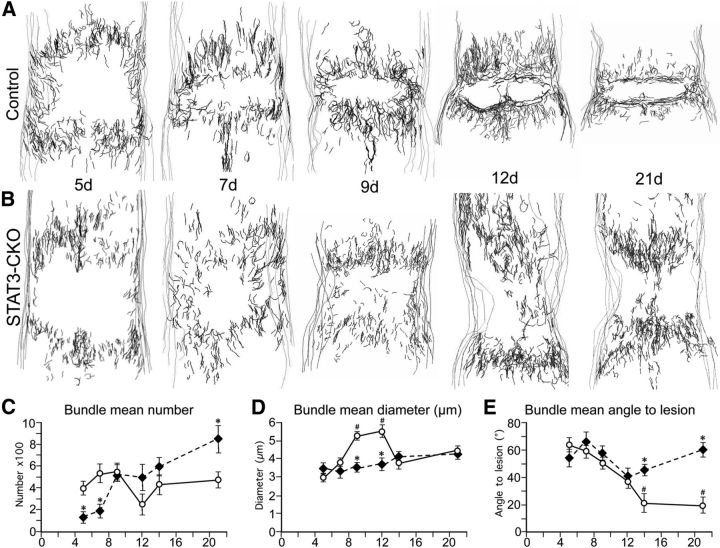
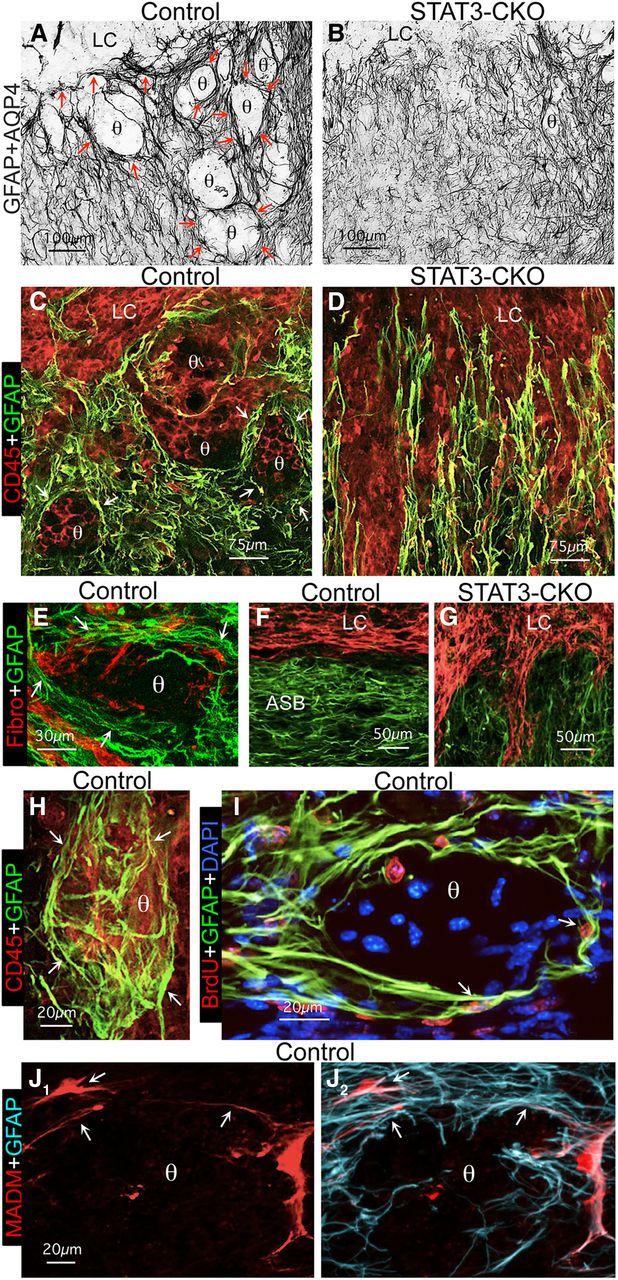
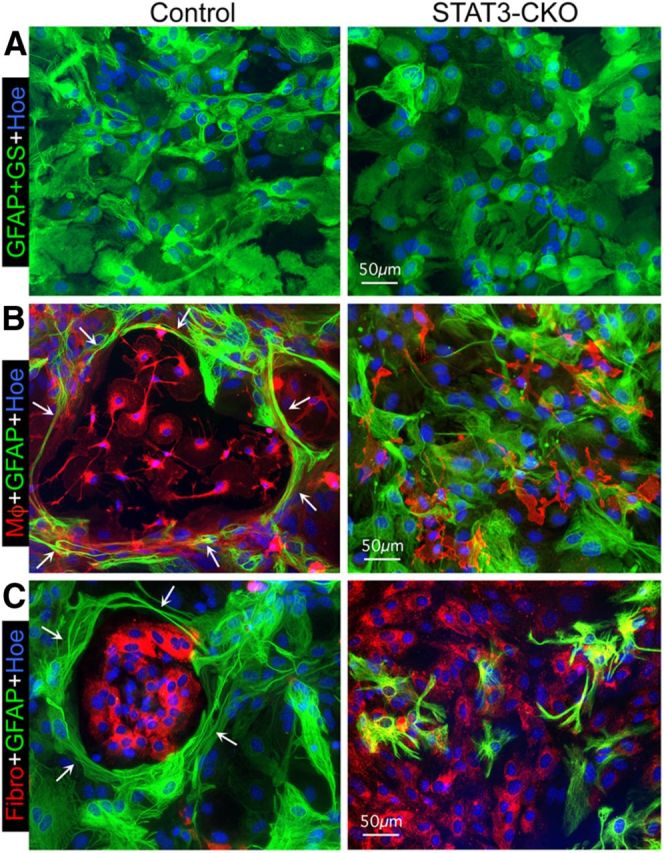
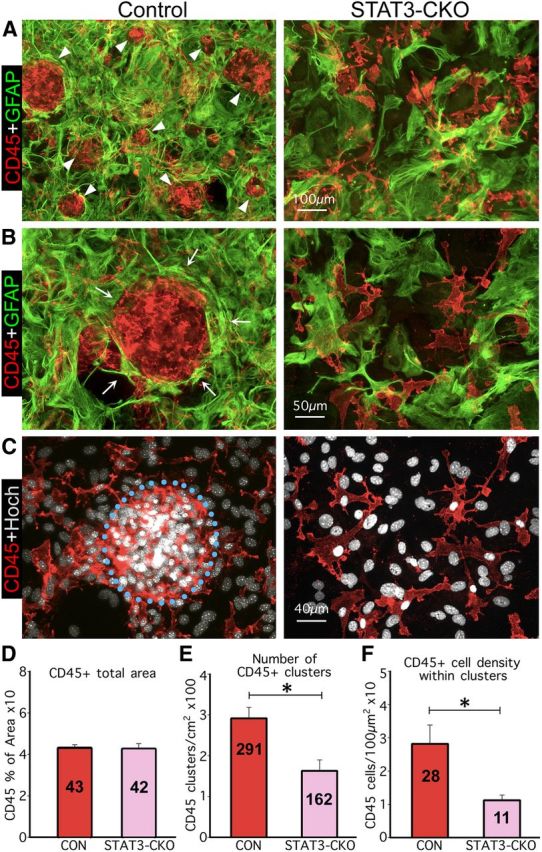
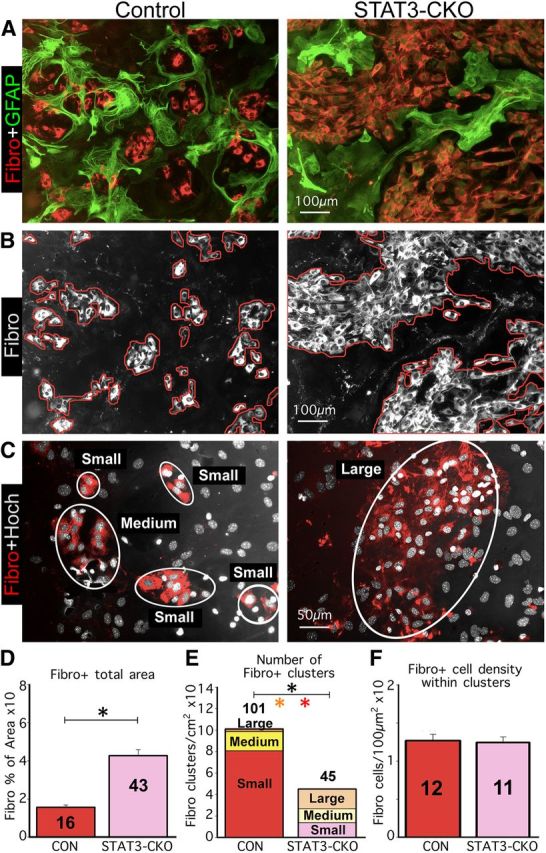
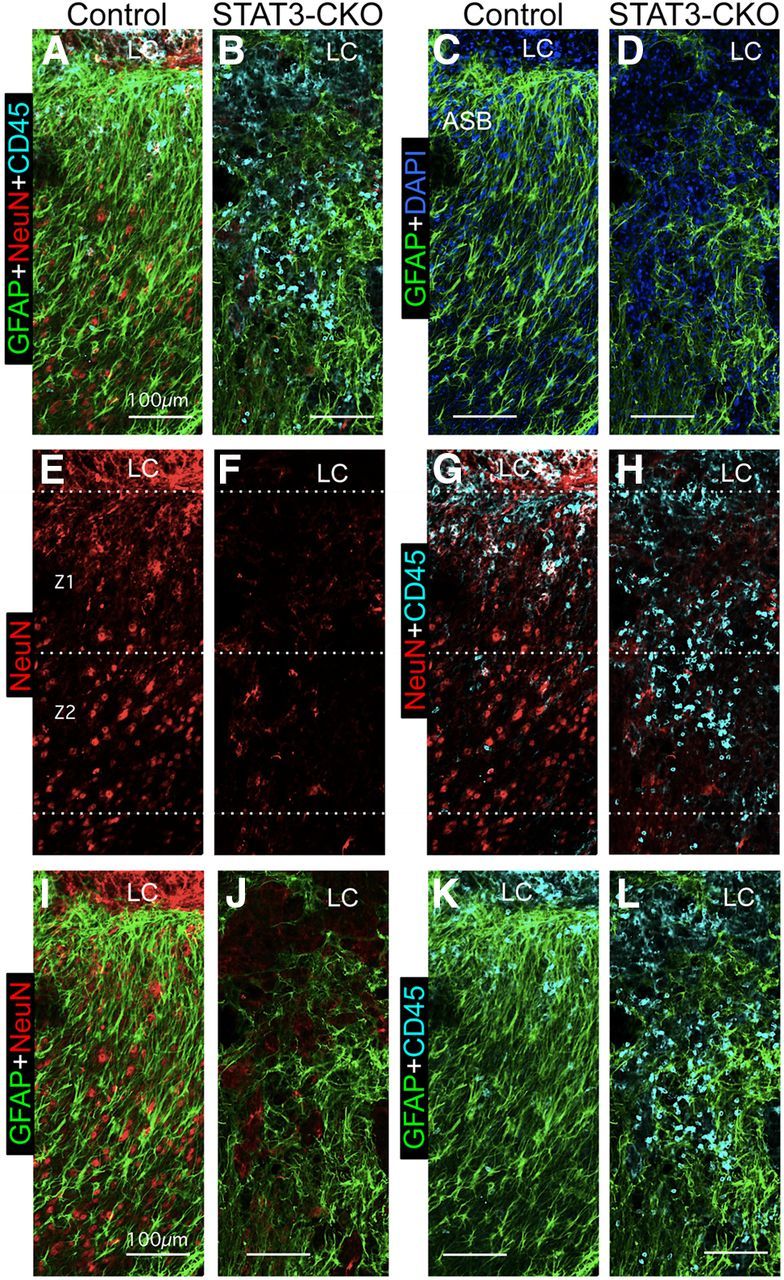
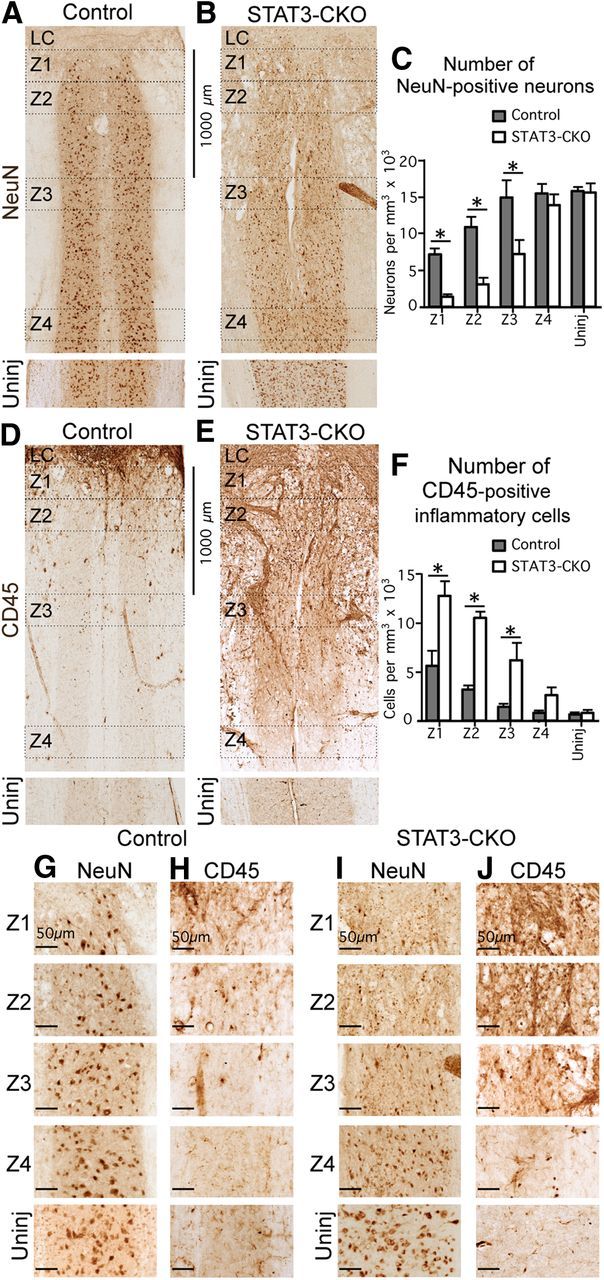
Astroglial scars surround damaged tissue after trauma, stroke, infection, or autoimmune inflammation in the CNS. They are essential for wound repair, but also interfere with axonal regrowth. A better understanding of the cellular mechanisms, regulation, and functions of astroglial scar formation is fundamental to developing safe interventions for many CNS disorders. We used wild-type and transgenic mice to quantify and dissect these parameters. Adjacent to crush spinal cord injury (SCI), reactive astrocytes exhibited heterogeneous phenotypes as regards proliferation, morphology, and chemistry, which all varied with distance from lesions. Mature scar borders at 14 d after SCI consisted primarily of newly proliferated astroglia with elongated cell processes that surrounded large and small clusters of inflammatory, fibrotic, and other cells. During scar formation from 5 to 14 d after SCI, cell processes deriving from different astroglia associated into overlapping bundles that quantifiably reoriented and organized into dense mesh-like arrangements. Selective deletion of STAT3 from astroglia quantifiably disrupted the organization of elongated astroglia into scar borders, and caused a failure of astroglia to surround inflammatory cells, resulting in increased spread of these cells and neuronal loss. In cocultures, wild-type astroglia spontaneously corralled inflammatory or fibromeningeal cells into segregated clusters, whereas STAT3-deficient astroglia failed to do so. These findings demonstrate heterogeneity of reactive astroglia and show that scar borders are formed by newly proliferated, elongated astroglia, which organize via STAT3-dependent mechanisms to corral inflammatory and fibrotic cells into discrete areas separated from adjacent tissue that contains viable neurons.


Conflict of interest statement

The authors have no financial conflicts or interests.

Figures

Figure 1.
Figure 1.
Mature scar borders adjacent to SCI lesions consist of reactive astroglia (RA) that have elongated overlapping morphologies. A–G, Bright-field immunostaining of GFAP in horizontal sections of thoracic spinal cord at 14 (A, C, F) and 28 d (B, D, G) after SCI and in uninjured spinal cord (E). Note that GFAP-positive cell processes overlap extensively in the astroglial scar border (ASB) immediately adjacent to the lesion core and lesion core (LC), in contrast with the nonoverlapping cell processes and stellate appearance of hypertrophied RA at 1 mm or more distant from the SCI. H–J, Multicolor fluorescence confocal imaging of MADM reporter and GFAP immunostaining in uninjured spinal cord (H) and at 14 d (I, J) after SCI. H1–J1, Single-channel imaging of GFAP immunoreactivity, which visualizes only the astroglial cytoskeleton in light blue. H2–J2, Dual-channel imaging of both GFAP immunoreactivity in light blue and MADM reporter in red, which visualizes the entire astroglial cytoplasm. Note that the bushy nature of protoplasmic astroglia and individual astrocyte domains revealed by the MADM reporter in uninjured astroglia (H) are more or less preserved in hypertrophied reactive stellate astroglia distant from the lesion core (arrows, I), whereas the RA that form the scar border immediately abutting the LC have elongated shapes as revealed also by the MADM cytoplasmic staining, and that the processes of different astroglia overlap extensively and are in close proximity to one another (J). Scale bars: A (for A, B), 1000 μm; C–G, 100 μm; in H–I, 25 μm.
Figure 2.
Figure 2.
Mature scar borders consist of newly proliferated astroglia and have a higher density of astroglia than healthy tissue. A, Schematic drawing of spinal cord after SCI depicting the central core lesion with lesion core (LC) and four zones (Z1–Z4) of 250 μm width used for various quantitative morphometric evaluations. The border where the astroglia scar abuts the LC was taken as zero and Z1 was measured from this point. Z2 was started immediately adjacent to Z1. Z3 and Z4 were started at 1 and 2 mm, respectively, from zero. B, C, Multicolor fluorescence immunostaining for TK + GFAP and BrdU in Z1 (B) and in Z3 (C) at 14 d after SCI. Note the high proportion of BrdU labeling of elongated astroglia in the astroglial scar border (ASB) in Z1 (B) and that far fewer reactive astroglia (RA) are BrdU labeled in Z3 (C). D, Graph showing the proportion of BrdU-labeled, newly proliferated astroglia in Z1–Z4 after SCI and in uninjured tissue. E, F, Bright-field immunostaining of GFAP + TK showing survey (E) and details (F) of scar forming and RA cell bodies in Z1–Z4 after SCI and in uninjured tissue. G, Graph showing the density of astroglial cell bodies in Z1–Z4 after SCI and in uninjured tissue. n = 4 per group. *p < 0.05 (ANOVA with post hoc pairwise Bonferroni comparison). Scale bars: B, C, 25 μm; E, 1000 μm; F, 50 μm.
Figure 3.
Figure 3.
At 5 d after SCI, the perimeters of tissue lesions in Z1 contain many actively proliferating elongated astroglia that express some but not other progenitor markers. A–L, Multicolor fluorescence immunostaining for GFAP and various other markers in Z1 (A–K) and Z3 (L) at 5 d after SCI. A–I, Elongated GFAP-positive astroglia at the perimeters of lesions (Z1) at 5 d stain positively for the cell-cycle marker Ki67 (A–F) as well as for SOX2 (F), nestin (G), Blbp (H), and RC2 (I). J, K, Elongated GFAP-positive astroglia (arrows, 1) do not stain for LeX (CD15) (J) or CD133 (K) although other nearby cells do (arrows, 2). L, In Z3 at 1 mm distance from the SCI lesion, GFAP-positive reactive astroglia have a more extensively branched stellate morphology and only a few of these cells are actively proliferating and express Ki67. Scale bars: A, L, 100 μm; B, 50 μm; C–F, 20, μm; G–K, 25 μm.
Figure 4.
Figure 4.
Throughout the time course of scar formation, reactive astroglia are heterogeneous in morphology with respect to distance from the lesion. A, Multicolor fluorescence immunostaining for GFAP and AQP4 showing that after SCI, AQP4 loses its polarized distribution along astroglial end foot processes and becomes distributed evenly along the full extent of astroglial cell processes as delineated by staining for cytoskeletal GFAP. B–I, Bright-field immunostaining of GFAP + AQP4 to visualize astroglia in horizontal sections of thoracic spinal cord at 5 (B), 7 (C), 12 (D), and 9 d (E–I) after SCI. Note that the elongated astroglial processes immediately adjacent to the SCI lesion and lesion core (LC) are oriented perpendicularly to the lesion at 5 (B) and 7 d (C), whereas they are oriented more parallel to the lesion at 12 d (D) after SCI. Note also that whereas reactive astroglia close to the lesion are more elongated in shape reactive astroglia more distant to the lesion become progressively less elongated and more stellate in shape, as exemplified at 9 d in the survey, E, and in the detail images, F–I, which progress from adjacent to the lesion (F, G) to more distant (H, I). Scale bars: A, 20 μm; B–E, 150 μm; F–I, 75 μm.
Figure 5.
Figure 5.
During the formation of astroglial scar borders, the cell processes of different elongated reactive astroglia overlap and interact extensively, and alter their orientation to the lesion over time, and these phenomena are defective in astroglia lacking STAT3. A, B, Multicolor fluorescence imaging of MADM reporter and GFAP immunostaining at 5 (A) and 14 d (B) after SCI in the scar border zone (Z1) of mGFAP-Cre-MADM reporter mice. A1–B1, Single-channel visualization of GFAP immunoreactivity, which visualizes only the astroglial cytoskeleton in light blue. A2–B2, Single-channel visualization of MADM reporter expression, which visualizes the entire astroglial cytoplasm in red. A3–B3, Dual-channel visualization of GFAP and MADM reporter together. Numbers indicate different astroglia visible in multiple parts. Arrows indicate overlap and contacts between processes of different astroglia. Note that at both time points the lesion core (LC; not visible) is toward the top of the images such that at 5 d after SCI (A) the elongated astroglia are perpendicular, whereas at 14 d (B) they are parallel to the lesion. C–J, Survey and detail images of bright-field immunostaining of GFAP + AQP4 at 5 (C, E), 7 (G, H), 9 (I, J), and 14 d (D, F) after SCI in the scar border zone (Z1) of control (C, E, G, I) and STAT3-CKO (D, F, H, J) mice. Arrows indicate bundles where astroglial cell processes are in close contact over extended distances. Different sized brackets in G–J indicated bundles of different thicknesses. Note that there are fewer thick bundles in STAT3-CKO mice at various time points and that at 14 d after SCI many astroglial processes in the scar border are oriented parallel to the central core lesion and LC in control (D) but not in STAT3-CKO (F) mice. Scale bars: A, B, 25 μm; C, E, 75 μm; D, F, 250 μm; G–J, 8 μm.
Figure 6.
Figure 6.
During the formation of astroglial scar borders, the association of astroglial cell processes into bundles and the changes in orientation of elongated reactive astroglia are quantifiably disrupted in mice with selective deletion of STAT3 from astroglia. A, B, Neurolucida-generated drawings of bundles formed by cell processes of elongated astroglia during the formation of astroglial scar borders at 5, 7, 9, 12, and 21 d after SCI in control (A) and STAT3-CKO (B) mice. C–E, Graphs of data generated with Neurolucida regarding the number (C), diameter (D), and angle of bundles with respect to the lesion (E) in control and STAT3-CKO mice as described in the text. C, STAT3-CKO at 5,7, and 21 d differ significantly from controls on the same days (*p < 0.01). D, STAT3-CKO mice at 9 and 12 d differ significantly from controls on the same days (*p < 0.01), and controls at 9 and 12 d differ significantly from controls at 5, 7, 14, and 21 d (#p < 0.01). E, STAT3-CKO mice at 14 and 21 d differ significantly from controls on the same days (*p < 0.01) and controls on 14 and 21 d differ significantly from controls at 5, 7, and 9 d (#p < 0.01). ANOVA with Fisher post hoc pairwise comparison.
Figure 7.
Figure 7.
Mature scar borders formed by overlapping elongated astroglial surround clusters of inflammatory and fibromeningeal cells in a STAT3-dependent manner in vivo. A, B, Bright-field immunostaining of GFAP + AQP4 in the scar border zone (Z1) of control (A), and STAT3-CKO (B) mice. C–J, Multicolor fluorescence immunostaining for GFAP and various other markers in Z1 of control (C, E, F, H–J) and STAT3-CKO (D, G) mice at 14 d after SCI. Note that in the control mice (A, C, F, H), but not STAT3-CKO mice (B, D, G), the overlapping processes (arrows) of newly proliferated and BrdU-labeled (I) elongated astroglia form borders (arrows) along the large lesion core (LC) of the central core lesion and also around large and small circular structures (θ), which contain clusters of CD45-positive inflammatory (C, H) and fibronectin-positive fibromeningeal (E) cells. H, Thick section visualization of multiple overlapping GFAP-positive astroglial processes (arrows) in a basket-like arrangement that envelopes an ovoid cluster (θ) of CD45-positive inflammatory cells. I, BrdU-positive newly proliferated elongated astroglia (arrows) surrounding a cell cluster (θ). J1-J2, MADM reporter alone (J1) and combined with GFAP immunostaining (J2) reveals that the elongated cell processes surrounding circular structures (θ) derived from different astroglia (arrows). Scale bars: A, B, 100 μm; C, D, 75 μm; E, 30 μm; F, G, 50 μm; H–J, 20 μm.
Figure 8.
Figure 8.
Astroglia in confluent monocultures become elongated and reorganize to surround newly added meningeal fibroblasts or macrophages in a STAT3-dependent manner. A–C, Multicolor fluorescence imaging of immunostaining of GFAP and GS (A) or of GFAP (B, C) to visualize astroglia alone (A) in combination with red tomato-lectin binding (left) or CD45 immunostaining (right) for macrophages (Mφ; B) or fibronectin (Fibro) immunostaining for fibromeningeal cells (C) and Hoechst (Hoe) nuclear staining. A, Shows confluent monocultures of both control and STAT3-CKO astroglia. B, C, Shows cocultures at 2 d after macrophages (B) or fibromeningeal cells (C) have been added to confluent control or STAT3-CKO astroglia. Note that after addition of either cell type to control cultures (left), astroglia display elongated processes (arrows) that surround and enclose the added cells in circular structures. In contrast, STAT3-CKO astroglia (right) fail to form circular structures or surround the added cells, but instead the added cells intermingle among the astroglia (B, C). Scale bars: A–C, 50 μm.
Figure 9.
Figure 9.
In cocultures, elongated astroglia segregate macrophages into discrete clusters and this activity is quantifiably disrupted by selective deletion of STAT3 from astroglia. A–C, Multicolor immunofluorescence imaging of GFAP and CD45 (A, B) or CD45 immunostaining plus Hoechst (Hoch) nuclear staining (C). A, B, Show at low (A) and high (B) magnification that in controls (left), elongated astroglial processes (arrows) surround and enclose macrophages in circular structures (arrowheads) of various sizes. In contrast, the processes of STAT3-CKO astroglia (right) fail to form circular structures or surround macrophages. C, Shows macrophages and nuclei of the same areas in B, emphasizing their higher density and clustering in cocultures with control astroglia (left) compared with their more scattered distribution in cocultures with STAT3-CKO astroglia (right). D–F, Graphs showing quantitation of CD45-positive areas (D), number of CD45-positive macrophage clusters (E), and cell density within macrophage clusters (F), in cocultures of astroglia and macrophages; n ≥ 3 animals per genotype. *p < 0.001 (t test). Scale bars: A, 100 μm; B, 50 μm; C, 40 μm.
Figure 10.
Figure 10.
In cocultures, elongated astroglia segregate fibromeningeal cells into discrete clusters and this activity is quantifiably disrupted by selective deletion of STAT3 from astroglia. A–C, Multicolor immunofluorescence imaging of GFAP and fibronectin (A) or fibronectin immunostaining plus Hoechst (Hoch) nuclear staining (B, C). A, Shows that in controls (left), elongated astroglial processes surround and enclose fibromeningeal cells in circular structures of various sizes. In contrast, the processes of STAT3-CKO astroglia (right) fail to form circular structures but instead intermingle among groups of fibromeningeal cells. B, Shows fibromeningeal cells (white) of the same areas in A and illustrates tracing (red lines) used to quantify area covered by meningeal fibroblasts. C, Illustrates how fibromeningeal cells were categorized into clusters (white rings) of various sizes for quantification. Note that in control cocultures, fibromeningeal cells were present mostly in small and medium sized clusters, whereas in STAT3-CKO cocultures fibromeningeal cells were in fewer and generally much larger cell clusters. D–F, Graphs showing quantitation of fibronectin-positive areas (D), number of fibromeningeal cell clusters of various sizes (E), and cell density within fibromeningeal cell clusters (F), in cocultures of astroglia and fibromeningeal cells; n ≥ 3 animals per genotype. *p < 0.001 (t test) for total clusters in black and for large or small clusters in colors. Scale bars: A, B, 100 μm; C, 50 μm.
Figure 11.
Figure 11.
In vivo, many healthy neurons and few inflammatory cells overlap with astroglial scar borders adjacent to SCI lesions in control mice, whereas in STAT3-CKO mice few neurons and many inflammatory cells overlap with astroglial borders adjacent to SCI lesions. A–L, Multicolor fluorescence immunostaining for GFAP, NeuN, and CD45 in Z1 and Z2 adjacent to the central lesion core and lesion core (LC) at 14 d after SCI in control (A, C, E, G, I, K) and STAT3-CKO (B, D, F, H, J, L) mice. The pairs of images show the same fields in the control and STAT3-CKO mice using different combinations of fluorescent filters so as to compare locations and overlap of different cell types: A, B, Astroglia (GFAP), neurons (NeuN), and inflammatory cells (CD45) are shown together. C, D, Same fields as in A and B showing astroglia only; note the prominent astroglial scar border (ASB) adjacent to the LC in the control (C) and the failure of astroglia to form a scar border adjacent to the LC in STAT3-CKO (D). E, F, Same fields showing neurons only; note the much greater number of NeuN-positive neurons in Z1 and Z2 in control (E) compared with STAT3-CKO (F). G, H, Same fields showing neurons and inflammatory cells; note that areas with neurons contain few or no inflammatory cells in control (G), whereas areas filled with inflammatory cells in STAT3-CKO contain few neurons (H). I, J, Same fields showing astroglia and neurons, which intermingle in control (I) but not STAT3-CKO (J). K, L, Same fields showing astroglia and inflammatory cells; note that there are few inflammatory cells intermingled with astroglia in control (K) but that inflammatory ells are prominent in areas devoid of astroglia in STAT3-CKO (L). Scale bars: A–L, 100 μm.
Figure 12.
Figure 12.
In mice with selective deletion of STAT3 from astroglia, the density of neurons is significantly lower and the density of inflammatory cells is significantly higher in tissue adjacent to the SCI lesion core. A, B, D, E, Bright-field immunostaining showing survey images of NeuN (A, B) and CD45 (D, E) in Z1–Z4 adjacent to the central lesion core and lesion core (LC) at 14 d after SCI in control (A, D) and STAT3-CKO (B, E) mice. C, F, Graphs showing the Neu-N-positive neurons (C), and CD45-positive globoid inflammatory cells (F) in Z1–Z4 after SCI and in uninjured tissue in control and STAT3-CKO mice (n = 4 per group). *p < 0.05 (ANOVA with post hoc pairwise Bonferroni comparison). G–J, Detail images of NeuN-stained neurons (G, I) and CD45-stained inflammatory cells (H, J) taken from survey images in A, B, D, and E. Note the greater loss of neurons and greater number of inflammatory cells in Z1–Z3 in STAT3-CKO compared with control mice. Scale bars: A, B, D, E, 1000 μm; G–J, 50 μm.

References

    1. Aaronson DS, Horvath CM. A road map for those who don't know JAK-STAT. Science. 2002;296:1653–1655. doi: 10.1126/science.1071545. - DOI - PubMed
    1. Aldrich A, Kielian T. Central nervous system fibrosis is associated with fibrocyte-like infiltrates. Am J Pathol. 2011;179:2952–2962. doi: 10.1016/j.ajpath.2011.08.036. - DOI - PMC - PubMed
    1. Amat JA, Ishiguro H, Nakamura K, Norton WT. Phenotypic diversity and kinetics of proliferating microglia and astrocytes following cortical stab wounds. Glia. 1996;16:368–382. doi: 10.1002/(SICI)1098-1136(199604)16:4<368::AID-GLIA9>3.0.CO%3B2-W. - DOI - PubMed
    1. Bannerman P, Hahn A, Soulika A, Gallo V, Pleasure D. Astrogliosis in EAE spinal cord: derivation from radial glia, and relationships to oligodendroglia. Glia. 2007;55:57–64. doi: 10.1002/glia.20437. - DOI - PubMed
    1. Bardehle S, Krüger M, Buggenthin F, Schwausch J, Ninkovic J, Clevers H, Snippert HJ, Theis FJ, Meyer-Luehmann M, Bechmann I, Dimou L, Götz M. Live imaging of astrocyte responses to acute injury reveals selective juxtavascular proliferation. Nat Neurosci. 2013;16:580–586. doi: 10.1038/nn.3371. - DOI - PubMed

Publication types

MeSH terms