. 2013 Jul 31;33(31):12898-907.
doi: 10.1523/JNEUROSCI.1552-13.2013.

Selective effects of baclofen on use-dependent modulation of GABAB inhibition after tetraplegia

Affiliations

Selective effects of baclofen on use-dependent modulation of GABAB inhibition after tetraplegia

Melissa D Barry et al. J Neurosci. .

Abstract

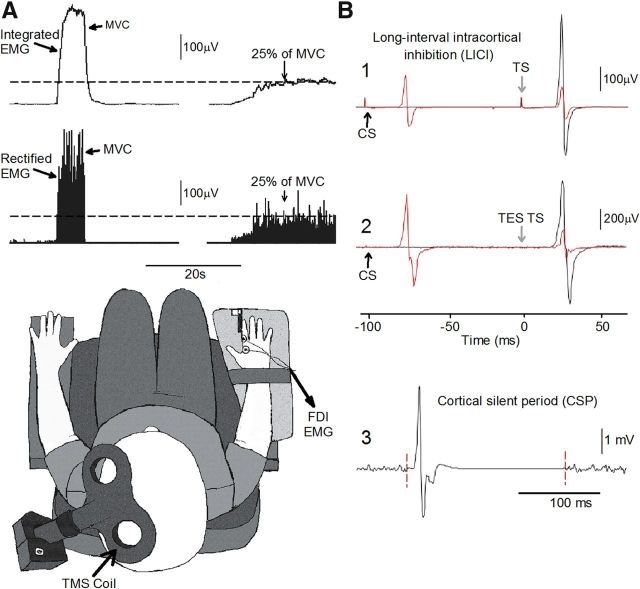
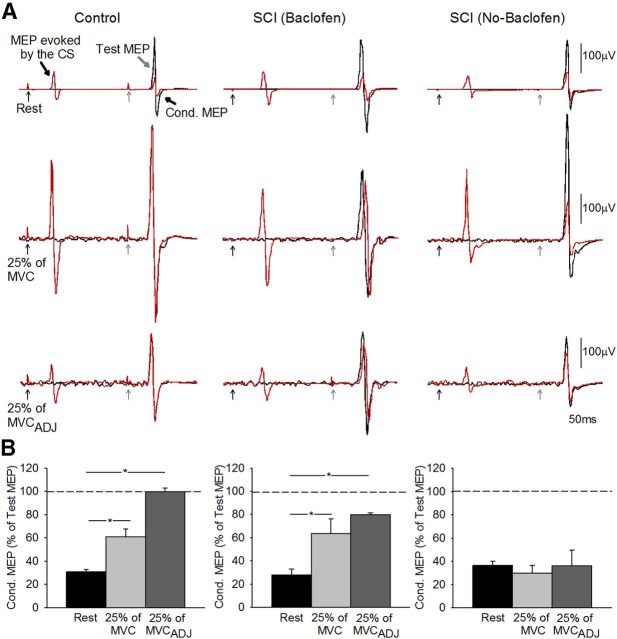
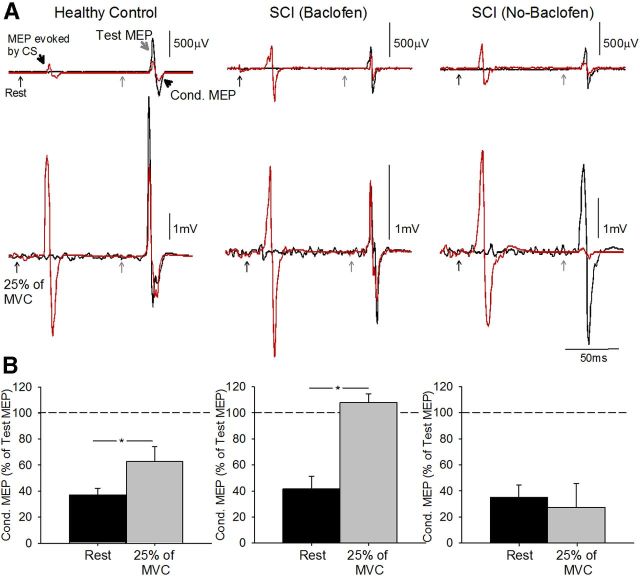
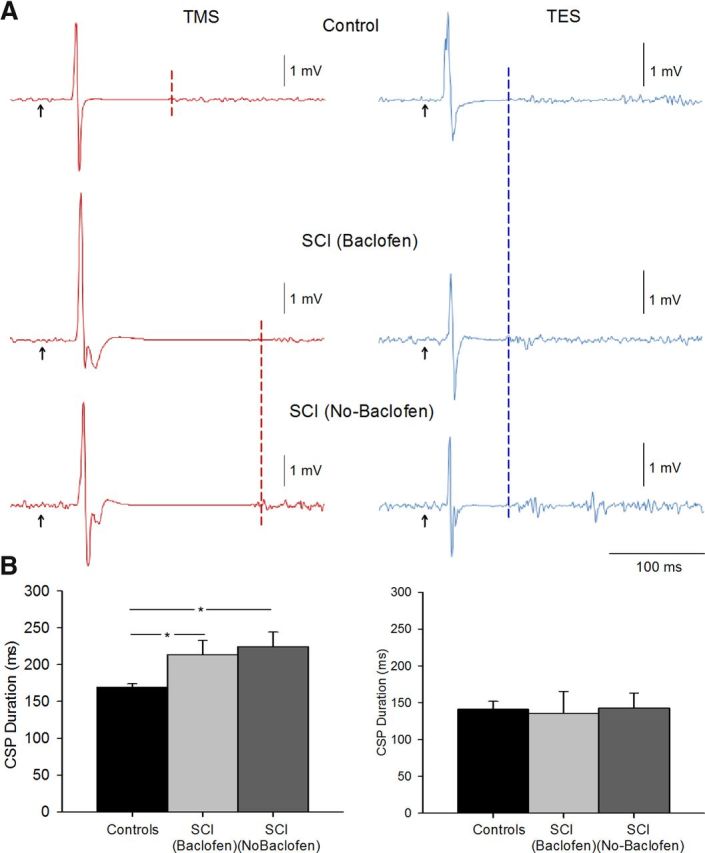
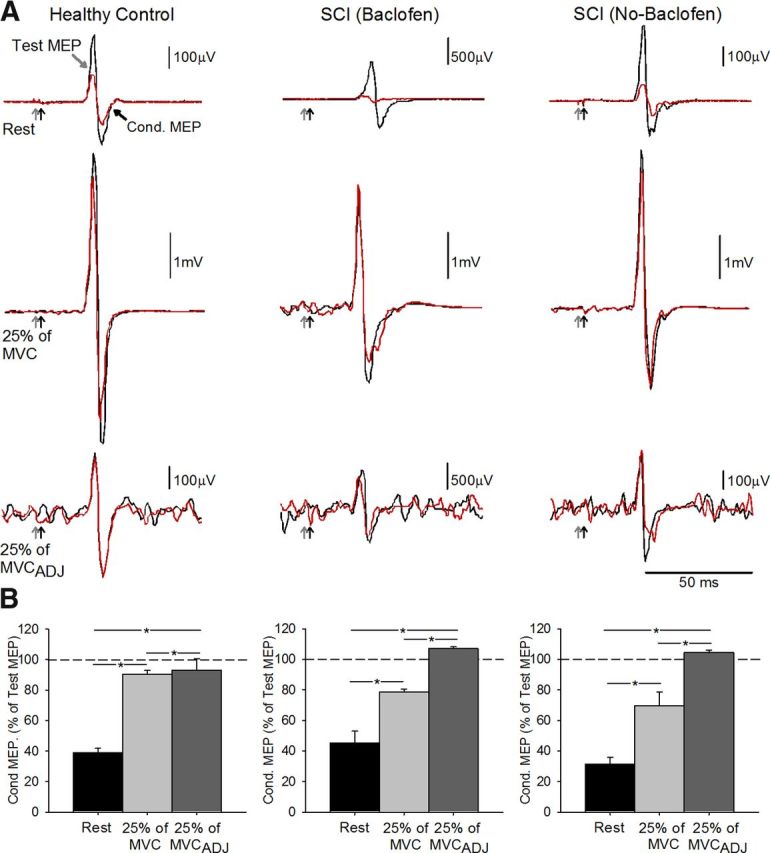
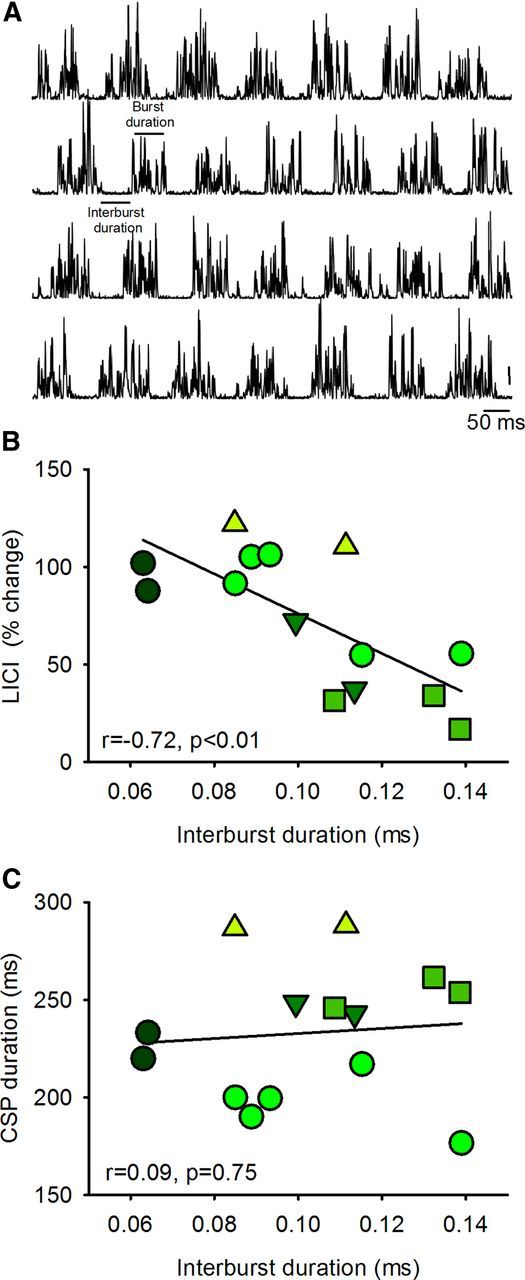
Baclofen is a GABAB receptor agonist commonly used to relief spasticity related to motor disorders. The effects of baclofen on voluntary motor output are limited and not yet understood. Using noninvasive transcranial magnetic and electrical stimulation techniques, we examined electrophysiological measures probably involving GABAB (long-interval intracortical inhibition and the cortical silent period) and GABAA (short-interval intracortical inhibition) receptors, which are inhibitory effects mediated by subcortical and cortical mechanisms. We demonstrate increased active long-interval intracortical inhibition and prolonged cortical silent period during voluntary activity of an intrinsic finger muscle in humans with chronic incomplete cervical spinal cord injury (SCI) compared with age-matched controls, whereas resting long-interval intracortical inhibition was unchanged. However, long-term (~6 years) use of baclofen decreased active long-interval intracortical inhibition to similar levels as controls but did not affect the duration of the cortical silent period. We found a correlation between signs of spasticity and long-interval intracortical inhibition in patients with SCI. Short-interval intracortical inhibition was decreased during voluntary contraction compared with rest but there was no effect of SCI or baclofen use. Together, these results demonstrate that baclofen selectively maintains use-dependent modulation of largely subcortical but not cortical GABAB neuronal pathways after human SCI. Thus, cortical GABA(B) circuits may be less sensitive to baclofen than spinal GABAB circuits. This may contribute to the limited effects of baclofen on voluntary motor output in subjects with motor disorders affected by spasticity.


Figures

Figure 1.
Figure 1.
Experimental setup. A, Raw EMG traces showing (top left traces) with the index finger into abduction by activating the FDI muscle and the visual display presented to all subjects (top right traces) during testing. Subjects were instructed by an oscilloscope to maintain at rest and to perform 25% of MVC with the index finger into abduction. Schematic of the experimental setup showing the posture of both hands and TMS coil during testing (illustration). Note that control subjects completed the test with the right dominant hand and patients with SCI used their less affected hand. B, Raw MEP traces elicited by TMS and TES stimulation recorded from the FDI muscle in a representative subject during all conditions tested. MEPs elicited by the TS (black traces) and CS (red traces) are indicated by arrows during testing of LICI using TMS (B1) and TES (B2). Note that during testing of LICI the CS was given 100 ms before the TS (B1, B2). An example of the CSP (B3) elicited by using TMS during 25% of MVC is presented. The CSP was measured between the stimulus artifact (left dotted line) and the return of background EMG (right dotted line).
Figure 2.
Figure 2.
LICI using TMS. A, LICI tested in the resting FDI in a representative control subject (control, top left traces) and in a patient with SCI taking [SCI (Baclofen), top middle traces] and not taking [SCI (No-Baclofen), top right traces] baclofen when the conditioning and test stimulus were given by TMS. The test MEP (black traces) and conditioned MEP (Cond MEP, red traces) are indicated by black arrows. Traces show the average 20 test MEP and 20 Cond. MEP. B, Group data (controls, n = 18, bottom left; SCI Baclofen, n = 8, bottom left; SCI No-Baclofen, n = 8, bottom right). The abscissa shows all conditions tested (rest, black bars; 25% of MVC, light gray bars; 25% of MVCADJ, dark gray bars). The ordinate shows the magnitude of the conditioned MEP expressed as a percentage of the test MEP. The horizontal dashed line represents the size of the test MEP. Note that LICI decreased during index finger abduction compared with rest in controls and in patients taking baclofen but remains unchanged during voluntary contraction and rest in patients not taking baclofen. Error bars indicate SEs; *p < 0.05.
Figure 3.
Figure 3.
LICI using TES. A, LICI tested in the resting FDI in representative subjects when the conditioning stimulus was given by TMS and test stimulus was given by TES [control, top left traces; SCI (Baclofen), top middle traces; SCI (No-Baclofen), top right traces]. The test MEP (black traces) and conditioned MEP (red traces) are indicated by black arrows. Traces show the average 10 test MEP and 10 Cond. MEP. B, Group data (controls, n = 10, bottom left; SCI Baclofen, n = 3, bottom left; SCI No-Baclofen, n = 3, bottom right. The abscissa shows all conditions tested (rest, black bars; 25% of MVC, light gray bars). The ordinate shows the magnitude of the conditioned MEP expressed as a percentage of the test MEP. The horizontal dashed line represents the size of the test MEP. Note that LICI decreased during index finger abduction compared with rest in controls and in patients taking baclofen but remains unchanged in participant's not taking baclofen. Error bars indicate SEs; *p < 0.05.
Figure 4.
Figure 4.
CSP. A, Raw MEP traces in representative subjects showing the CSP duration (indicated by dashed lines) after the MEP during 25% of MVC [control, top traces; SCI (Baclofen), middle traces; SCI (No-Baclofen), bottom traces] baclofen. Traces show the average 20 MEPs tested by TMS and 10 MEPs tested by TES. B, Group data tested by TMS [controls, n = 18, black bar; SCI (Baclofen), n = 8, light gray bar; SCI (No-Baclofen), n = 8, dark gray bar], and TES [controls, n = 10, black bar; SCI (Baclofen), n = 3, light gray bar; SCI (No-Baclofen), n = 3, dark gray bar]. The abscissa shows all groups tested and the ordinate shows the duration of the CSP. The duration of the CSP elicited by TMS was longer in patients compared with controls. Note that the duration of the CSP elicited by TES during voluntary contraction was similar across groups. Error bars indicate SEs; *p < 0.05.
Figure 5.
Figure 5.
SICI. A, SICI recorded from the resting FDI in a representative control subject (top left traces) and in a patient taking (top middle traces) and not taking (top right traces) baclofen. The test MEP (black traces) and conditioned MEP (red traces) are indicated by black arrows. Traces show the average 20 test MEP and 20 Cond. MEP. B, Group data [controls, n = 10, bottom left; SCI Baclofen, n = 6, bottom left; SCI No-Baclofen, n = 6, bottom right]. The abscissa shows all conditions tested (rest, black bars; 25% of MVC, light gray bars; 25% of MVCADJ, dark gray bars). The ordinate shows the magnitude of the conditioned MEP expressed as a percentage of the test MEP. The horizontal dashed line represents the size of the test MEP. Note that SICI decreased during index finger abduction compared with rest in all groups tested. Error bars indicate SEs; *p < 0.05.
Figure 6.
Figure 6.
Clonus during voluntary contraction. A, Raw EMG traces recorded from the FDI muscle in a patient not taking baclofen during 25% of MVC. Traces show the rectified EMG in representative trials. Graphs show a correlation analysis between the average duration of periods of decreased EMG activity between bursts of clonus (interburst duration) and the magnitude of LICI (B), and CSP duration (C). In all graphs, the abscissa shows the duration of periods of decreased EMG activity between burst of clonus during 25% of MVC. The ordinate shows the magnitude of LICI (percentage change from rest to active) (B) and the CSP duration (C). Each symbol represents a different patient and repetition a symbol indicates multiple measurements in the same patient. Note that there was an inverse correlation between interburst duration and LICI but not the CSP. Thus, patients who showed more pronounced LICI during voluntary contraction also showed more prolonged periods of EMG silence during clonus in the FDI muscle.

References

    1. Aydin G, Tomruk S, Keleş I, Demir SO, Orkun S. Transcutaneous electrical nerve stimulation versus baclofen in spasticity: clinical and electrophysiologic comparison. Am J Phys Med Rehabil. 2005;84:584–592. doi: 10.1097/01.phm.0000171173.86312.69. - DOI - PubMed
    1. Aymard C, Katz R, Lafitte C, Lo E, Pénicaud A, Pradat-Diehl P, Raoul S. Presynaptic inhibition and homosynaptic depression: a comparison between lower and upper limbs in normal human subjects and patients with hemiplegia. Brain. 2000;123:1688–1702. doi: 10.1093/brain/123.8.1688. - DOI - PubMed
    1. Azouvi P, Mane M, Thiebaut JB, Denys P, Remy-Neris O, Bussel B. Intrathecal baclofen administration for control of severe spinal spasticity: functional improvement and long-term follow-up. Arch Phys Med Rehabil. 1996;77:35–39. doi: 10.1016/S0003-9993(96)90217-8. - DOI - PubMed
    1. Beres-Jones JA, Johnson TD, Harkema SJ. Clonus after human spinal cord injury cannot be attributed solely to recurrent muscle-tendon stretch. Exp Brain Res. 2003;149:222–236. - PubMed
    1. Bunday KL, Perez MA. Impaired crossed facilitation of the corticospinal pathway after cervical spinal cord injury. J Neurophysiol. 2012;107:2901–2911. doi: 10.1152/jn.00850.2011. - DOI - PMC - PubMed

Publication types

MeSH terms

LinkOut - more resources