. 2013 Oct;14(10):1078-90.
doi: 10.1111/tra.12094. Epub 2013 Aug 18.

Characterization of the late endosomal ESCRT machinery in Trypanosoma brucei

Affiliations

Characterization of the late endosomal ESCRT machinery in Trypanosoma brucei

Jason S Silverman et al. Traffic. 2013 Oct.

Abstract

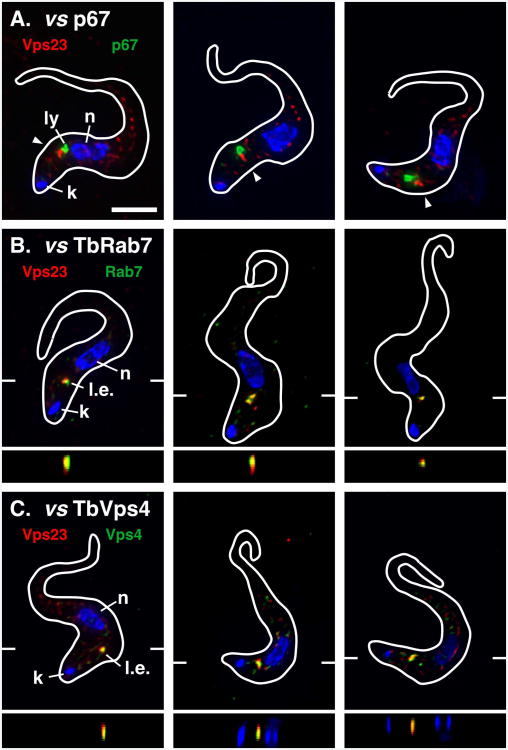
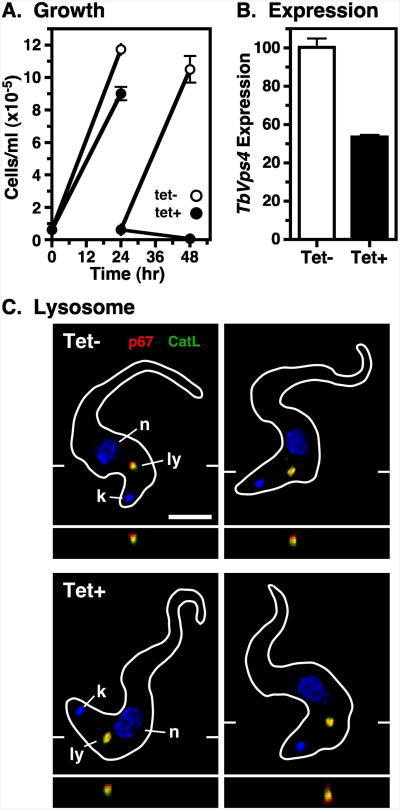
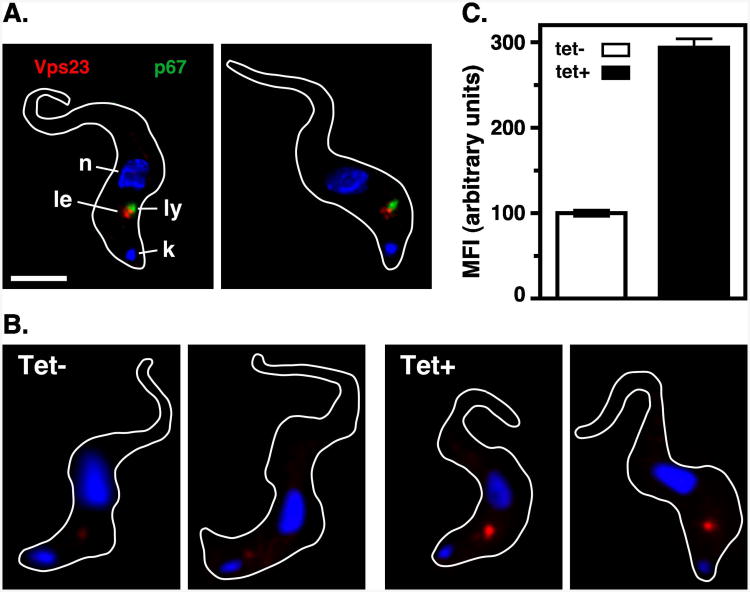
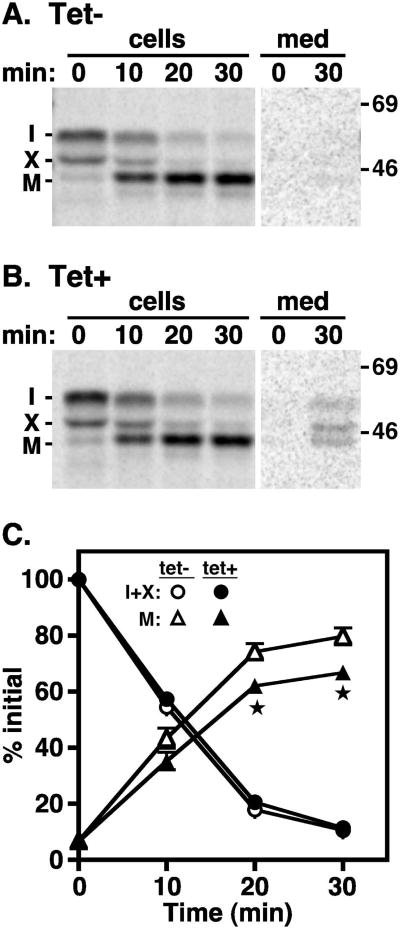
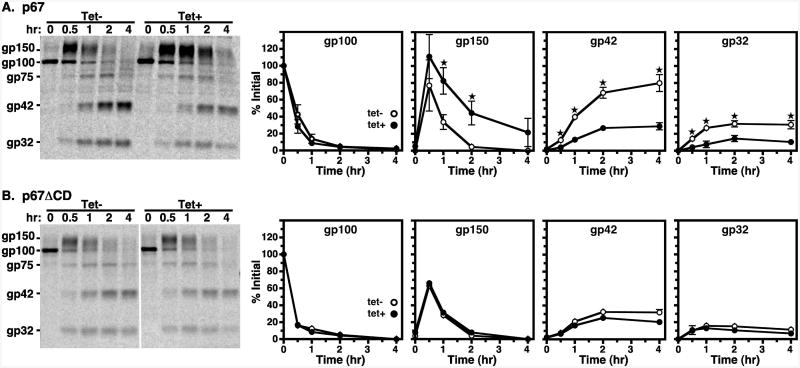
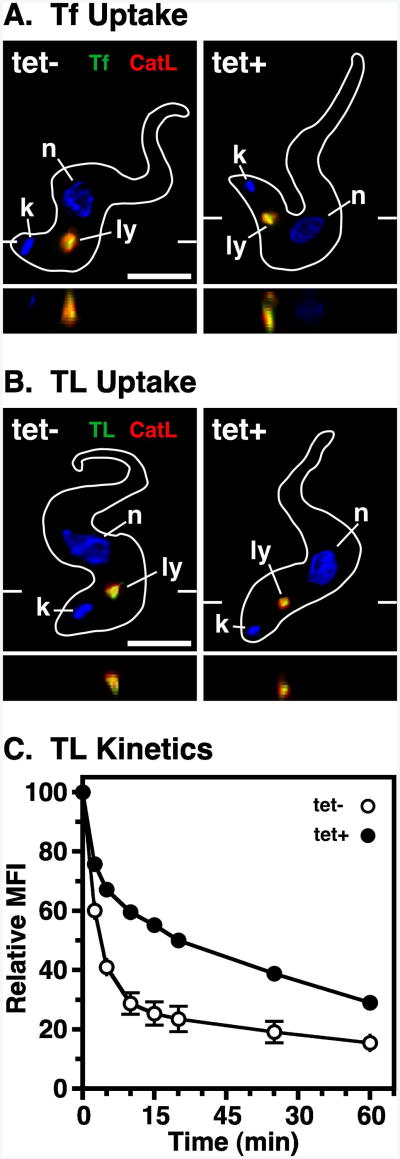
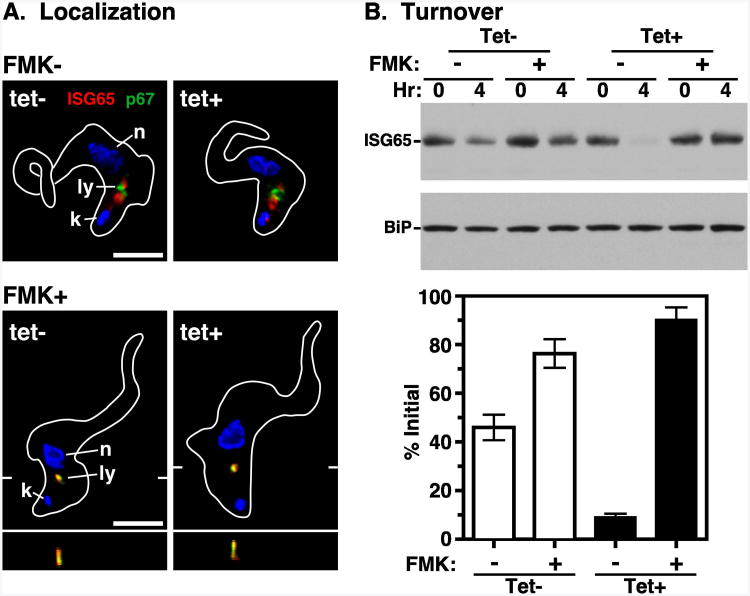
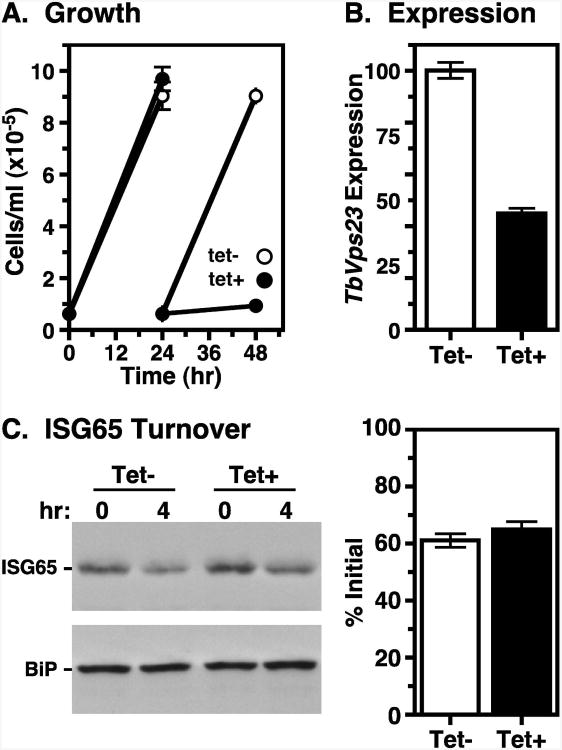
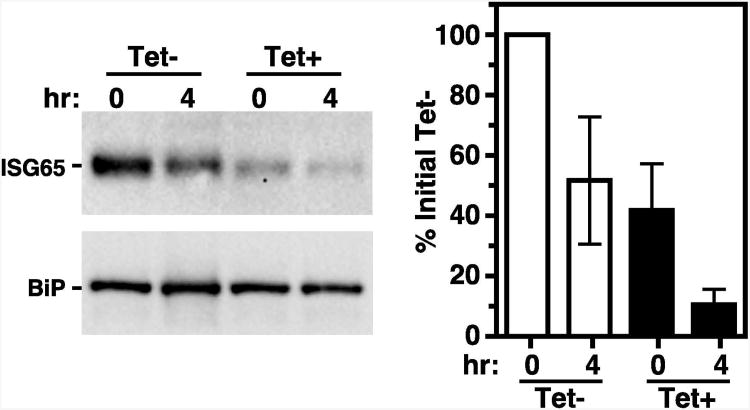
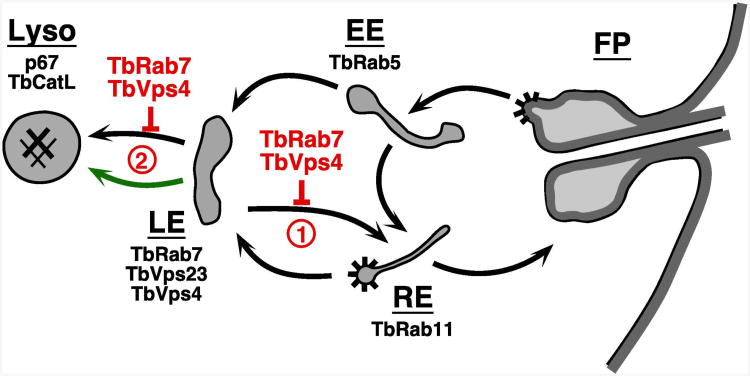
The multivesicular body (MVB) is a specialized Rab7+ late endosome (LE) containing multiple intralumenal vesicles that function in targeting ubiquitinylated cell surface proteins to the lysosome for degradation. African trypanosomes lack a morphologically well-defined MVB, but contain orthologs of the ESCRT (Endosomal Sorting Complex Required for Transport) machinery that mediates MVB formation. We investigate the role of TbVps23, an early ESCRT component, and TbVps4, the terminal ESCRT ATPase, in lysosomal trafficking in bloodstream form trypanosomes. Both localize to the TbRab7+ LE and RNAi silencing of each rapidly blocks growth. TbVps4 silencing results in approximately threefold accumulation of TbVps23 at the LE, consistent with blocking terminal ESCRT disassembly. Trafficking of endocytic and biosynthetic cargo, but not default lysosomal reporters, is also negatively affected. Others reported that TbVps23 mediates ubiquitin-dependent lysosomal degradation of invariant surface glycoproteins (ISG65) (Leung et al., Traffic 2008;9:1698-1716). In contrast, we find that TbVps23 ablation does not affect ISG65 turnover, while TbVps4 silencing markedly enhances lysosomal degradation. We propose several models to accommodate these results, including that the ESCRT machinery actually retrieves ISG65 from the LE to earlier endocytic compartments, and in its absence ISG65 traffics more efficiently to the lysosome. Overall, these results confirm that the ESCRT machinery is essential in Trypanosoma brucei and plays important and novel role(s) in LE function in trypanosomes.

Keywords: ESCRT; MVB; invariant surface glycoprotein; late endosome; lysosome; trypanosome.


Conflict of interest statement

The authors have no conflicting interests to report.

Figures

Figure 1
Figure 1. TbVps23 localization
Immunofluorescence microscopy was performed on fixed/permeabilized BSF cells expressing in situ epitope tagged TbVps23-HA (A), TbVps23-HA and Ty-TbRab7 (B), or TbVps23-HA and TbVps4-Ty (C). In each case staining for TbVps23-HA is with rabbit anti-HA (red). Staining for p67 is with monoclonal anti-p67 (A, green) and staining for Ty-TbRab7 (B) and TbVps4-Ty (C) is with monoclonal anti-Ty (green). The target reporter proteins are color-coded, and the locations of the nucleus (n), kinetoplast (k), lysosome (l), and late endosome (l.e.) are indicated (left panels only). Arrowheads indicate regions of prominent TbVps23-HA localization (A only). In each case three representative deconvolved images are shown as merged three-channel summed stack projections with corresponding z transects through the late endosome (B & C only, indicated by marginal hatch marks in the x-y images). Cells were stained with DAPI to detect the nucleus and kinetoplast and cell outlines were traced from matching differential interference contrast (DIC) images. All images are of interphase cells (1k1n). Bar indicates 5 microns (top left only). See Fig. S1 for corresponding non-deconvolved red channel images for anti-HA (A, TbVps23-HA) and anti-Ty (C, TbVps4) stained cells.
Figure 2
Figure 2. TbVps4 RNAi: growth and morphology
TbVps4 BSF RNAi cell line was cultured without (tet-) or with (tet+) tetracycline resulting in control or TbVps4 silenced cells, respectively. (A) Cell density was measured over time by hemocytometer and adjusted daily to starting density. Data are means ± SEM (n=3). All subsequent analyses using these cells were performed at 20 hr of induction, unless otherwise indicated. (B) TbVps4 message levels in control and silenced cells were determined by qRT-PCR. Normalized data are means ± SEM (n=3). (C) Immunofluorescence microscopy was performed as in Fig. 1 with anti-p67 (red) and anti-TbCatL (green). The target reporter proteins are color-coded, and the locations of the nucleus (n), kinetoplast (k), and lysosome (l) are indicated. Representative deconvolved summed stack images are presented with corresponding z transects through the lysosome. Bar indicates 5 microns (left only).
Figure 3
Figure 3. TbVps4 RNAi: TbVps23 localization
TbVps4 BSF RNAi cells expressing in situ tagged TbVps23-HA were cultured in the absence or presence (20 hr) of tetracycline as in Fig. 2. (A) TbVps23-HA was localized after TbVps4 silencing using anti-HA (red, late endosome) and anti-p67 (green, lysosome) as described in Fig. 1. Representative deconvolved summed stack images are presented. The target reporter proteins are color-coded, and the locations of the nucleus (n), kinetoplast (k), and lysosome (l), and late endosome (le) are indicated (left only). (B) Non-deconvolved images of cells stained for TbVps23-HA (red). Shown are two representative images each of control (tet-) and TbVps4 silenced (tet+) cells. All images were acquired at identical exposure time and were contrast enhanced identically. (C) Quantification of TbVps23-HA fluorescence. Mean fluorescent intensity of the prominent post-nuclear TbVps23-HA signal was measured using NIH ImageJ as described in Methods. All measured images were acquired identically and only raw, unenhanced images were quantified. Data are means ± SEM (n=50 over three biological replicates).
Figure 4
Figure 4. TbVps4 RNAi: TbCatL trafficking
TbVps4 BSF RNAi cells were pulse radiolabeled (10 min) and chased for the indicated times. (A & B) Cell lysates and media fractions were prepared from control (A, Tet-) and silenced (B, Tet+, 20 hr) cells, and TbCatL polypeptides were specifically immunoprecipitated with anti-TbCatL antibodies. Immunoprecipitates were fractionated by SDS-PAGE (107 cell equivalents/lane) and visualized by phosphorimaging. Representative images are shown with mobilities of immature proprotein (I), uncharacterized precursor form (X), and mature lysosomal form (M) indicated on the left. Mobilites of molecular mass markers are indicated on the right (kDa). Individual panels were digitally excised from the same exposure of the same gel. Lanes containing cell fractions were processed identically. Lanes containing media fractions were also processed identically and were deliberately over-contrasted to reveal secreted forms of TbCatL. (C) Quantification of TbCatL turnover. Precursor (I+X) and mature (M) forms are presented as a percentage of initial (I+X). Data are means ± SEM (n=3) with asterisks indicating significance of p<0.05 determined as described in Methods.
Figure 5
Figure 5. TbVps4 RNAi: p67 and default trafficking
Turnover of endogenous p67 and the transgenic p67ΔCD-3×HA default reporter in control (tet-, open circles) and TbVps4 silenced (tet+, closed circles) cells were determined by pulse-chase analyses as in Fig 4. (A) Endogenous p67 was immunoprecipitated at the indicated times from TbVps4 RNAi cells with anti-p67. (B) Default trafficking was likewise analyzed in TbVps4 RNAi cells constitutively expressing the transgenic p67ΔCD-3times;HA default trafficking reporter. Immunoprecipitation was performed with anti-HA. (A & B) Immunoprecipitates were fractionated by SDS-PAGE (107 cell equivalents/lane) and visualized by phosphorimaging. Single representative phosphorimages are presented on the left. Mobilities of initial ER gp100, Golgi-modified gp150, and quasi-stable lysosomal gp42 and gp32 glycoforms are indicated. The vertical white line in Panel B indicates irrelevant lanes that were digitally removed after contrast enhancement. Turnover of individual glycoforms was quantified as a percentage of initial gp100 and are presented graphically (to the right). Data are means ± SEM (n=3) with asterisks indicating statistical significance of p<0.05 or greater as determined as described in Methods.
Figure 6
Figure 6. TbVps4 RNAi: endocytosis
TbVps4 BSF RNAi cell line was cultured (20 hr) without (tet-) or with (tet+) tetracycline resulting in control or TbVps4 silenced cells, respectively. (A) Cells were incubated with Tf:Bio at 37°C for 30 min allowing endocytosis to occur, and then chased for 20 min in fresh media before processing for immunofluorescence microscopy as in Fig. 1. FMK024 (20 μM) was added for 30 minutes preceding and throughout the uptake and chase period to prevent degradation in the lysosome. Cells were probed with anti-TbCatL (red, lysosome) and streptavidin-alexa488 (green, TL). The target reporter proteins are color-coded, and the locations of the nucleus (n), kinetoplast (k), and lysosome (ly) are indicated. Representative deconvolved summed stack images are shown with corresponding z transects through the lysosome. Bar indicates 5 microns (left only). (B) Endocytosis of TL:Bio and subsequent microscopy was performed as above, except that FMK024 was omitted. (C) Kinetics of endocytosis was determined using pH-sensitive TL-FITC. Cells were incubated with TL-FITC at 5°C for 30 min to allow binding and washed into fresh media at 37°C to allow uptake. Mean fluorescence intensity (MFI) was measured over time by flow cytometry. Data are normalized to initial bound TL-FITC and are means ± SEM (n=2).
Figure 7
Figure 7. TbVps4 RNAi: ISG65 turnover
The TbVps4 BSF RNAi cell line was cultured (20 hr) without (tet-) or with (tet+) tetracycline resulting in control or TbVps4 silenced cells, respectively. (A) ISG65 localization was determined in untreated cells (top) or cells co-treated with FMK024 (1 hr, 20 μM) to block degradation in the lysosome (bottom). Staining was performed using anti-p67 (green) and anti-ISG65 (red) as in Fig. 1. Representative images are presented as summed stack projections with corresponding z transects through the lysosome (bottom only). The target reporter proteins are color-coded, and the locations of the nucleus (n), kinetoplast (k), and lysosome (l) are indicated (left only). Bars indicate 5 microns. (B) Inhibition of protein synthesis with cycloheximide (100 μg ml-1) was used to quantify the rate of ISG65 turnover. As indicated, cells were incubated in the absence or presence of FMK024 (20 μM) for 30 min before cycloheximide addition, and continually during the subsequent chase. Whole cell lysates were prepared at the indicated times, fractionated by SDS-PAGE (107 cell equivalents/lane), and transferred to membranes for immunoblotting. Membranes were probed with anti-ISG65, stripped, and reprobed with anti-BiP as a loading control. Representative blots are presented (top). ISG65 signals were quantified using NIH Image J and normalized to the corresponding BiP signals. Turnover is presented graphically as percentage (means ± SEM; n=3) of initial ISG65 (bottom).
Figure 8
Figure 8. TbVps23 RNAi: ISG65 turnover
TbVps23 BSF RNAi cells were cultured without (tet-) or with (tet+) tetracycline resulting in control or silenced cells, respectively. (A) Cell densities (means ± SEM; n=3) were measured over time by hemocytometer as in Fig. 2. All subsequent analyses using these cells were performed at 24 hr of induction. (B) TbVps23 message levels in control and silenced cells were determined by qRT-PCR. Normalized data are means ± SEM (n=3). (C) Cycloheximide treatment was used to quantify the rate of ISG65 turnover as in Fig. 7. Representative blots are presented (left). Turnover is quantified (right) as means ± SEM (n=3) and presented graphically as percentage of initial ISG65.
Figure 9
Figure 9. TbRab7 RNAi; ISG65 turnover
A TbRab7 RNAi cell line (25) was cultured (28 hr) without (tet-) or with (tet+) tetracycline resulting in control or silenced cells, respectively. Cycloheximide treatment was used to quantify the rate of ISG65 turnover as in Fig. 7. Representative blots are presented (left). Turnover is quantified (right) as means ± SEM (n=4) and presented graphically as percentage of initial ISG65 in the control T0 sample.
Figure 10
Figure 10. Proposed ISG65 trafficking pathways
Schematic diagram of the endocytic pathways of trypanosomes. Black arrows indicate documented routes between the flagellar pocket (FP), early endosome (EE), recycling endosome (RE), late endosome (LE), and the terminal lysosome (Lyso). Validated markers for each compartment are: early endosome, TbRab5 (58); recycling endosome, TbRab11 (59); late endosome, TbRab7 (14, 25), TbVps23 and TbVps4 (this work); lysosome, p67 (19, 60), TbCatL (32, 61). Spiny coats indicate known sites of clathrin coated vesicle formation (4, 62). Points at which silencing of TbRab7 and TbVps4 may affect ISG65 trafficking are indicated in red (1 & 2, discussed in text). Green arrow indicates possible alternate accelerated pathway to the lysosome (discussed in text).

Similar articles

Cited by

References

    1. Rudenko G. African trypanosomes: the genome and adaptations for immune evasion. Essays Biochem. 2011;51:47–62. - PubMed
    1. Schwede A, Carrington M. Bloodstream form trypanosome plasma membrane proteins: antigenic variation and invariant antigens. Parasitol. 2010;137:2029–2039. - PubMed
    1. Langreth SG, Balber AE. Protein uptake and digestion in bloodstream and culture forms of Trypanosoma brucei. J Protozool. 1975;22:40–53. - PubMed
    1. Morgan GW, Allen CL, Jeffries TR, Hollinshead M, Field MC. Developmental and morphological regulation of clathrin-mediated endocytosis in Trypanosoma brucei. J Cell Sci. 2001;114:2605–2015. - PubMed
    1. Pamer EG, So M, Davis CE. Identification of a developmentally regulated cysteine protease of Trypanosoma brucei. Mol Biochem Parasitol. 1989;33:27–32. - PubMed

Publication types

MeSH terms

Substances

LinkOut - more resources