

Linking great apes genome evolution across time scales using polymorphism-aware phylogenetic models
- PMID: 23906727
- PMCID: PMC3773373
- DOI: 10.1093/molbev/mst131
Linking great apes genome evolution across time scales using polymorphism-aware phylogenetic models
Abstract
The genomes of related species contain valuable information on the history of the considered taxa. Great apes in particular exhibit variation of evolutionary patterns along their genomes. However, the great ape data also bring new challenges, such as the presence of incomplete lineage sorting and ancestral shared polymorphisms. Previous methods for genome-scale analysis are restricted to very few individuals or cannot disentangle the contribution of mutation rates and fixation biases. This represents a limitation both for the understanding of these forces as well as for the detection of regions affected by selection. Here, we present a new model designed to estimate mutation rates and fixation biases from genetic variation within and between species. We relax the assumption of instantaneous substitutions, modeling substitutions as mutational events followed by a gradual fixation. Hence, we straightforwardly account for shared ancestral polymorphisms and incomplete lineage sorting. We analyze genome-wide synonymous site alignments of human, chimpanzee, and two orangutan species. From each taxon, we include data from several individuals. We estimate mutation rates and GC-biased gene conversion intensity. We find that both mutation rates and biased gene conversion vary with GC content. We also find lineage-specific differences, with weaker fixation biases in orangutan species, suggesting a reduced historical effective population size. Finally, our results are consistent with directional selection acting on coding sequences in relation to exonic splicing enhancers.
Keywords: biased gene conversion; coding sequence evolution; mutation rates; phylogenetics-population genetics model; primates evolution; rate heterogeneity.
Figures
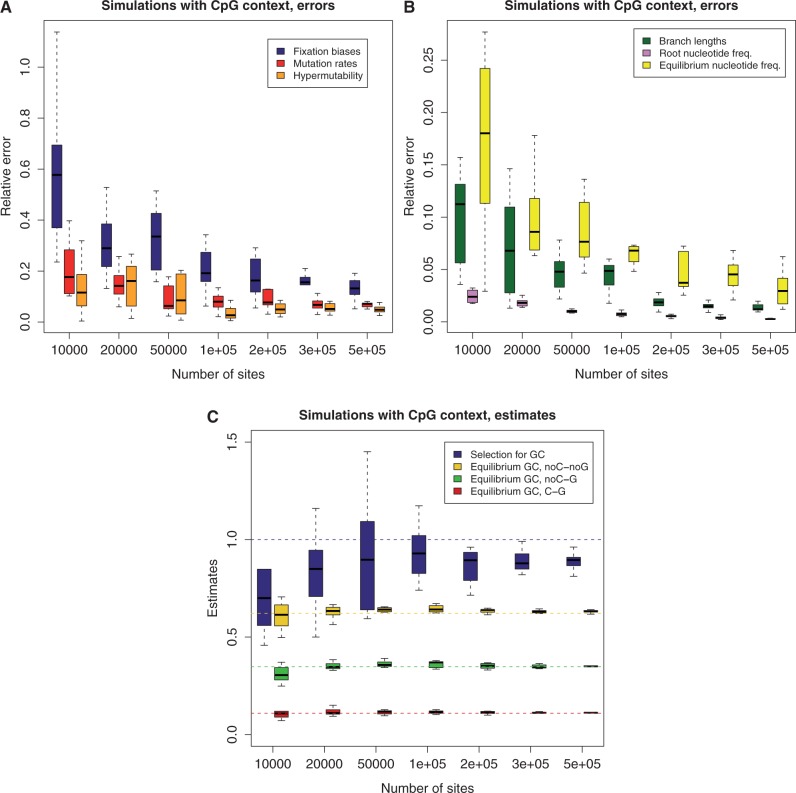
 . On X axis is the number of sites in the data set used. Each box plot represents 10 simulations. The errors in the estimation, on the Y axis, were calculated as the Euclidean distance between the vector of estimated parameters and the true values, normalized by the Euclidean norm of the true vector. (A) Error in estimation of: fixation biases (6 entries vector, one for each substitution type, blue box plot), non-CpG mutation rates (6 entries, red), and CpG hypermutability (single-entry vector, orange). (B) Error in estimation of: branch lengths (green), ancestral nucleotide frequencies (pink), and equilibrium nucleotide frequencies (yellow). (C) Estimates of: GC versus AT fixation bias (blue), GC* in sites not preceded by C and not followed by G (yellow), GC* in sites not preceded by C and followed by G (green), and GC* in sites preceded by C and followed by G (red). The horizontal dashed lines represent the respective true values used for the simulations.
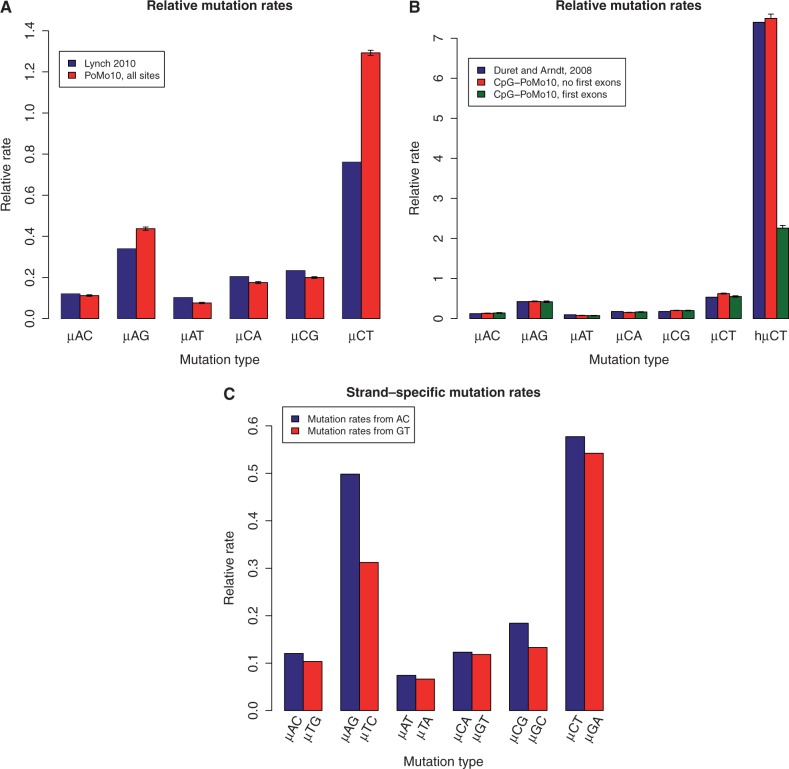
 . (B) Estimates of relative mutation rates by Duret and Arndt (2008) in human-chimp (blue), CpG-PoMo10 in great apes without first exons (red), and CpG-PoMo10 on first exons only (green). hμCT represents the hypermutability from C to T and from G to A in CpG context. Error bars in (A and B) show the profile likelihood 95% confidence intervals. (C) Mutation rates from A and C nucleotides (red) compared with mutation rates from G and T (blue). In both cases, we refer to the nucleotide on the sense strand. We paired reverse-complement mutation types to remark strand-asymmetries. All rates are estimated with asy-CpG-PoMo10b on the whole data (see Materials and Methods).
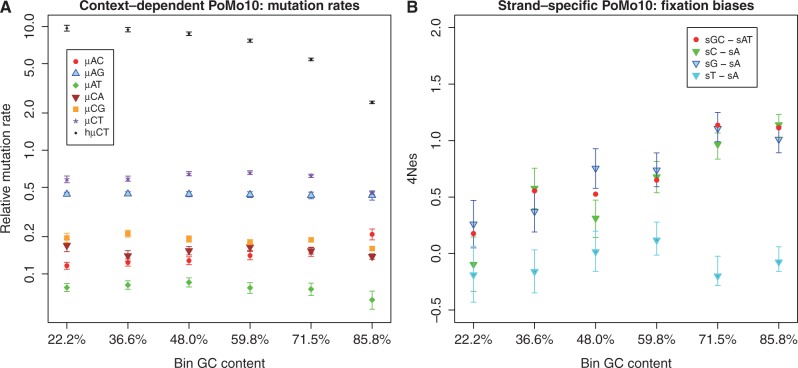
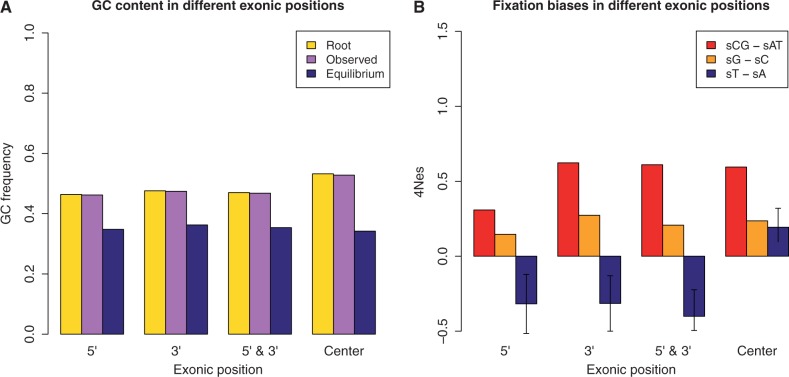
 . μAC stands for mutation rate from A to C, etc. hμCT stands for CpG hypermutability. (B) Estimation of fixation biases with the strand-specific asy-CpG-PoMo10b. GC–sAT represents the apparent selective advantage of GC versus AT, sC–sA between C and A, sG–sA between G and A, and sT–sA between T and A.
 , in the other two
  . Error bars show the profile likelihood 95% confidence intervals.
References
-
- Alvarez-Valin F, Clay O, Cruveiller S, Bernardi G. Inaccurate reconstruction of ancestral GC levels creates a vanishing isochores effect. Mol Phylogenet Evol. 2004;31:788–793. - PubMed
-
- Belle E, Duret L, Galtier N, Eyre-Walker A. The decline of isochores in mammals: an assessment of the GC content variation along the mammalian phylogeny. J Mol Evol. 2004;58:653–660. - PubMed
Publication types
MeSH terms
Grants and funding
LinkOut - more resources
Full Text Sources
Other Literature Sources
Research Materials
Miscellaneous
