

Analysis of morphological features and vascular layers of choroid in diabetic retinopathy using spectral-domain optical coherence tomography
- PMID: 23907153
- PMCID: PMC4045010
- DOI: 10.1001/jamaophthalmol.2013.4321
Analysis of morphological features and vascular layers of choroid in diabetic retinopathy using spectral-domain optical coherence tomography
Abstract
Importance: Diabetic retinopathy (DR) is characterized by microaneurysms, capillary nonperfusion, and ischemia within the retina, ultimately leading to neovascularization and/or macular edema. Evidence suggests that choroidal angiopathy may coexist with retinal vascular damage. Recent advances in spectral-domain optical coherence tomography (SD-OCT) permit an efficient visualization of the choroid.
Objective: To analyze the morphological features and vascular layers of the choroid in patients with DR using SD-OCT.
Design: A cross-sectional retrospective review identified patients with DR and healthy (control) subjects who underwent 1-line raster scanning from February 1, 2010, through June 30, 2012. Patients were classified into the following 3 groups: nonproliferative DR without macular edema (9 eyes), proliferative DR without macular edema (PDR) (10 eyes), and diabetic macular edema (DME) (14 eyes). Two independent raters experienced in analyzing OCT images evaluated the morphological features and vasculature of the choroid.
Setting: New England Eye Center.
Participants: Thirty-three eyes of 33 patients with DR and 24 eyes of 24 controls.
Exposure: Diabetic retinopathy.
Main outcome and measure: Choroidal morphological features and vasculature analysis.
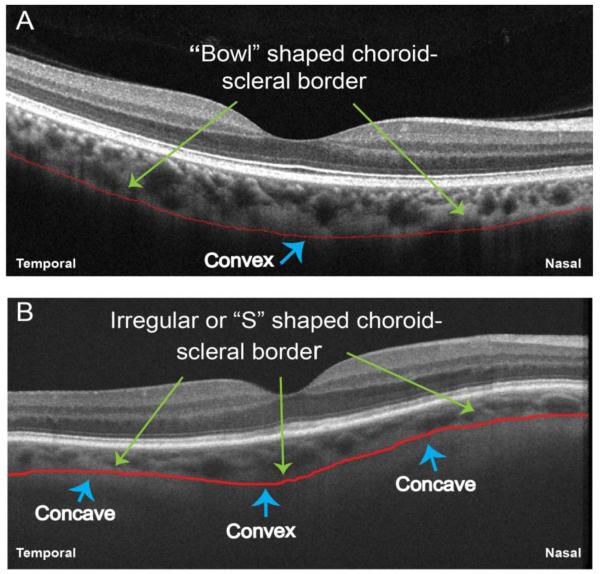
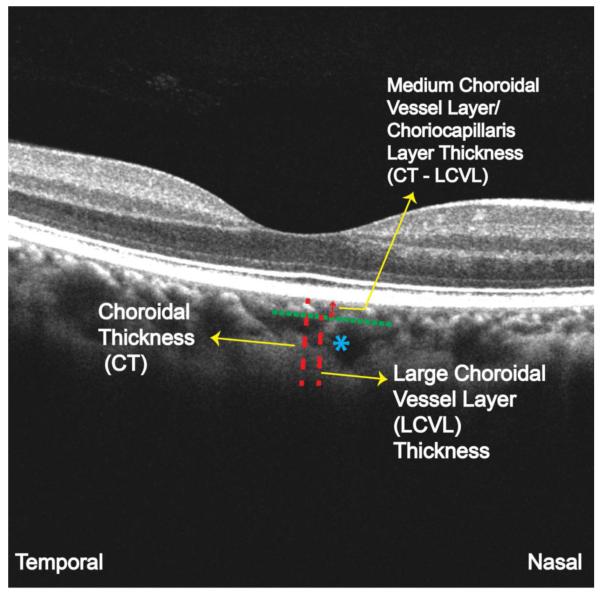
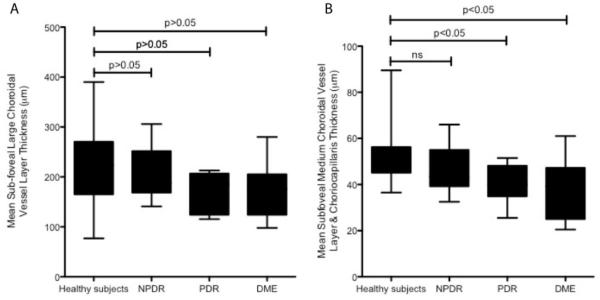
Results: The choroidoscleral interface had an irregular contour in 8 of 9 eyes with nonproliferative DR (89%), 9 of 10 eyes with PDR (90%), and 13 of 14 eyes with DME (93%) compared with 0 of 24 controls. The thickest point of the choroid was displaced from under the fovea, and focal choroidal thinning was observed in eyes with DR. Mean subfoveal choroidal thickness and mean subfoveal medium choroidal vessel layer and choriocapillaris layer thickness were significantly reduced in eyes with PDR (P < .05) and DME (P < .05) compared with controls.
Conclusions and relevance: Choroidal morphological features are altered in patients with moderate to severe DR. The subfoveal choroidal thickness and the subfoveal medium choroidal vessel layer and choriocapillaris layer thicknesses are significantly reduced in patients with PDR and DME. To our knowledge, this is the first study to analyze the morphological features and vasculature of the choroid in DR using SD-OCT. These findings may be clinically useful in predicting the progression of DR.
Figures


References
-
- Antonetti DA, Klein R, Gardner TW. Diabetic retinopathy. N Engl J Med. 2012;366(13):1227–1239. - PubMed
-
- Shiragami C, Shiraga F, Matsuo T, Tsuchida Y, Ohtsuki H. Risk factors for diabetic choroidopathy in patients with diabetic retinopathy. Graefes Arch Clin Exp Ophthalmol. 2002;240(6):436–442. - PubMed
-
- Bartsch DU, Weinreb RN, Zinser G, Freeman WR. Confocal scanning infrared laser ophthalmoscopy for indocyanine green angiography. Am J Ophthalmol. 1995;120(5):642–651. - PubMed
-
- Dimitrova G, Kato S, Tamaki Y, et al. Choroidal circulation in diabetic patients. Eye (Lond) 2001;15(pt 5):602–607. - PubMed
-
- Fukushima I, McLeod DS, Lutty GA. Intrachoroidal microvascular abnormality: a previously unrecognized form of choroidal neovascularization. Am J Ophthalmol. 1997;124(4):473–487. - PubMed
Publication types
MeSH terms
Grants and funding
LinkOut - more resources
Full Text Sources
Other Literature Sources
Medical
