. 2013:4:2250.
doi: 10.1038/ncomms3250.

Phosphatidylinositol-3-phosphate regulates sorting and processing of amyloid precursor protein through the endosomal system

Affiliations

Phosphatidylinositol-3-phosphate regulates sorting and processing of amyloid precursor protein through the endosomal system

Etienne Morel et al. Nat Commun. 2013.

Abstract

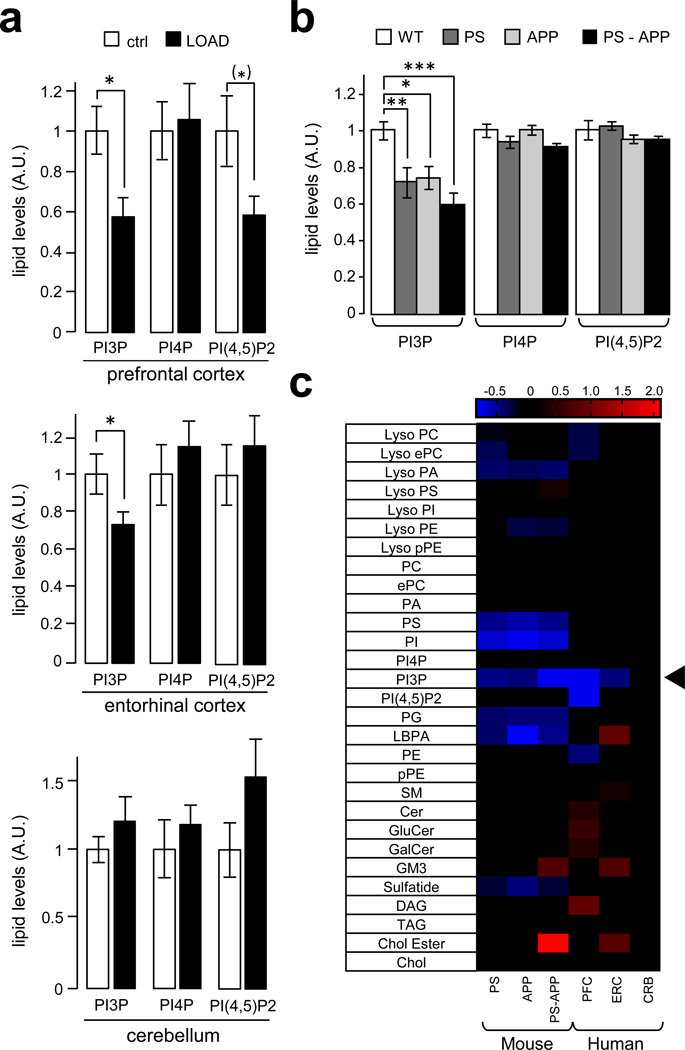
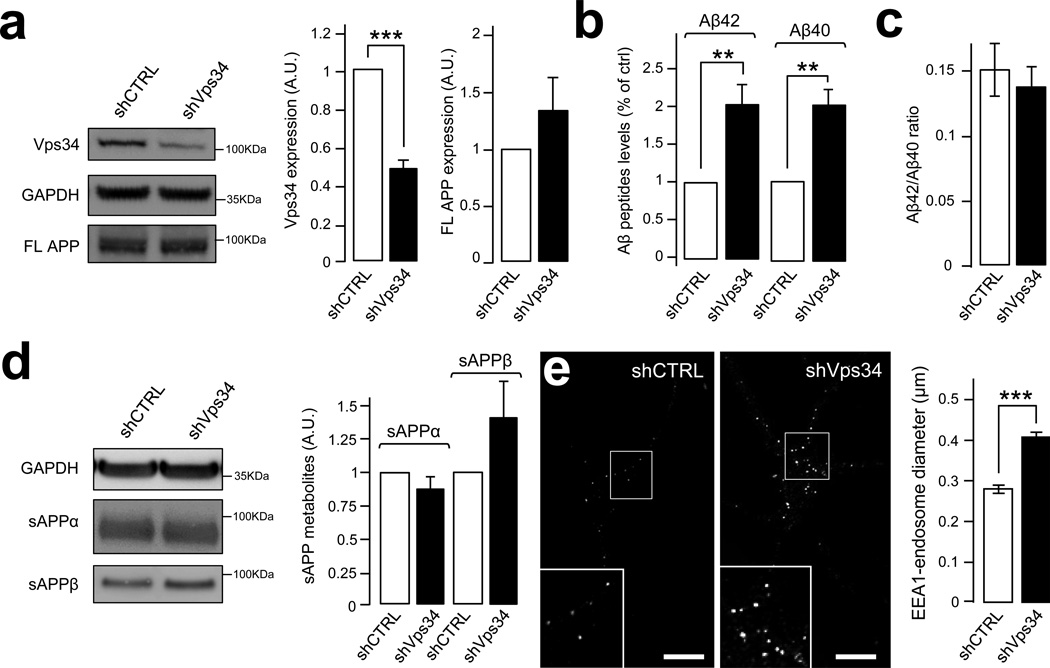
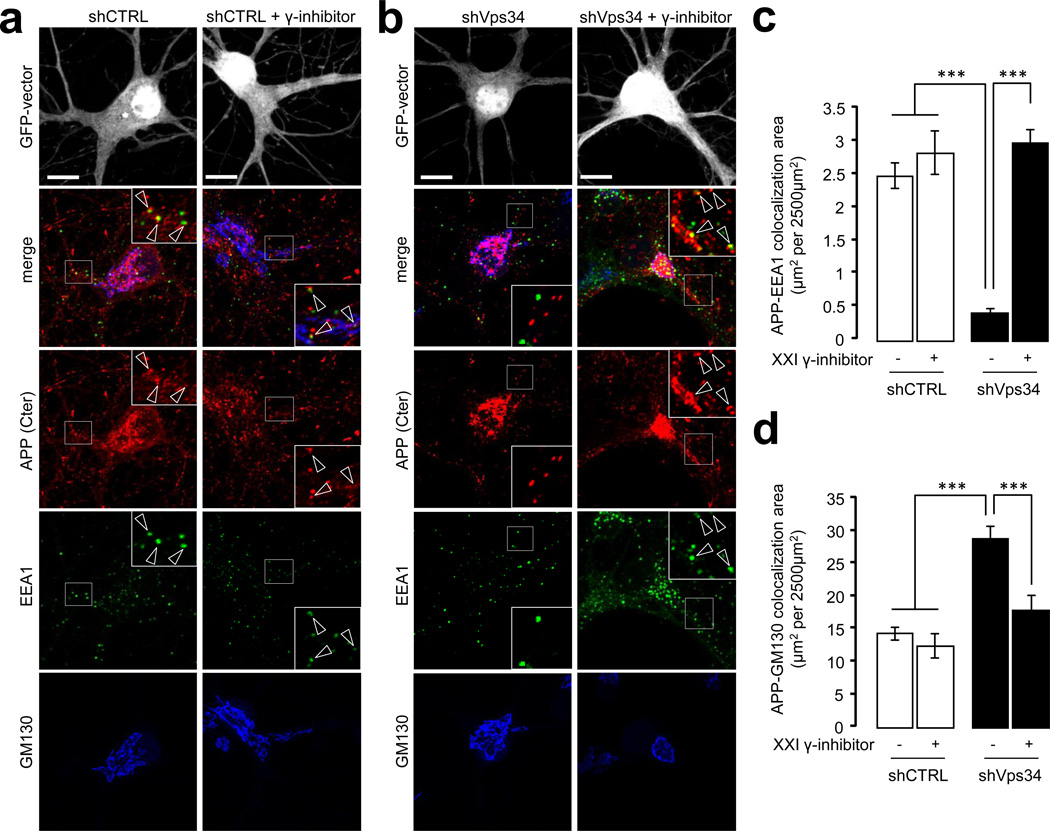
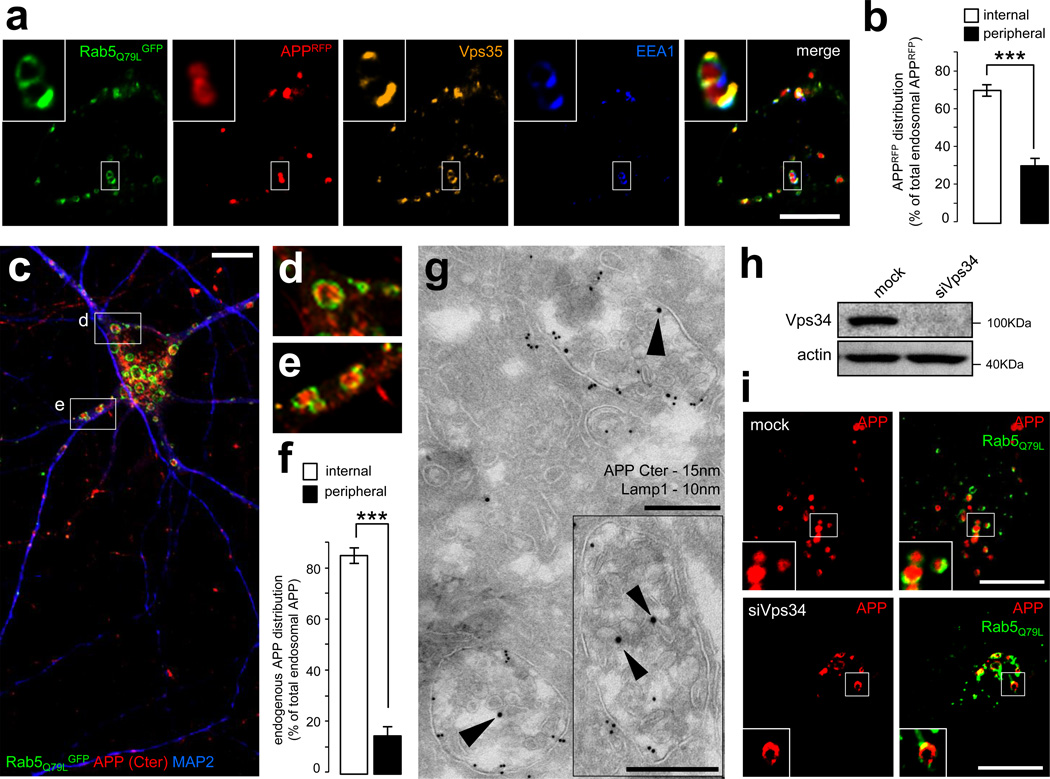
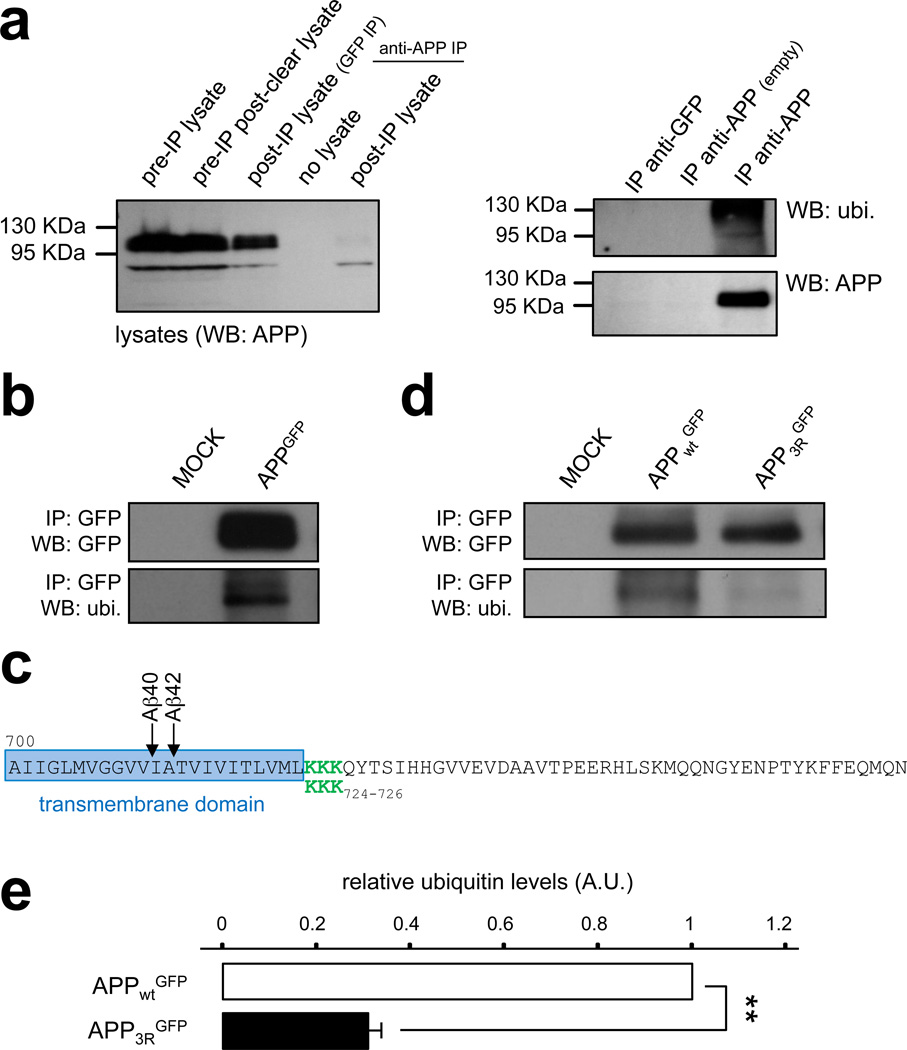
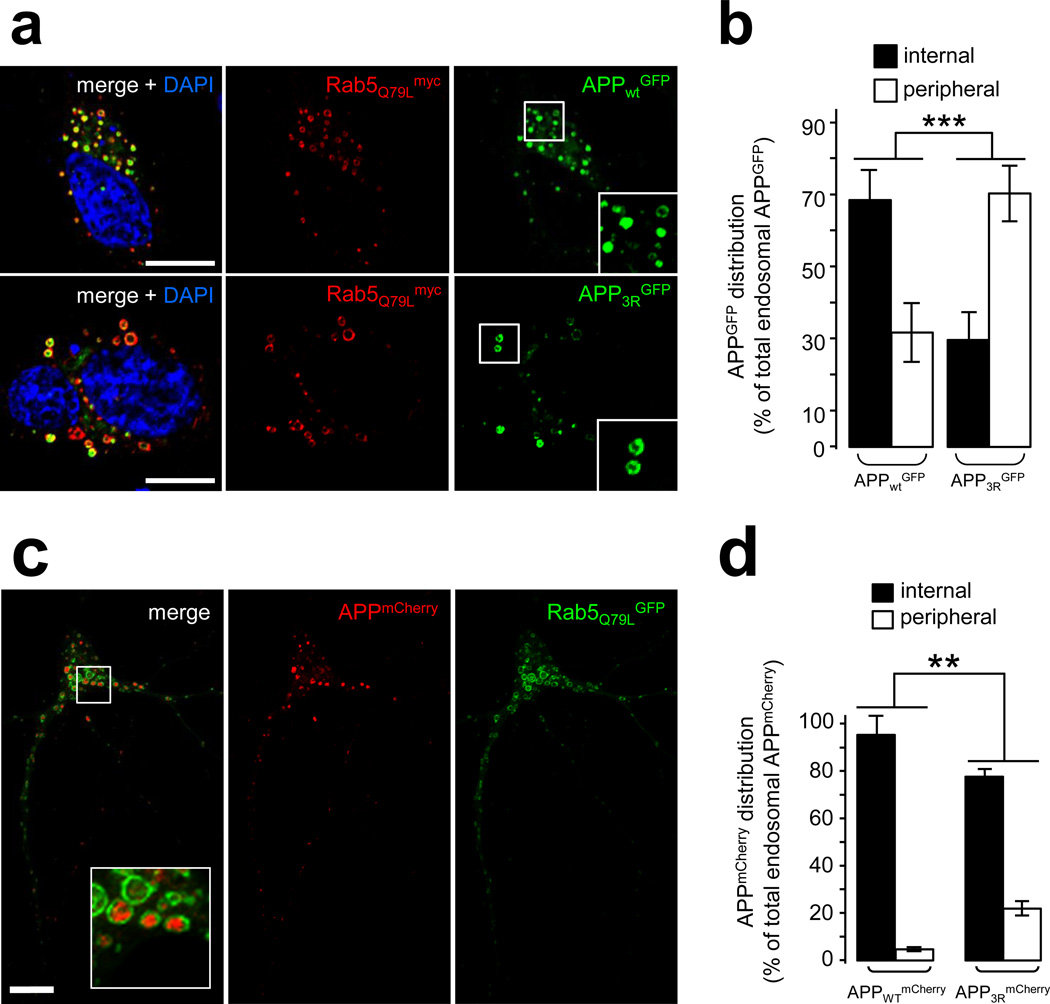
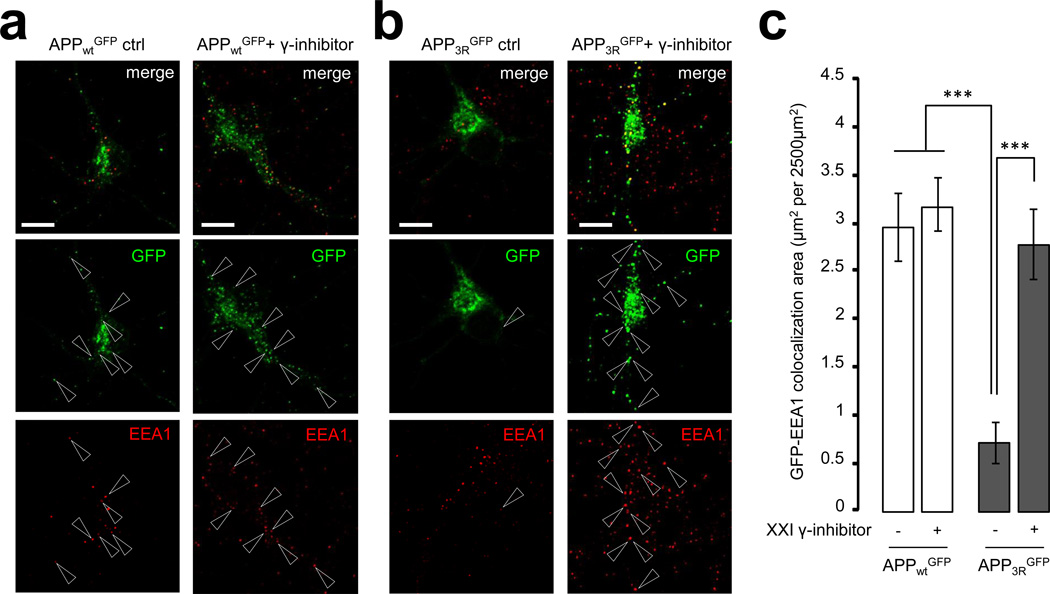
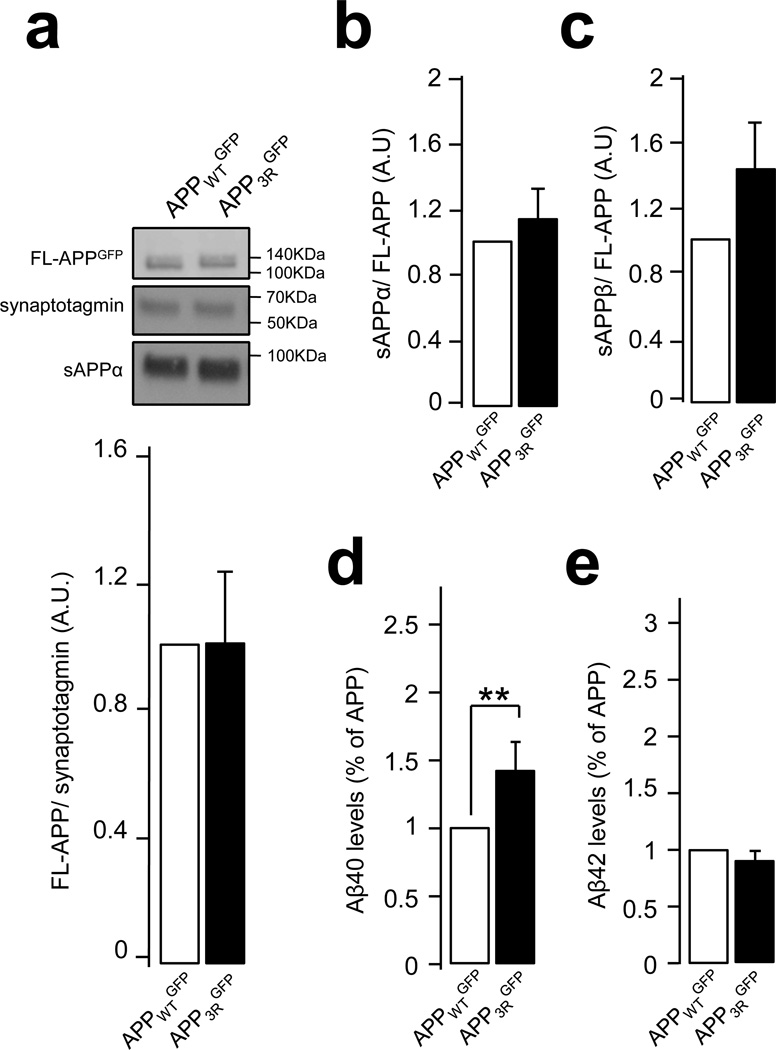
Defects in endosomal sorting have been implicated in Alzheimer's disease. Endosomal traffic is largely controlled by phosphatidylinositol-3-phosphate, a phosphoinositide synthesized primarily by lipid kinase Vps34. Here we show that phosphatidylinositol-3-phosphate is selectively deficient in brain tissue from humans with Alzheimer's disease and Alzheimer's disease mouse models. Silencing Vps34 causes an enlargement of neuronal endosomes, enhances the amyloidogenic processing of amyloid precursor protein in these organelles and reduces amyloid precursor protein sorting to intraluminal vesicles. This trafficking phenotype is recapitulated by silencing components of the ESCRT (Endosomal Sorting Complex Required for Transport) pathway, including the phosphatidylinositol-3-phosphate effector Hrs and Tsg101. Amyloid precursor protein is ubiquitinated, and interfering with this process by targeted mutagenesis alters sorting of amyloid precursor protein to the intraluminal vesicles of endosomes and enhances amyloid-beta peptide generation. In addition to establishing phosphatidylinositol-3-phosphate deficiency as a contributing factor in Alzheimer's disease, these results clarify the mechanisms of amyloid precursor protein trafficking through the endosomal system in normal and pathological states.


Figures

Figure 1
Figure 1. PI3P levels are decreased in human and mouse brain affected by AD
a) Bar diagram showing relative phosphoinositide levels in prefrontal cortex, entorhinal cortex and cerebellum from post-mortem brains of either non-Alzheimer disease human subjects (ctrl) or late-onset Alzheimer disease human subjects (LOAD). Measurements were made by anionic exchange HPLC with suppressed conductivity detection and expressed in arbitrary units, relative to control levels. Values are shown as means ± SEM (prefrontal cortex, ctrl n=10 and LOAD n=10; entorhinal cortex and cerebellum, ctrl n=12 and LOAD n=15). The PI(4,5)P2 deficiency in the PFC was significant (P < 0.05) with a one-tailed Student's t-test and is indicated by (*) (see Methods). Otherwise single asteriks denote P values < 0.05 from a One-way ANOVA with post-hoc Tukey test. b) Bar diagram showing relative phosphoinositide levels in the forebrain of FAD mouse models. These include the PSEN1M146V (PS), the Swedish mutant of APPK670N,M671L (APP) and the PS-APP double transgenic lines. Measurements were made by anionic exchange HPLC with suppressed conductivity detection and expressed in arbitrary units, relative to control levels. Values are shown as means ± SEM (n=6). *, **, and *** denote P values < 0.05, 0.01 and 0.001 from a One-way ANOVA with post-hoc Tukey test. c) Heat map showing all lipid classes measured and organized according to phospholipids, sphingolipids and neutral lipids classification. The PS, APP, PS-APP columns represent the normalized values of the individual lipid species of mutant mice compared to wild type mice while the PFC, ERC and CRB columns represent the normalized values of the individual lipid species of LOAD patients compared to control patients for each tissue type. The color bars represents the log2 value of the ratio of each lipid species and only statistically significant changes are shown (P < 0.05). Prefrontal cortex, ctrl n=10 and LOAD n=10; entorhinal cortex and cerebellum, ctrl n=12 and LOAD n=15. The arrowhead indicates the PI3P change.
Figure 2
Figure 2. Silencing of Vps34 leads to increased amyloidogenic processing of neuronal APP
a) Western blot analysis (left panel) of endogenous Vps34 and full-length APP (FL-APP) levels in cultured mouse cortical neurons infected with Vps34 shRNA lentivirus (shVps34) or a control lentivirus (shCTRL). GAPDH was used as an equal loading marker. The graphs show the quantification of Vps34 levels (middle panel) and FL-APP levels (right panel) in arbitrary units. Values denote means ± SEM (n=17). *, denotes P values < 0.05 from a Student's t-test. b) Bar diagram showing murine Aβ42 and Aβ40 levels measured by ELISA from cultured cortical neuron media, after infection with shCTRL or shVps34 lentiviruses. Aβ levels were normalized to the cell lysate total protein. Values are shown as means ± SEM (n=13). **, denotes P values < 0.01 from a Student's t-test. c) Bar diagram showing the Aβ42/ Aβ40 ratio measured from experiments described in (b) and shown as means ± SEM (n=13). d) Quantification of secreted APP metabolites derived from the cleavage of murine APP by α-secretase (sAPPα) or β-secretase (sAPPβ) after infection of cultured cortical neurons with shCTRL or shVps34 lentiviruses. Left panel, Western blot analysis of secreted fragments in the media alongside the loading control GAPDH. Right panel, Bar diagram showing the quantification of sAPPα (left bars) and sAPPβ levels (right bars) after normalization of their levels to the cell lysate total protein. Values denote means ± SEM (sAPPα n=7, sAPPβ n=5). e) Confocal analysis of cultured mouse cortical neurons infected with shCTRL or shVps34 lentiviruses and stained with an EEA1-specific antibody. Left panel, representative immunostainings. Scale bar= 10µm. Right panel, Bar diagram showing the average diameter of EEA1-positive endosomal fluorescent puncta. Values denote means ± SEM (n=82). ***, denotes P values < 0.001 from a Student's t-test.
Figure 3
Figure 3. Silencing of Vps34 alters the subcellular localization and processing of endogenous APP
a) Mouse hippocampal neurons were transfected with shCTRLGFP plasmid at DIV8 and cultured for 3 days before a 24 h treatment with vehicle (left panel) or γ-secretase inhibitor compound XXI at 10µM (right panel). Neurons were then fixed, stained for the indicated antibodies (anti-GM130, blue channel, anti-EEA1, green channel and anti-APP COOH-terminus (C-term) antibody, red channel) and imaged using confocal microscopy. Scale bar = 10 µm. Arrowheads indicate structures showing colocalization between APP and EEA1. b) Mouse hippocampal neurons were transfected with shVps34GFP and processed as described in (a). c) Bar diagram showing the amount of colocalization between APP and EEA1 per 2500 µm2 of image cell surface area following expression of shCTRLGFP (see a) or shVps34GFP (see b) in cultured neurons, in the presence or absence of γ-secretase inhibitor XXI. Results are shown as means ± SEM (n=30 cells). The asterisks denote P values < 0.001 from a Student's t-test. d) Bar diagram showing the amount of colocalization between APP and GM130 per 2500 µm2 of image cell surface area following expression of shCTRLGFP (see a) or shVps34GFP (see b) in cultured neurons, in the presence or absence of γ-secretase inhibitor XXI. Results are shown as means ± SEM (n=28 cells). The asterisks denote P values < 0.001 from a Student's t-test.
Figure 4
Figure 4. APP is sorted into the intraluminal vesicles of multivesicular endosomes
a) Confocal analysis of HeLa cells transfected with APPRFP (red) and the dominant-positive Rab5Q79LGFP mutant (green), which was used for its ability to generate giant endosomes. The cells were fixed and labeled with anti-EEA1 (blue) and anti-Vps35 (orange) antibodies. Scale bar = 10µm. b) Bar diagram showing a quantification of the localization of APPRFP inside the endosomal lumen (internal) vs. on the endosomal limiting membrane (peripheral), expressed as % of the total endosomal APPRFP. Values denote means ± SEM (n = 20 cells from 3 experiments with an average quantification of 15 endosomes per cell). ***, denotes P values < 0.001 from a Student's t-test. c) Confocal analysis of mouse hippocampal neurons transfected with Rab5Q79LGFP (green) at DIV9 and stained for endogenous APP (using the Cter antibody, red) and MAP2, a marker of the somatodendritic compartment (blue). Two insets are selected and presented in panels (d) and (e). Scale bar = 10 µm. d) First inset showing a magnification of the area containing enlarged endosomes presented in panel (c). e) Second inset showing a magnification of the area containing enlarged endosomes presented in panel (c). f) Bar diagram showing the quantification of the endosomal localization of endogenous APP in neurons, as in panel (b). g) Immunogold EM analysis of mouse hippocampal neurons at DIV15 in ultrathin cryosections double-labeled with antibodies to endogenous APP COOH-terminal domain (APP C-ter; PAG 15nm, arrowheads), located primarily on the intraluminal vesicles, and LAMP-1 (PAG 10nm). Scale bars = 250 nm. h) Western blot analysis of endogenous Vps34 and the loading marker actin in HeLa cells transfected with mock siRNA (mock) or siRNA against human Vps34 (siVps34) followed by transfection with APPRFP and Rab5Q79LGFP. i) Confocal analysis of HeLa cells transfected with mock siRNA (mock, top panel) or siVps34 (bottom panel) for 72h and then split, prior to transfection with APPRFP and Rab5Q79LGFP. Scale bar = 10µm.
Figure 5
Figure 5. The sorting of APP into intraluminal vesicles depends on ubiquitination
a) Mouse brain extracts were subjected to immunoprecipitation (IP) with an anti-APP-Cter antibody, or a control antibody (anti-GFP). Left panel: Western blot analysis of the starting lysates, the post-preclearing lysate (pre-IP), the lysate post-IP with anti-GFP, the control buffer post-IP with anti-APP-Cter, and the lysate post-IP with anti-APP-Cter. The immunoblot was performed with an anti-APP-Cter antibody. Right panel: Western blot analysis of the immunoprecipitated material shown in (a) using the anti-GFP antibody (IP anti-GFP), the control immunoprecipitation with anti-APP-Cter without brain lysate (IP anti-APP empty), and the anti APPCter antibody (IP anti-APP). The immunoblot was performed with an anti-ubiquitin antibody (top panel, ubi.), followed by stripping, and incubation with an anti-GFP antibody (bottom panel). IP: immunoprecipitated material; WB: Western blot. b) HeLa cells were transfected with APPGFP or a mock construct. Total lysates were subjected to an immunoprecipitation with an anti-GFP antibody. Samples were analyzed by SDS-page and Western blotting with an anti-ubiquitin antibody (bottom panel, ubi.), followed by stripping, and incubation with an anti-GFP antibody (top panel). IP: immunoprecipitated material; WB: Western blot. c) COOH-terminal sequence of human APP. The transmembrane domain is framed in blue, and Aβ peptide-cleavage sites are indicated with arrows. The juxtamembrane lysine residues at position 724–726 are depicted in green, and were substituted with 3 arginines in the APP3R mutant. d) HeLa cells were transfected with human APPGFP (APPWTGFP), the APP mutant (APP3RGFP), or not transfected (mock) and total lysates were prepared. After immunoprecipitation with an anti-GFP antibody, protein samples were analyzed by SDS-page and Western blotting with an anti-ubiquitin antibody (bottom panel) followed by stripping and incubation with an anti-GFP antibody (top panel). IP: immunoprecipitated material; WB: Western blot. e) Bar diagram showing the quantification of relative ubiquitin levels in APPWT and the APP3R mutant. (A.U.: arbitrary units). Values denote means ± SEM (n=3). **, denotes P values < 0.01 from a Student's t-test.
Figure 6
Figure 6. Blocking the intraluminal sorting of APP enhances its amyloidogenic processing
a) Confocal analysis of HeLa cells transfected with Rab5Q79Lmyc and APPWTGFP (top panel) or APP3RGFP (middle panel). Cells were labeled with an anti-myc antibody (red) and counterstained with DAPI (blue). Scale bar = 10µm. b) Bar diagram showing the quantification of the endosomal distribution of human APPGFP expressed as % of total endosomal APPGFP: internal = inside endosomal lumen, peripheral = limiting membrane of the endosomes. Values denote means ± SEM (for each construct, n = 18 cells from 3 experiments with an average quantification of 15 endosomes per cell). ***, denotes P values < 0.001 from a Student's t-test. c) Confocal analysis of mouse hippocampal neurons transfected at DIV9 with Rab5Q79LGFP and APPWTmCherry and fixed after a 24 h treatment with γ-secretase inhibitor XXI. Scale bar =10 µm. The inset shows APP-containing endosomes. d) Bar diagram showing the quantification of the endosomal distribution of human APPWTmCherry and APP3RmCherry in hippocampal neurons processed as described in (c). The APPmCherry distribution is expressed as % of total endosomal APPmCherry: internal = inside endosomal lumen, peripheral = limiting membrane of the endosomes. Values denote means ± SEM (n=45 and 18 cells for APPWTmCherry and APP3RmCherry, respectively from 3 experiments with an average quantification of 20 endosomes per cell). **, denotes P values < 0.01 from a Student's t-test.
Figure 7
Figure 7. Decreasing the ubiquitination of APP alters its subcellular localization in primary neurons
a, b) Mouse neurons were transfected with human APPwtGFP (in a) and APP3RGFP (in b) plasmids at DIV9. After 24h expression in the presence (right panels) or absence (left panels) of γ-secretase inhibitor compound XXI, neurons were fixed, stained for EEA1 (red channel) and imaged with confocal microscopy. Scale bar = 10 µm. Arrowheads indicate structures where APPGFP and EEA1 colocalize c) Bar diagram showing the amount of colocalization between GFP and EEA1 per 2500 µm2 of image cell surface area following expression of APPwtGFP and APP3RGFP in cultured neurons, in the presence or absence of γ-secretase inhibitor XXI. Results are shown as means ± SEM (APPwtGFP, n=30 and APP3RGFP, n=20). ***, denotes P values < 0.001 from a Student's t-test.
Figure 8
Figure 8. Expression of the APP-3R mutant leads to an increase in secreted Aβ
a and b) Mouse neurons were infected with lentiviruses expressing human APPWTGFP and APP3RGFP at DIV 7. At DIV 14, secreted APP metabolite sAPPα was analyzed by SDS-page and Western blot (in a and b), while secreted APP metabolite sAPPβ was measured by ELISA of culture media (in c). Synaptotagmin was used as an equal loading marker. The graphs show the quantification of full length APP normalized to synaptotagmin (in a) and the quantification of metabolites sAPPα (in b) and sAPPβ levels (in c) as a ratio of metabolite/full length APPGFP. Values denote means ± SEM (n=8). d and e) Bar diagram showing the quantification of human Aβ40 (in d) and Aβ42 (in e) peptide levels measured by ELISA in neuronal media after infection of neurons with lentiviruses expressing human APPWTGFP or APP3RGFP. Aβ levels were normalized to the cell lysate total protein and results are expressed as % of APPWTGFP. Values denote means ± SEM (n=13). **, denotes P values < 0.01 from a Student's t-test.

References

    1. Small SA, Gandy S. Sorting through the cell biology of Alzheimer's disease: intracellular pathways to pathogenesis. Neuron. 2006;52:15–31. - PMC - PubMed
    1. Haass C, Selkoe DJ. Soluble protein oligomers in neurodegeneration: lessons from the Alzheimer's amyloid beta-peptide. Nat Rev Mol Cell Biol. 2007;8:101–112. - PubMed
    1. Goate A, Hardy J. Twenty years of Alzheimer's disease-causing mutations. Journal of neurochemistry. 2012;120(Suppl 1):3–8. - PubMed
    1. Rajendran L, Annaert W. Membrane trafficking pathways in Alzheimer's disease. Traffic. 2012;13:759–770. - PubMed
    1. Nixon RA. Endosome function and dysfunction in Alzheimer's disease and other neurodegenerative diseases. Neurobiol Aging. 2005;26:373–382. - PubMed

Publication types

MeSH terms

Substances