. 2013 Sep;14(9):795-803.
doi: 10.1038/embor.2013.111. Epub 2013 Aug 2.

Autophagy in Myf5+ progenitors regulates energy and glucose homeostasis through control of brown fat and skeletal muscle development

Affiliations

Autophagy in Myf5+ progenitors regulates energy and glucose homeostasis through control of brown fat and skeletal muscle development

Nuria Martinez-Lopez et al. EMBO Rep. 2013 Sep.

Abstract

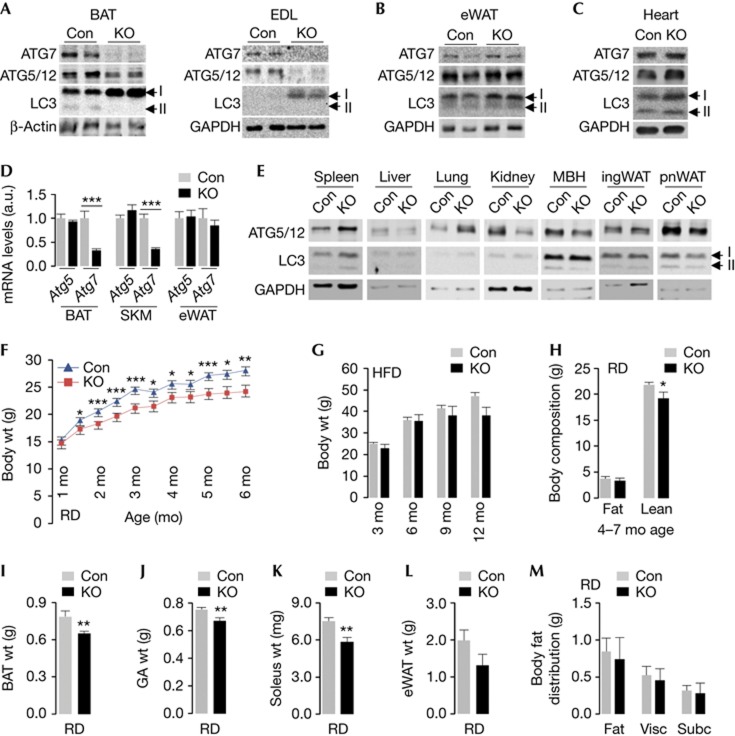
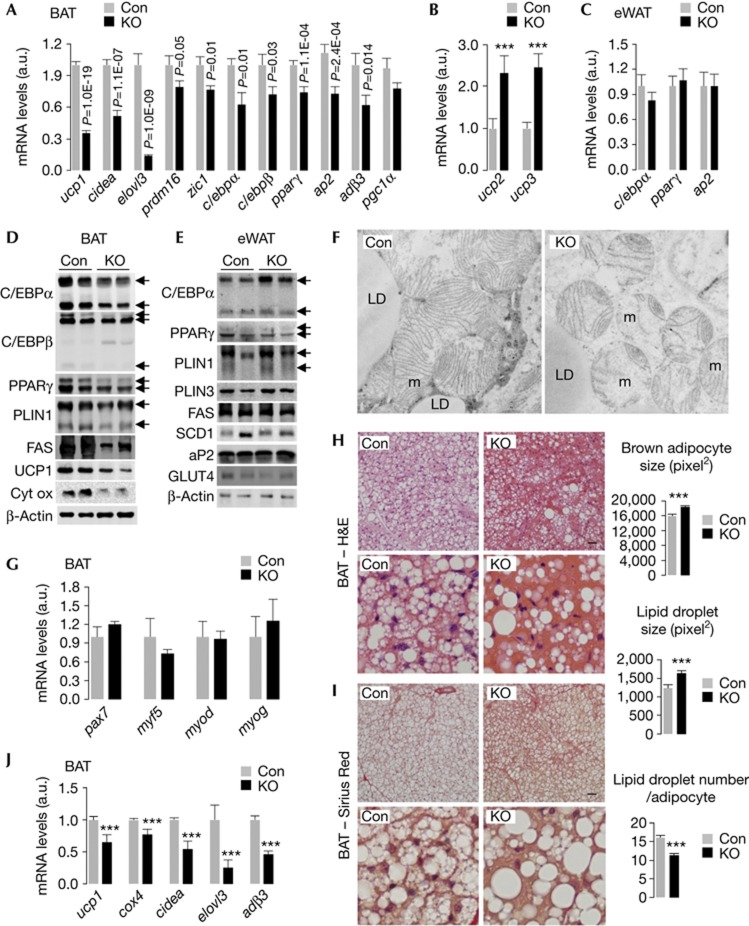
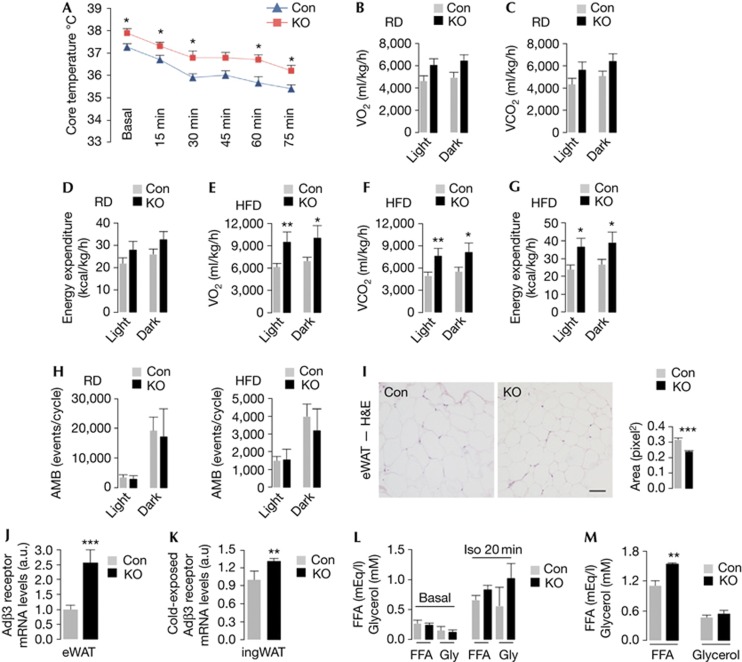
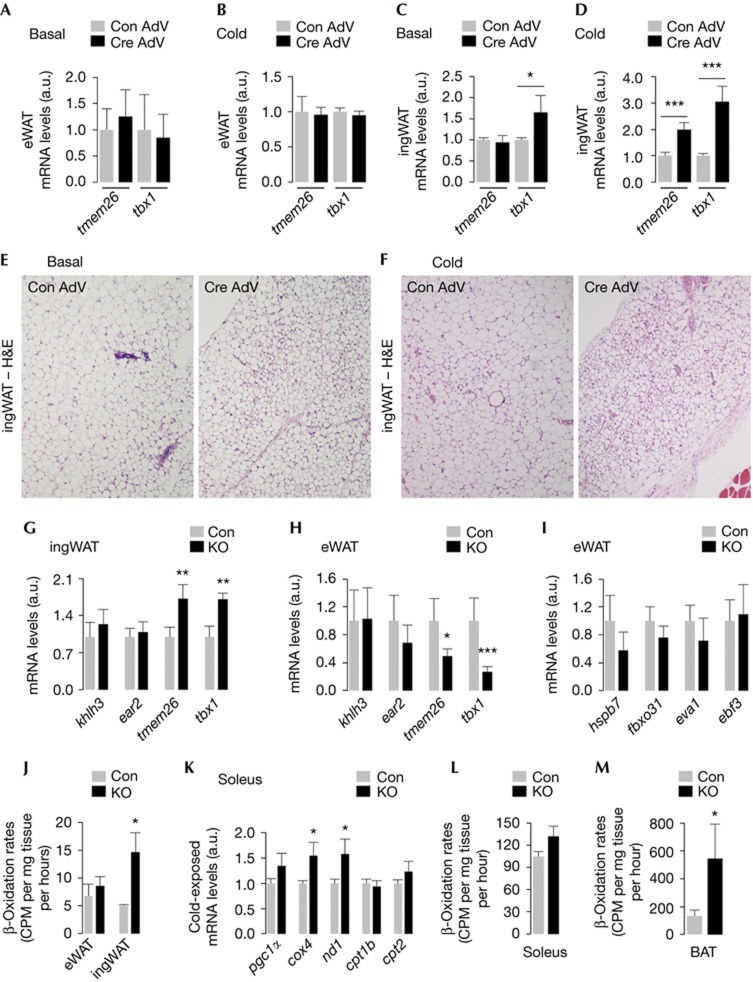
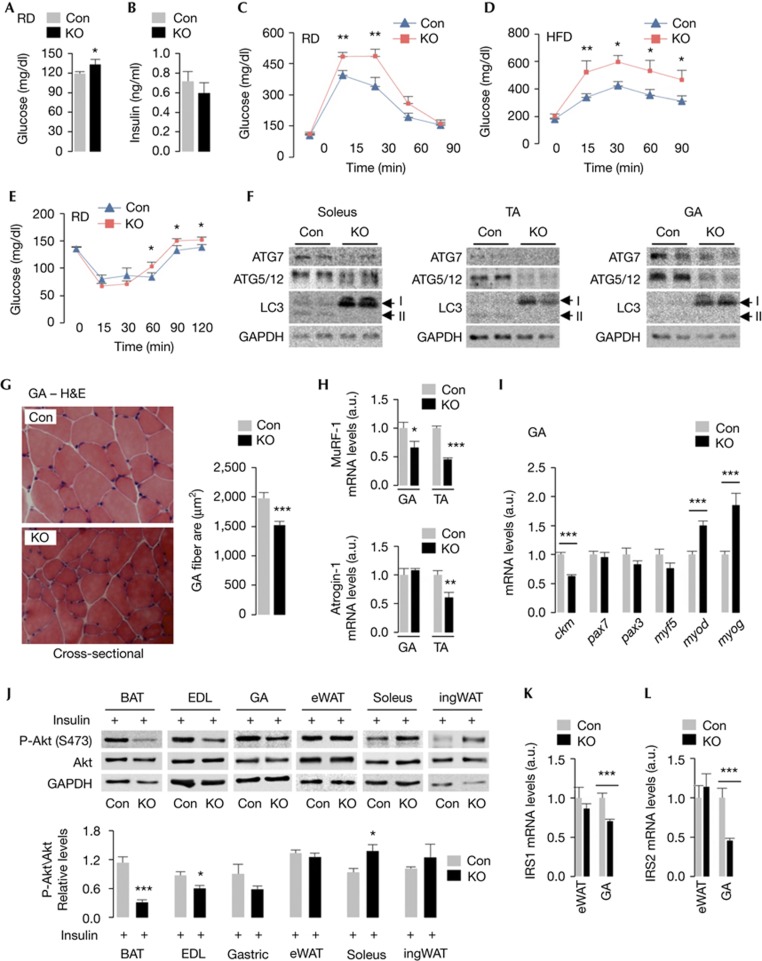
Macroautophagy (MA) regulates cellular quality control and energy balance. For example, loss of MA in aP2-positive adipocytes converts white adipose tissue (WAT) into brown adipose tissue (BAT)-like, enhancing BAT function and thereby insulin sensitivity. However, whether MA regulates early BAT development is unknown. We report that deleting Atg7 in myogenic Myf5+ progenitors inhibits MA in Myf5-cell-derived BAT and muscle. Knock out (KO) mice have defective BAT differentiation and function. Surprisingly, their body temperature is higher due to WAT lipolysis-driven increases in fatty acid oxidation in 'Beige' cells in inguinal WAT, BAT and muscle. KO mice also present impaired muscle differentiation, reduced muscle mass and glucose intolerance. Our studies show that ATG7 in Myf5+ progenitors is required to maintain energy and glucose homeostasis through effects on BAT and muscle development. Decreased MA in myogenic progenitors with age and/or overnutrition might contribute to the metabolic defects and sarcopenia observed in these conditions.


Conflict of interest statement

The authors declare that they have no conflict of interest.

Figures

Figure 1
Figure 1
Deleting Atg7 in Myf5+ progenitors disrupts macroautophagy (MA) in brown adipose tissue (BAT) and skeletal muscle (SKM). (AC) Immunoblots for indicated proteins in BAT, extensor digitorum longus (EDL), epididymal white adipose tissue (eWAT) and heart from 10- to 12-month (mo)-old control (Con) and knock out (KO) mice. Arrows depict LC3-I and II. (D) ATG5 and ATG7 mRNA levels in indicated tissues (n=4), and (E) immunoblots for indicated proteins in spleen, liver, lung, kidney, mediobasal hypothalamus (MBH), inguinal white adipose tissue (ingWAT) and perinephric fat (pnWAT) from 10- to 12-mo-old Con and KO mice. (F) Body weights (wt) of chow diet (RD)-fed (n=6–29), and (G) high-fat diet (HFD)-fed Con and KO mice at indicated ages (n=4–17). (H) Total body fat and lean mass of 4–7 mo RD-fed Con and KO mice (n=8–12). (I) BAT wt (n=4–7), (J) gastrocnemius (GA) wt (n=5–7), (K) soleus wt (n=4–7), (L) eWAT wt (n=5–7) and (M) visceral (Visc) and subcutaneous (Subc) body fat distribution in 10-mo-old Con and KO mice (n=4). Values are mean±s.e., *P<0.05, **P<0.01, ***P<0.001.
Figure 2
Figure 2
Loss of Atg7 in Myf5+ progenitors impairs brown adipose tissue (BAT) differentiation. (A,B) mRNA for indicated genes in BAT (n=4) and (C) epididymal white adipose tissue (eWAT) (n=4), and (D) immunoblots for indicated proteins in BAT and (E) eWAT from 10-month (mo)-old chow diet (RD)-fed control (Con) and knock out (KO) mice. Arrows depict protein isoforms. (F) Electron micrographs ( × 10,000 magnification) of BAT depicting mitochondria from 4-mo-old Con and KO mice. m, mitochondria; LD, lipid droplet; n, nucleus. (G) mRNA levels (n=4) and (H) hematoxylin and eosin (H&E) and (I) Sirius Red stains in BAT from 10-mo-old Con and KO mice (n=3–4). Average adipocyte and LD size, and LD number in BAT are shown. Scale bar, 50 μm. (J) BAT mRNA levels from 4-mo-old RD-fed Con and KO mice cold-challenged for 75 min (n=3). Values are mean±s.e. ***P<0.001.
Figure 3
Figure 3
Loss of Atg7 in Myf5+ progenitors increases energy expenditure. (A) Body temperature before (Basal) and during cold exposure (n=7–8). (B) Oxygen consumption (VO2), (C) carbon dioxide production (VCO2) and (D) energy expenditure in 10-month (mo)-old chow diet (RD)-fed control (Con) and knock out (KO) mice (n=4). (E) VO2, (F) VCO2 and (G) energy expenditure in 10-mo-old high-fat diet (HFD)-fed Con and KO mice (n=3–5). (H) Ambulation (AMB) in 10-mo-old RD-fed (n=4) and HFD-fed Con and KO mice (n=3–5). (I) Hematoxylin and eosin (H&E)-stained epididymal white adipose tissue (eWAT) from 6-mo-old RD-fed Con and KO mice. Quantification for cell size is shown (n=3). Scale bar, 50 μm. (J) Adβ3 mRNA in eWAT from 10-mo-old RD-fed Con and KO mice (n=4), and in (K) inguinal (ingWAT) from 4-mo-old cold-challenged RD-fed Con and KO mice (n=3). (L) Serum-free fatty acid (FFA) and glycerol (Gly) from 4- to 6-mo-old Con and KO mice untreated (basal) or treated with isoproterenol (Iso) i.p. for 20 min (n=4–6), and (M) from 4-mo-old RD-fed cold-challenged (75 min) mice (n=3–4). Values are mean±s.e. *P<0.05, **P<0.01, ***P<0.001.
Figure 4
Figure 4
Beige cells in inguinal white adipose tissue (ingWAT) and brown adipose tissue (BAT) contribute to increased energy expenditure in knock out (KO) mice. (A,B) Tmem26 and tbx1 mRNA levels in epididymal eWAT, and (C,D) ingWAT, and (E,F) hematoxylin and eosin (H&E)-stained ingWAT section from Atg7Flox/Flox mice (4 months (mo)) injected in BAT with empty (Con AdV) or Cre-expressing (Cre AdV) adenoviruses and cold-exposed or not (basal) for 75 min (n=4–5). (G) mRNA for indicated genes in ingWAT from 4-mo-old cold-exposed Con and KO mice (n=4). (H,I) mRNA levels in eWAT from 10-mo-old Con and KO mice (n=4). (J) β-oxidation in eWAT and ingWAT from 4-mo-old Con and KO mice (n=4). (K) mRNA levels in soleus from 4-mo-old cold-exposed Con and KO mice (n=3–6). (L) β-oxidation in soleus and (M) BAT from 4-mo-old Con and KO mice (n=4). Values are mean±s.e. *P<0.05, **P<0.01, ***P<0.001.
Figure 5
Figure 5
Knock out (KO) mice show reduced myofiber size and impaired glucose clearance. (A) Blood glucose in 6- to 10-month (mo)-old mice (n=12–15), and (B) serum insulin levels in 10-mo-old fed control (Con) and KO mice (n=6). (C) Glucose tolerance tests in 10-mo-old chow diet (RD)-fed (n=5), and (D) in 10- to 12-mo-old high-fat diet (HFD)-fed Con and KO mice (n=4–9). (E) Insulin tolerance test in 10-mo-old RD-fed Con and KO mice (n=5). (F) Immunoblots for indicated proteins in skeletal muscle from 10-mo-old Con and KO mice. (G) Hematoxylin and eosin (H&E)-stained gastrocnemius (GA) sections from 6-mo-old Con and KO mice. Myofiber cross-sectional area (μm2) is shown (n=3). (H) Expression of MuRF-1 and Atrogin-1 in GA and TA (n=4) and (I) myogenic genes in GA from 10-mo-old Con and KO mice (n=6). (J) Immunoblots for indicated proteins in tissues from 4-mo-old Con and KO mice (n=4). (K) mRNA for IRS1, (L) IRS2 in epididymal white adipose tissue (eWAT) and GA from 10-mo-old Con and KO mice (n=6). Values are mean±s.e. *P<0.05, **P<0.01, ***P<0.001.

References

    1. McCullough AJ (2011) Epidemiology of the metabolic syndrome in the USA. J Dig Dis 12: 333–340 - PubMed
    1. Bouzakri K, Koistinen HA, Zierath JR (2005) Molecular mechanisms of skeletal muscle insulin resistance in type 2 diabetes. Curr Diabetes Rev 1: 167–174 - PubMed
    1. Seale P et al. (2008) PRDM16 controls a brown fat/skeletal muscle switch. Nature 454: 961–967 - PMC - PubMed
    1. Stanford KI et al. (2013) Brown adipose tissue regulates glucose homeostasis and insulin sensitivity. J Clin Invest 123: 215–223 - PMC - PubMed
    1. Singh R, Cuervo AM (2011) Autophagy in the cellular energetic balance. Cell Metab 13: 495–504 - PMC - PubMed

Publication types

MeSH terms

LinkOut - more resources