Randomized Controlled Trial
. 2014 May;35(5):1944-56.
doi: 10.1002/hbm.22304. Epub 2013 Aug 1.

Intranasal insulin increases regional cerebral blood flow in the insular cortex in men independently of cortisol manipulation

Affiliations
Randomized Controlled Trial

Intranasal insulin increases regional cerebral blood flow in the insular cortex in men independently of cortisol manipulation

Thomas M Schilling et al. Hum Brain Mapp. 2014 May.

Abstract

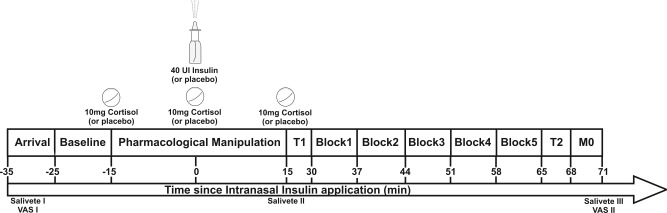
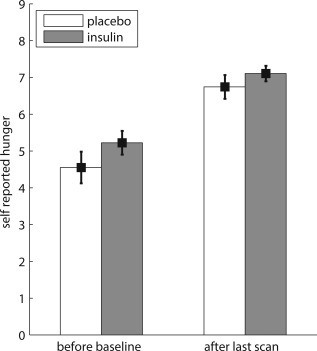
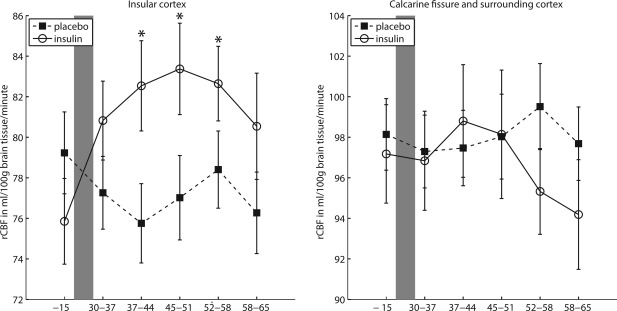
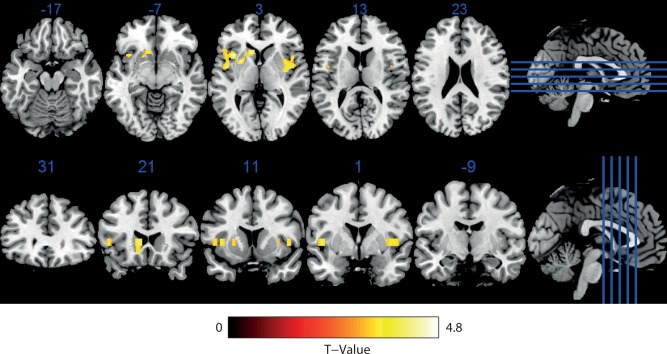
Insulin and cortisol play a key role in the regulation of energy homeostasis, appetite, and satiety. Little is known about the action and interaction of both hormones in brain structures controlling food intake and the processing of neurovisceral signals from the gastrointestinal tract. In this study, we assessed the impact of single and combined application of insulin and cortisol on resting regional cerebral blood flow (rCBF) in the insular cortex. After standardized periods of food restriction, 48 male volunteers were randomly assigned to receive either 40 IU intranasal insulin, 30 mg oral cortisol, both, or neither (placebo). Continuous arterial spin labeling (CASL) sequences were acquired before and after pharmacological treatment. We observed a bilateral, locally distinct rCBF increase after insulin administration in the insular cortex and the putamen. Insulin effects on rCBF were present regardless of whether participants had received cortisol or not. Our results indicate that insulin, but not cortisol, affects blood flow in human brain structures involved in the regulation of eating behavior.

Keywords: basal ganglia; cerebral cortex; glucocorticoids; hippocampus; metabolism; pancreatic hormones.


Figures

Figure 1
Figure 1
Flowchart of the experiment. After arrival participants entered the scanner for scan 1 (baseline). The pharmacological treatment was given out of the scanner. The second scan started by recording an anatomical T1‐scan before five functional‐blocks, an anatomical T2‐scan and a M0‐scan were recorded. Salivary cortisol was assessed three times during the experiment (“Salivette”), mood, and hunger ratings were assessed two times via a visual‐analog‐scale (“VAS”). Also, blood sugar levels were taken at the end of the experiment.
Figure 2
Figure 2
Values of self‐reported hunger of participants receiving insulin (N = 22) compared with participants receiving placebo (N = 24) before baseline and after the last scan. Data present mean and standard error of the mean.
Figure 3
Figure 3
Regional cerebral blood flow (rCBF) over time for participants receiving insulin (N = 22) versus participants receiving placebo (N = 24); left panel: in the insular cortex; right panel in the calcarine fissure and surrounding cortex. X‐axis values are in minutes relative to the application of the intranasal insulin versus placebo. Grey‐shaded area indicates pharmacological treatment. Data present mean and standard error of the mean. Post‐intervention measurement‐blocks which differ significantly from their corresponding baseline are marked with an “*” (according to Dunn's multiple comparison test, ψ5% = 5.00 ml/100 g brain tissue/minute, C = 20).
Figure 4
Figure 4
Baseline corrected CBF‐increases in participants receiving intranasal insulin compared with participants receiving placebo in all five post‐intervention measurement‐blocks, corresponding to a time interval of 30 to 65 min after the pharmacological manipulation. No CBF‐decreases were observed. Functional image overlaid on the Ch2bet template implemented in MRIcron and then multislized in the axial and coronar plane. Statistical parametric mapping of the normalized contrast vector of the interaction “insulin” × “measurement‐block” contrasting the post‐intervention measurement‐blocks 1 to 5 with the baseline block and participants receiving insulin with participants receiving placebo (full‐factorial 4(“group”) × 6(“measurement‐block”) model), peak level P < 0.001 (uncorrected), cluster level P < 0.05 (FWE‐corrected), no covariates). See also Table 1 for more information on cluster significance values and peak Z‐scores. [Color figure can be viewed in the online issue, which is available at http://wileyonlinelibrary.com.]

References

    1. Adam TC, Epel ES (2007): Stress, eating and the reward system. Physiol Behav 91:449–458. - PubMed
    1. Alsop DC, Detre JA (1996): Reduced transit‐time sensitivity in noninvasive magnetic resonance imaging of human cerebral blood flow. J Cereb Blood Flow Metab 16:1236–1249. - PubMed
    1. Alsop DC, Detre JA (1998): Multisection cerebral blood flow MR imaging with continuous arterial spin labeling. Radiology 208:410–416. - PubMed
    1. Attwell D, Iadecola C (2002): The neural basis of functional brain imaging signals. Trends Neurosci 25:621–625. - PubMed
    1. Baron AD, Steinberg HO, Chaker H, Leaming R, Johnson A, Brechtel G (1995): Insulin‐mediated skeletal muscle vasodilation contributes to both insulin sensitivity and responsiveness in lean humans. J Clin Invest 96:786–792. - PMC - PubMed

Publication types

MeSH terms