Randomized Controlled Trial
. 2014 May;35(5):2099-118.
doi: 10.1002/hbm.22314. Epub 2013 Aug 1.

Reversing pathologically increased EEG power by acoustic coordinated reset neuromodulation

Affiliations
Randomized Controlled Trial

Reversing pathologically increased EEG power by acoustic coordinated reset neuromodulation

Ilya Adamchic et al. Hum Brain Mapp. 2014 May.

Abstract

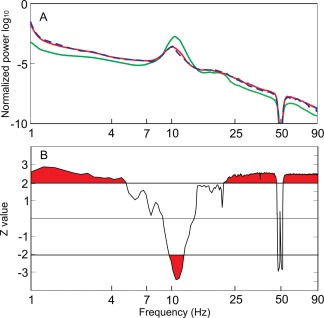
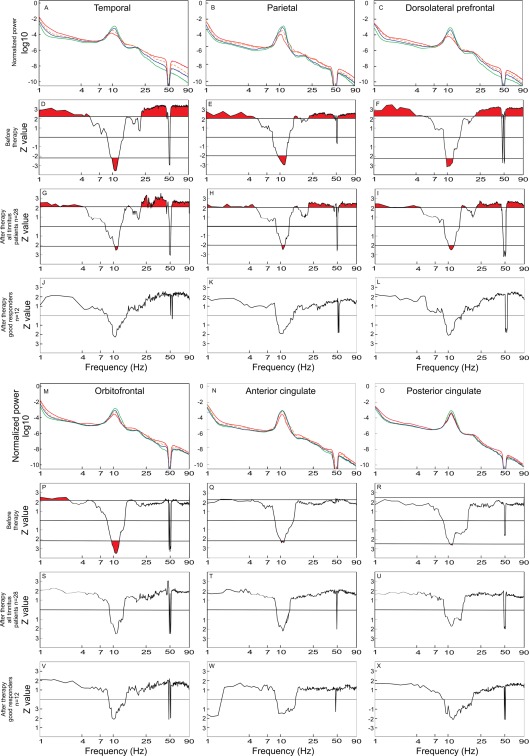
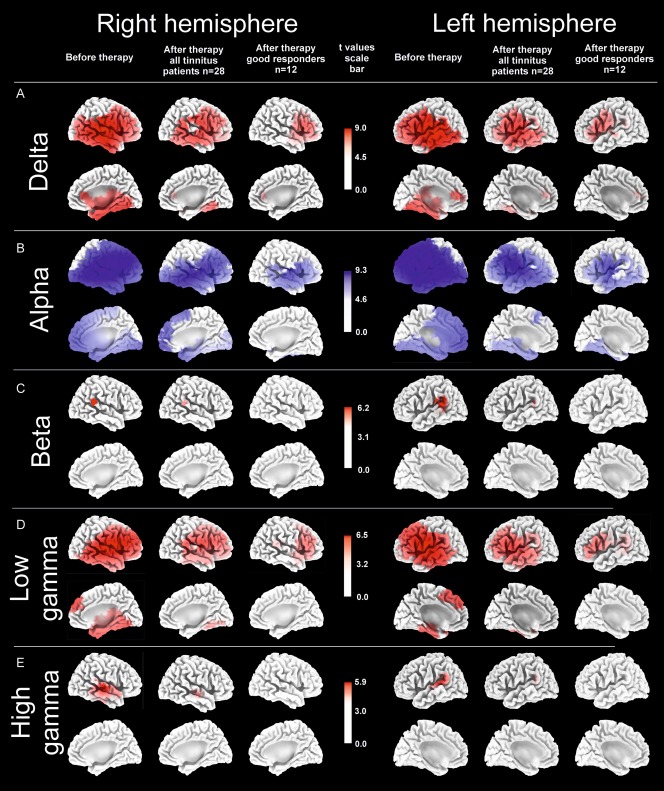
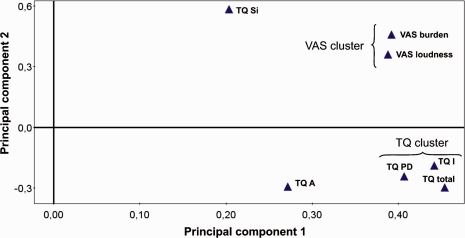
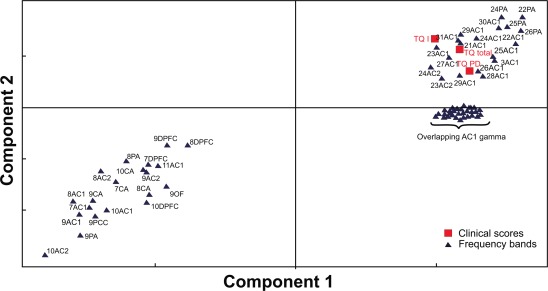
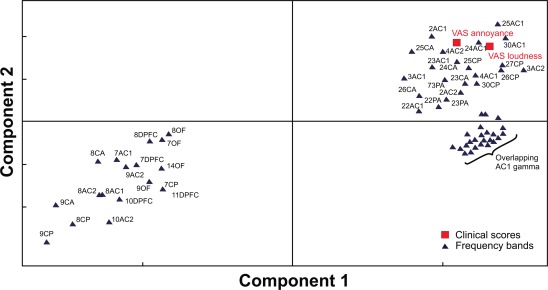
Acoustic Coordinated Reset (CR) neuromodulation is a patterned stimulation with tones adjusted to the patient's dominant tinnitus frequency, which aims at desynchronizing pathological neuronal synchronization. In a recent proof-of-concept study, CR therapy, delivered 4-6 h/day more than 12 weeks, induced a significant clinical improvement along with a significant long-lasting decrease of pathological oscillatory power in the low frequency as well as γ band and an increase of the α power in a network of tinnitus-related brain areas. As yet, it remains unclear whether CR shifts the brain activity toward physiological levels or whether it induces clinically beneficial, but nonetheless abnormal electroencephalographic (EEG) patterns, for example excessively decreased δ and/or γ. Here, we compared the patients' spontaneous EEG data at baseline as well as after 12 weeks of CR therapy with the spontaneous EEG of healthy controls by means of Brain Electrical Source Analysis source montage and standardized low-resolution brain electromagnetic tomography techniques. The relationship between changes in EEG power and clinical scores was investigated using a partial least squares approach. In this way, we show that acoustic CR neuromodulation leads to a normalization of the oscillatory power in the tinnitus-related network of brain areas, most prominently in temporal regions. A positive association was found between the changes in tinnitus severity and the normalization of δ and γ power in the temporal, parietal, and cingulate cortical regions. Our findings demonstrate a widespread CR-induced normalization of EEG power, significantly associated with a reduction of tinnitus severity.

Keywords: desynchronization; electroencephalography; non-invasive neuromodulation; phantom perception; tinnitus treatment.


Conflict of interest statement

I. Adamchic and T. Toth have no conflict of interest in relation to this study. C. Hauptmann and P. A. Tass have a contractual relationship with ANM Adaptive Neuromodulation GmbH. P. A. Tass holds shares of ANM Adaptive Neuromodulation GmbH.

Figures

Figure 1
Figure 1
Enhanced δ and γ EEG power in tinnitus patients. A: In the global EEG power spectrum, δ and γ power were increased and α power was decreased in tinnitus patients recorded before CR neuromodulation (n = 28, red line) as compared to the healthy controls (n = 16, green line). In contrast, the global EEG power spectrum of the group of good responders (n = 12, blue dashed line) did not differ from that of the group of all patients with bilateral tinnitus before CR therapy. B: Areas indicated with red (i.e., above or below the horizontal line) correspond to statistically significant differences between all bilateral tinnitus patients (n = 28) and the healthy controls. Significant differences were found in δ, low θ, α, high β, low and high γ bands.
Figure 2
Figure 2
Power spectra for the group of healthy controls (n = 16) (green line), the group of all bilateral tinnitus patients (n = 28) before therapy (red line), the group of all bilateral tinnitus patients (n = 28) after therapy (orange dashed line), and the subgroup of good responders (n = 12) (blue line) in the temporal (A), PA (B) and DPFC (C), OF (M), anterior cingulated (N), and posterior cingulated (O) ROIs. The power spectra of all 28 bilateral tinnitus patients before therapy were compared to those of the healthy controls (n = 16) by means of the Mann–Whitney U‐test in the temporal (D), PA (E) and DPFC (F), OF (P), anterior cingulated (Q), and posterior cingulated (R) ROIs for each frequency point. In the same manner, the power spectra of all 28 bilateral patients after therapy were compared to the spectra of the healthy controls (n = 16) (G, H, I, S, T, U). The analogous comparison was also performed between the good responders (n = 12) and the healthy controls (n = 16) (J, K, L, V, W, X) in the temporal, PA, DPFC, OF, anterior cingulated, and posterior cingulated ROIs, respectively. Areas indicated with red (i.e., above or below the horizontal line) correspond to statistically significant differences. In plots with neither red areas nor horizontal significance lines, no frequency point attained significance threshold. There is a noticeable trend toward a reduced α peak frequency in the tinnitus population. Supporting Information Figure S1 shows topographical plots of EEG power differences in the specific frequency bands.
Figure 3
Figure 3
sLORETA functional tomographic maps of the significant differences in the power of regional electric brain activity between all 28 bilateral tinnitus patients before therapy and healthy controls (“Before therapy”), between all 28 bilateral tinnitus patients after 12 weeks of therapy and healthy controls (“After therapy all tinnitus patients n = 28”) and between 12 good responders after 12 weeks of therapy and healthy controls (“After therapy good responders n = 12”) in five EEG frequency bands δ (1–3.5 Hz), α (8–12 Hz), β (12.5–30 Hz), low γ (30.5–48 Hz), and high γ (52–90 Hz). In the θ band (4–7.5 Hz) no significant differences were found between tinnitus patients and healthy controls, neither before nor after CR therapy. Voxels of significantly decreased power (P = 0.05) in tinnitus patients as compared to healthy controls are labeled in blue, whereas voxels with significantly increased power (P = 0.05) are labeled in red. After 12 weeks of acoustic CR neuromodulation, there was a pronounced decrease of number of voxels with power that was significantly different from the healthy controls: In the δ, β as well as low and high γ band initially pathologically enhanced power decreased, whereas in the α band the initially reduced power reincreased.
Figure 4
Figure 4
Loading plot showing the grouping of the clinical scores. Items grouped together responded in a similar way to the therapy, and their proximity reflects the strength of the similarity of their responses. The separation of TQ and VAS scores in distinct clusters suggests that they responded differently to the therapy. TQ subscores: TQ PD (psychological distress), TQ I (intrusiveness), TQ A (auditory perceptual difficulties), and TQ Si (sleep disturbances).
Figure 5
Figure 5
Loading plot showing the changes of TQ scores and spectral power bands for the first and second PLS component. The loading plot shows the 70 1‐Hz wide power bins and the TQ PD and TQ I subscores together with the TQ total scores. The proximity of the changes in spectral power values and the TQ (sub‐)scores reflects the strength of the association of these changes to the changes in the clinical scores. The 1‐Hz‐wide frequency bands were labeled by abbreviations consisting of the lower edge of the frequency band followed by the ROI (for abbreviations, see METHODS section). ROI abbreviations: primary auditory cortex (AC1), secondary auditory cortex (AC2), orbito‐frontal (OF), dorsolateral‐prefrontal (DPFC), parietal (PA), anterior cingulate cortex (CA) and posterior cingulated cortex (CP).
Figure 6
Figure 6
Loading plot showing the 67 1‐Hz wide power bands and VAS loudness and VAS annoyance scores. Proximity of the changes in the power values across different frequency bands to the changes in VAS reflects the strength of association of these neuronal changes to the changes in the clinical scores. For ROI abbreviations, see METHODS section and Figure 5.

References

    1. Adamchic I, Langguth B, Hauptmann C, Tass PA (2012a): Psychometric evaluation of Visual Analog Scale for the assessment of chronic tinnitus. Am J Audiol 21:215--225. - PubMed
    1. Adamchic I, Tass PA, Langguth B, Hauptmann C, Koller M, Schecklmann M, Zeman F, Landgrebe M (2012b): Linking the Tinnitus Questionnaire and the subjective Clinical Global Impression: Which differences are clinically important? Health Qual Life Outcomes 10:79. - PMC - PubMed
    1. Adjamian P, Sereda M, Zobay O, Hall DA, Palmer AR (2012): Neuromagnetic indicators of tinnitus and tinnitus masking in patients with and without hearing loss. J Assoc Res Otolaryngol 13:715–731. - PMC - PubMed
    1. Benjamini Y, Hochberg Y (1995): Controlling the False Discovery Rate: A practical and powerful approach to multiple testing. J R Stat Soc Ser B 57:289–300.
    1. Benoit O, Daurat A, Prado J (2000): Slow (0.7–2 Hz) and fast (2–4 Hz) delta components are differently correlated to theta, alpha and beta frequency bands during NREM sleep. Clin Neurophysiol 111:2103–2106. - PubMed

Publication types