. 2013 Sep;23(9):1363-72.
doi: 10.1101/gr.154187.112. Epub 2013 Aug 1.

DNA methylation contributes to natural human variation

Affiliations

DNA methylation contributes to natural human variation

Holger Heyn et al. Genome Res. 2013 Sep.

Abstract

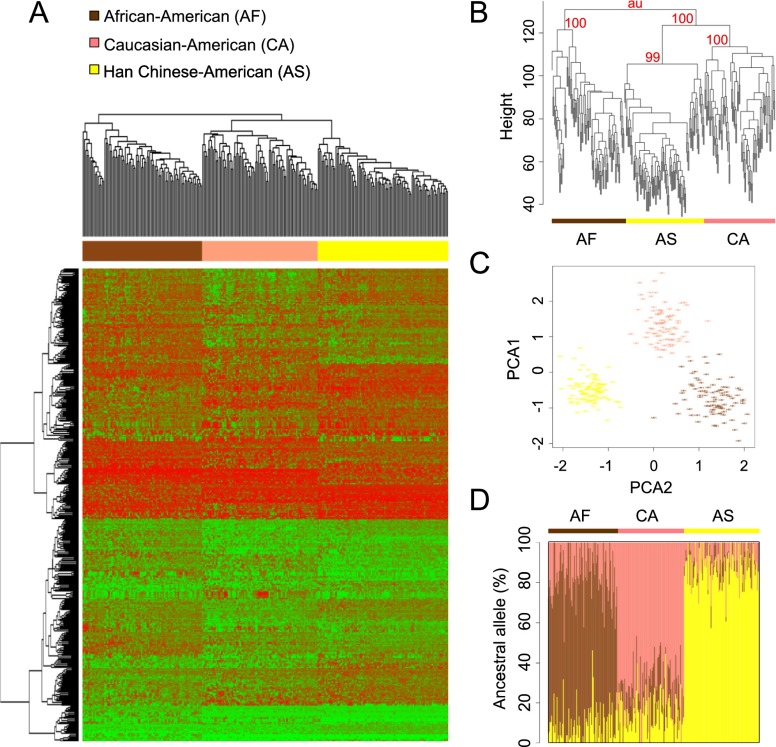
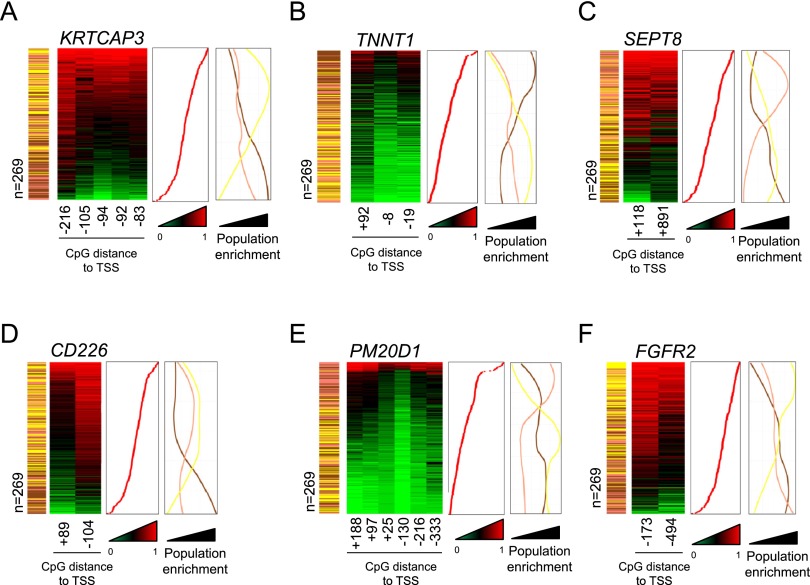
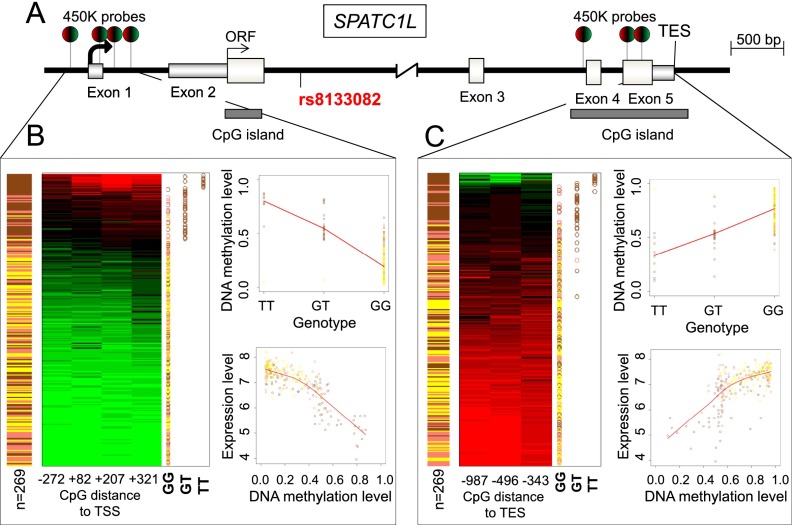
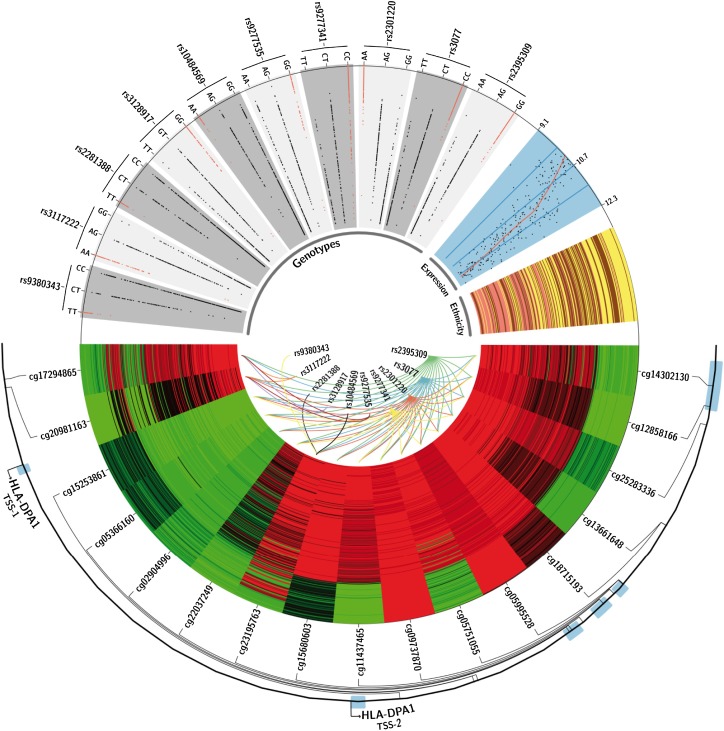
DNA methylation patterns are important for establishing cell, tissue, and organism phenotypes, but little is known about their contribution to natural human variation. To determine their contribution to variability, we have generated genome-scale DNA methylation profiles of three human populations (Caucasian-American, African-American, and Han Chinese-American) and examined the differentially methylated CpG sites. The distinctly methylated genes identified suggest an influence of DNA methylation on phenotype differences, such as susceptibility to certain diseases and pathogens, and response to drugs and environmental agents. DNA methylation differences can be partially traced back to genetic variation, suggesting that differentially methylated CpG sites serve as evolutionarily established mediators between the genetic code and phenotypic variability. Notably, one-third of the DNA methylation differences were not associated with any genetic variation, suggesting that variation in population-specific sites takes place at the genetic and epigenetic levels, highlighting the contribution of epigenetic modification to natural human variation.


Figures

Figure 1.
Figure 1.
DNA methylation separates African-American (AF, brown), Caucasian-American (CA, pink), and Han Chinese-American (AS, yellow) individuals. (A) Hierarchical clustering of 439 pop-CpG sites separating the three populations using absolute DNA methylation levels (low: green; high: red). (B) Multiscale bootstrap resampling (n = 10,000) of the 439 pop-CpG sites significantly differentially methylated between African, Asian, and Caucasian individuals. The three populations cluster separately and consistently with prior genetically defined proximities (approximately unbiased P-value > 0.99). (C) Principal component analysis (PCA) of pop-CpGs displaying the first two principal components. (D) ADMIXTURE analysis of pop-CpGs-defined ancestral DNA methylation status. Each individual is represented by a vertical line, with the lengths corresponding to the ancestry coefficients in up to three inferred ancestral groups.
Figure 2.
Figure 2.
Differentially methylated gene promoters of KRTCAP3 (A), TNNT1 (B), SEPT8 (C), CD226 (D), PM20D1 (E), and FGFR2 (F) in Han Chinese-American (yellow), Caucasian-American (pink), and African-American (brown) individuals. Absolute DNA methylation levels at population-specific CpG sites in gene promoters (low: green; high: red) are displayed for single individuals (n = 269). The distance to the gene transcription start site is indicated. The samples are ranked according to their average DNA methylation levels (middle panel) at displayed pop-CpGs. Population enrichment (right panel) is illustrated using absolute sample numbers in a 10-sample window.
Figure 3.
Figure 3.
Genotype and DNA methylation regulate gene expression of SPATC1L in a conjoined manner and inversely correlate at the transcription start (TSS) and end site (TES). (A) Schematic overview of the gene structure of SPATC1L. (B) AF individuals have high levels of promoter DNA methylation, a TT phenotype enriched in rs8133082, and reduced expression of SPATC1L. The figure displays the absolute DNA methylation levels (low: green; high: red) for four promoter-related pop-CpGs of African-American (brown), Caucasian-American (pink), and Han Chinese-American (yellow) individuals; the genotype of rs8133082 for the individual samples (GG, GT, TT); the correlation between DNA methylation (cg08742575) and the genotype (rs8133082); and the gene expression level (SPATC1L). Samples are ranked by mean CpG methylation values. (C) Unlike the promoter, AF individuals have CpG hypomethylation, which is positively correlated with SPATC1L gene expression (cg11766577).
Figure 4.
Figure 4.
Genetic polymorphisms related to HBV infection influence DNA methylation and gene expression at the HLA-DPA1 locus. Using Circos (Krzywinski et al. 2009), the figure shows a schematic overview of the HLA-DPA1 locus and DNA methylation, genotype and expression data from African-American (brown), Caucasian-American (pink), and Han Chinese-American (yellow) individuals: DNA methylation levels (low: green; high: red) of CpG sites (n = 17) significantly correlated with the genotype of HBV infection-associated SNPs (n = 10) (Kamatani et al. 2009). Samples are ranked by mean CpG methylation values. SNP-CpG relations are displayed by colored lines. The genotype distribution of SNPs in the HLA-DPA1 locus is shown, which is significantly correlated with the level of CpG methylation (gray boxes; risk alleles are highlighted in red) (Kamatani et al. 2009). The distribution of expression levels of HLA-DPA1 is shown in the blue box.

References

    1. The 1000 Genomes Project Consortium 2010. A map of human genome variation from population-scale sequencing. Nature 467: 1061–1073 - PMC - PubMed
    1. Alexander DH, Novembre J, Lange K 2009. Fast model-based estimation of ancestry in unrelated individuals. Genome Res 19: 1655–1664 - PMC - PubMed
    1. Alisch RS, Barwick BG, Chopra P, Myrick LK, Satten GA, Conneely KN, Warren ST 2012. Age-associated DNA methylation in pediatric populations. Genome Res 22: 623–632 - PMC - PubMed
    1. Anway MD, Cupp AS, Uzumcu M, Skinner MK 2005. Epigenetic transgenerational actions of endocrine disruptors and male fertility. Science 308: 1466–1469 - PMC - PubMed
    1. Bauer S, Robinson PN, Gagneur J 2011. Model-based gene set analysis for Bioconductor. Bioinformatics 27: 1882–1883 - PMC - PubMed

Publication types