. 2014 Oct 7;9(10):1781-9.
doi: 10.2215/CJN.08750812. Epub 2013 Aug 1.

Urine-concentrating mechanism in the inner medulla: function of the thin limbs of the loops of Henle

Affiliations

Urine-concentrating mechanism in the inner medulla: function of the thin limbs of the loops of Henle

William H Dantzler et al. Clin J Am Soc Nephrol. .

Abstract

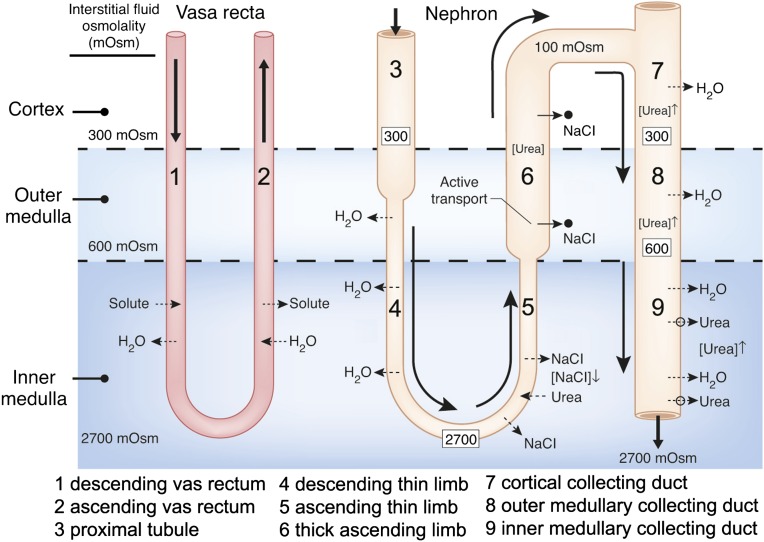
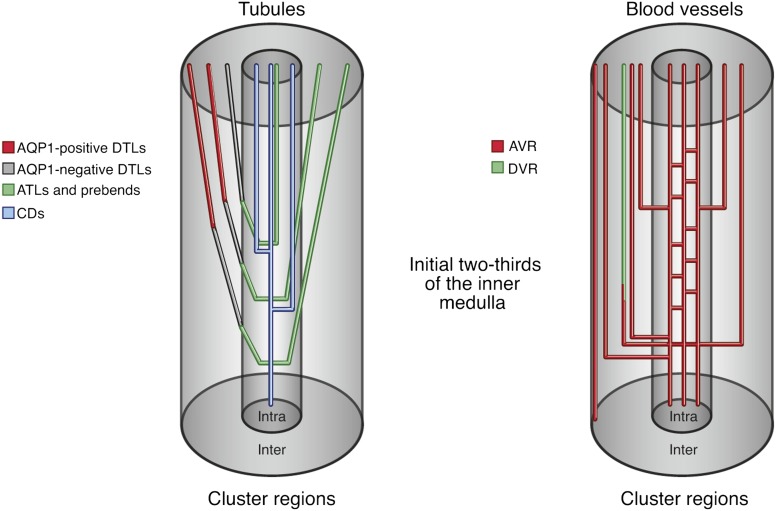
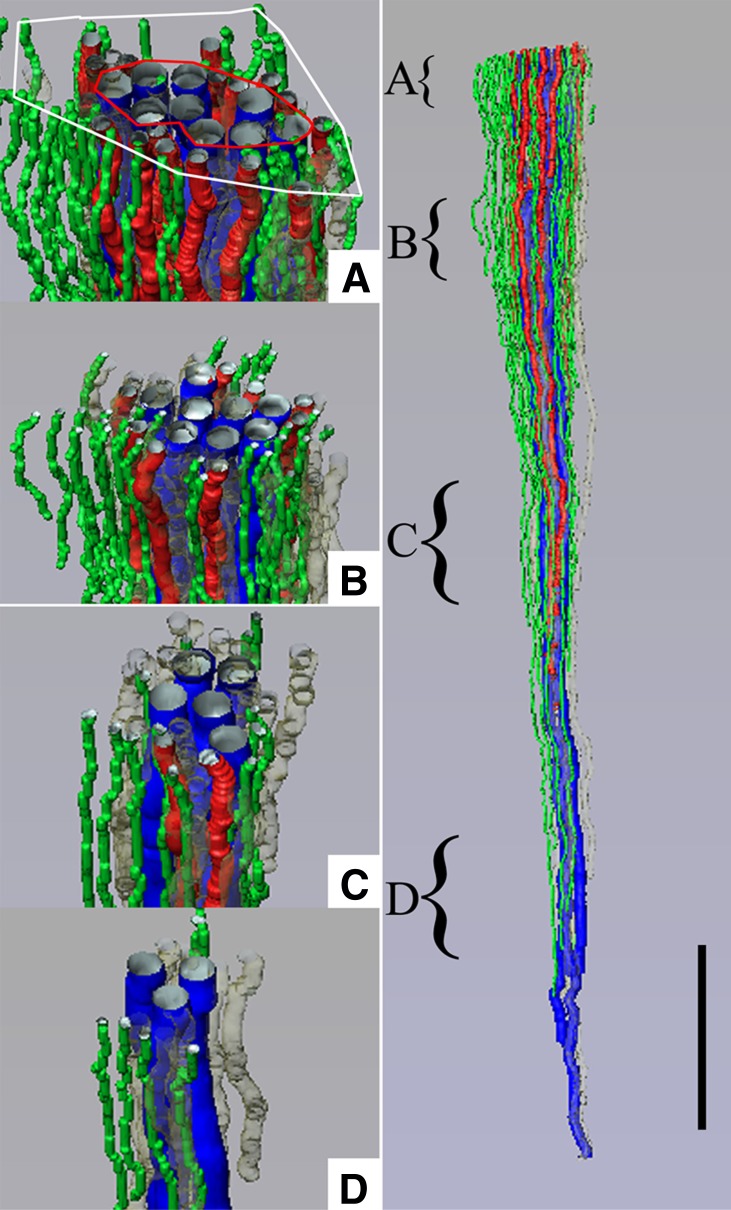
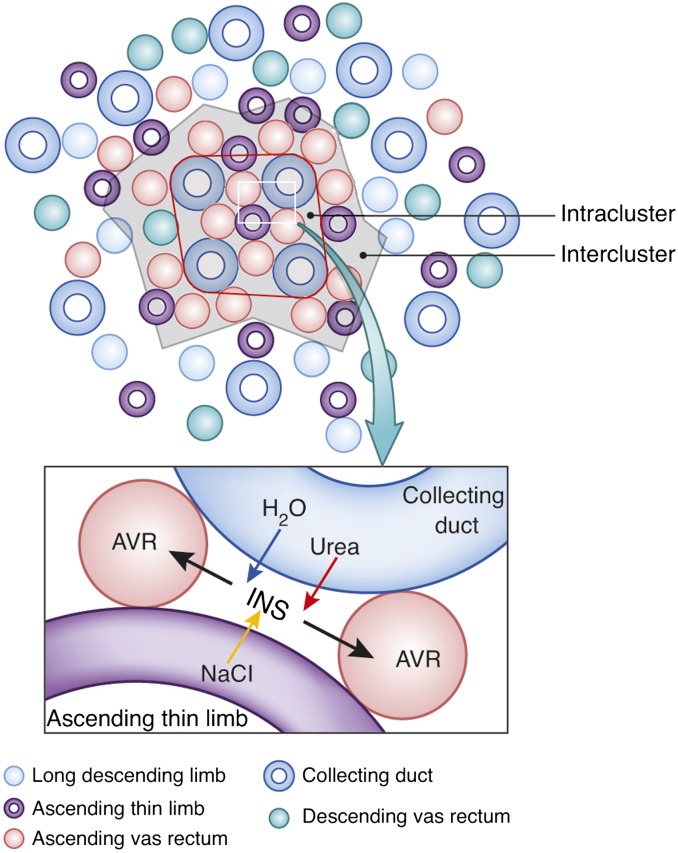
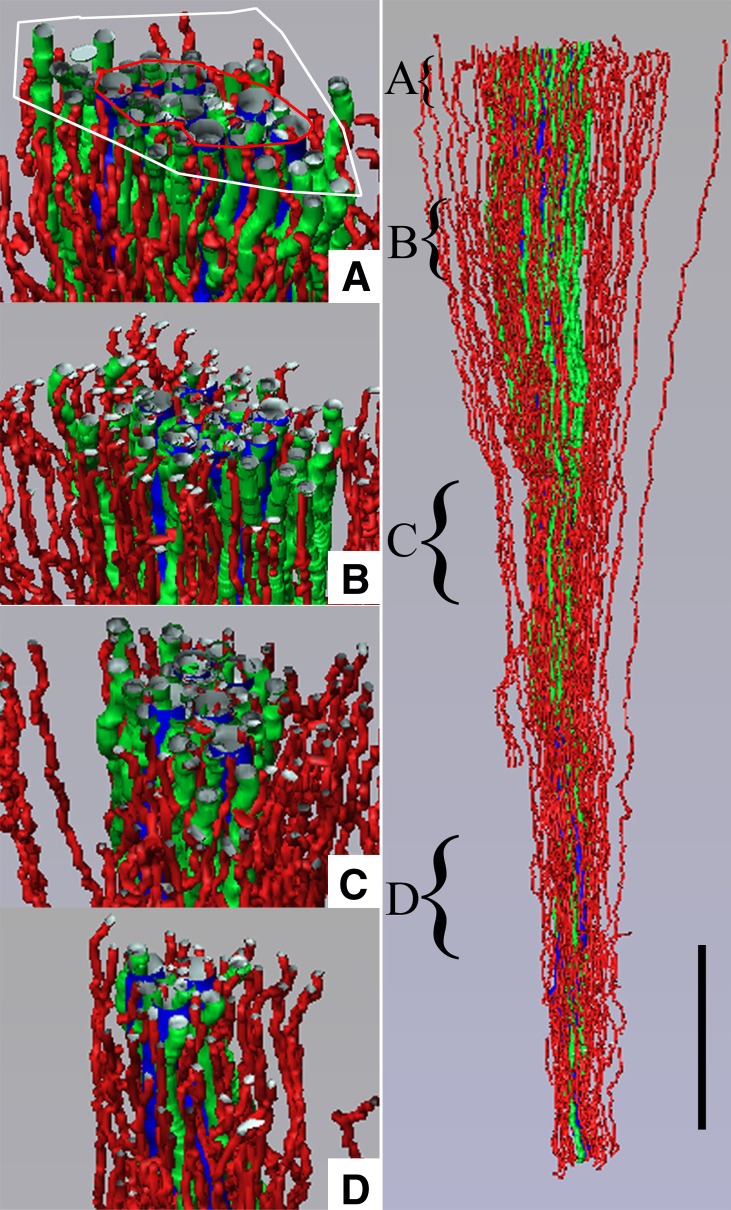
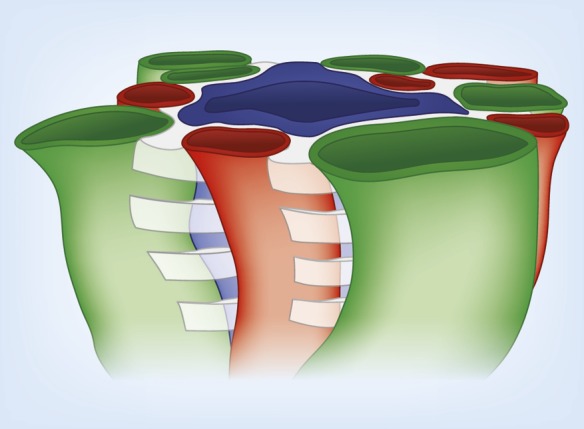
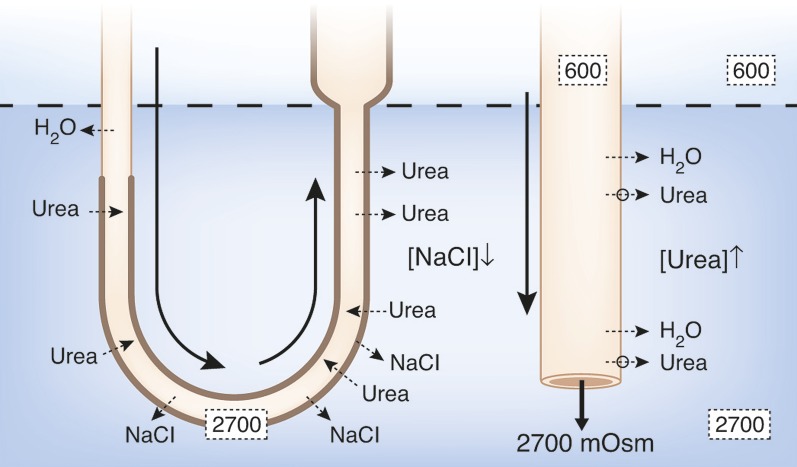
The ability of mammals to produce urine hyperosmotic to plasma requires the generation of a gradient of increasing osmolality along the medulla from the corticomedullary junction to the papilla tip. Countercurrent multiplication apparently establishes this gradient in the outer medulla, where there is substantial transepithelial reabsorption of NaCl from the water-impermeable thick ascending limbs of the loops of Henle. However, this process does not establish the much steeper osmotic gradient in the inner medulla, where there are no thick ascending limbs of the loops of Henle and the water-impermeable ascending thin limbs lack active transepithelial transport of NaCl or any other solute. The mechanism generating the osmotic gradient in the inner medulla remains an unsolved mystery, although it is generally considered to involve countercurrent flows in the tubules and vessels. A possible role for the three-dimensional interactions between these inner medullary tubules and vessels in the concentrating process is suggested by creation of physiologic models that depict the three-dimensional relationships of tubules and vessels and their solute and water permeabilities in rat kidneys and by creation of mathematical models based on biologic phenomena. The current mathematical model, which incorporates experimentally determined or estimated solute and water flows through clearly defined tubular and interstitial compartments, predicts a urine osmolality in good agreement with that observed in moderately antidiuretic rats. The current model provides substantially better predictions than previous models; however, the current model still fails to predict urine osmolalities of maximally concentrating rats.


Figures

Figure 1.
Figure 1.
Diagram of a single vas rectum and single long-looped nephron, illustrating how classic countercurrent multiplication could produce the osmotic gradient in the outer medulla, and how the “passive mechanism” was proposed to produce the osmotic gradient in the inner medulla (23,24). In the outer medulla, active transport of NaCl out of the water-impermeable thick ascending limb (indicated by solid arrows and black dots) creates the small osmotic pressure difference between that limb and the descending limb sufficient for classic countercurrent multiplication to generate the osmotic gradient (approximate osmolalities for rat kidney given by numbers in the black boxes). For the proposed “passive” mechanism in the inner medulla, urea ([urea]) is concentrated ([urea]) in urea-impermeable cortical and outer medullary collecting ducts by reabsorption of NaCl and water (broken arrows indicate passive movement). Urea then moves passively out of the inner medullary collecting ducts via vasopressin-regulated urea transporters (UT-A1, UT-A3; open circles and broken lines) into the surrounding inner medulla interstitium. This increased concentration of urea in the inner medullary interstitium draws water from descending thin limbs (DTLs) and inner medullary collecting ducts (IMCDs), thereby reducing inner medullary interstitial concentration of NaCl ([NaCl]). These processes result in a urea concentration in the interstitium that is higher than the urea concentration in the ascending thin limbs (ATLs) and a NaCl concentration in the ATLs that is higher than the NaCl concentration in the interstitium. NaCl will then tend to diffuse out of the ATLs (broken arrows) and urea will tend to diffuse into the ATLs (broken arrows). If the permeability of the ATLs to NaCl is sufficiently high and to urea sufficiently low, the interstitial fluid will be concentrated (producing the osmotic gradient) as the ATL fluid is being diluted. Countercurrent exchange of solutes and water helping to preserve this gradient is indicated in the vas rectum. Segments are numbered according to key.
Figure 2.
Figure 2.
Diagram of nephron and blood vessel architecture in the initial two thirds of the rat inner medulla. Collecting ducts (CDs) coalesce as they descend the corticopapillary axis, forming the intracluster region. DTLs and descending vasa recta (DVR) reside within the intercluster region. ATLs and ascending vasa recta (AVR) lie within the intercluster and intracluster regions. Modified from reference with permission. AQP1, aquaporin-1.
Figure 3.
Figure 3.
Three-dimensional reconstruction showing spatial relationships of DVR (green tubules) and DTLs (red tubules) to CDs (blue tubules) for a single CD cluster. DTL segments that do not express AQP1 are shown in gray. DTLs and DVR lie at the periphery of the central core of CDs, within the intercluster region, and A–D show that this relationship continues along the entire axial length of the CD cluster. Axial positions of A–D are indicated by the curly brackets in the right panel. Tubules are oriented in a corticopapillary direction, with the upper edge of the image near the outer medullary–inner medullary border. The interstitial area within the red boundary line is the “intracluster” region, and the interstitial area between the red and white boundary lines is the “intercluster” region. Scale bar, 500 μm. Reproduced from reference with permission.
Figure 4.
Figure 4.
Diagram of tubular organization in the rat renal medulla. Upper: cross-section through the outer two thirds of the inner medulla, where tubules and vessels are organized around a collecting duct cluster. Lower: schematic configuration of a CD, AVR, an ATL, and an interstitial nodal space (INS). This illustrates the targeted delivery of NaCl from the ATL to the interstitial nodal space, where it can mix with urea and water from the CD. Modified from reference with permission.
Figure 5.
Figure 5.
Three-dimensional reconstruction showing spatial relationships of AVR (red tubules) and ATLs (green tubules) to CDs (blue tubules) for the same CD cluster shown in Figure 3. ATLs and AVR reside within both the intercluster and intracluster regions, and A–D show that this relationship continues along the entire axial length of the CD cluster. Axial positions of A–D are indicated by the curly brackets in the right panel. Tubules are oriented in a corticopapillary direction, with the upper edge of the image near the base of the inner medulla. The interstitial area within the red boundary line is the “intracluster” region and the interstitial area between the red and white boundary lines is the “intercluster” region. Scale bar, 500 μm. Reproduced from reference with permission.
Figure 6.
Figure 6.
Three-dimensional model illustrating stacks of interstitial nodal spaces (white) surrounding a single CD. Interstitial nodal spaces are separated by interstitial cells (not shown) with axial thickness of 1–10 μm. Green, ATL; red, AVR; blue, CD.
Figure 7.
Figure 7.
Modification of Figure 1 to illustrate the unique permeabilities and solute fluxes of current solute-separation, solute-mixing passive model for concentrating urine. Thick tubule border indicates AQP1-null, water-impermeable segment of DTL as well as water-impermeable ATL and TAL. All arrows and symbols are as defined in Figure 1. The AQP1-null segment of the DTL is essentially impermeable to inorganic solutes and water. In this model, both the ATLs and the DTLs (including the AQP1-null segment) are highly permeable to urea. In contrast to the original passive model, passive NaCl reabsorption without water begins with the prebend segment and is most significant around the loop bend. Also, in contrast to previous models, urea moves passively into the entire DTL and early ATL, but as this urea-rich fluid further ascends in the ATL, it reaches regions of lower interstitial urea concentration and diffuses out of the ATL again. Thus, the loops act as countercurrent exchangers for urea.

References

    1. Hai MA, Thomas S: The time-course of changes in renal tissue composition during lysine vasopressin infusion in the rat. Pflugers Arch 310: 297–317, 1969 - PubMed
    1. Knepper MA: Measurement of osmolality in kidney slices using vapor pressure osmometry. Kidney Int 21: 653–655, 1982 - PubMed
    1. Wirz H, Hargitay B, Kuhn W: Lokalisation des Konzentrierungsprozesses in der niere durch direkte Kryoskopie. Helv Physiol Acta 9: 196–207, 1951 - PubMed
    1. Atherton JC, Green R, Thomas S: Influence of lysine-vasopressin dosage on the time course of changes in renal tissue and urinary composition in the conscious rat. J Physiol 213: 291–309, 1971 - PMC - PubMed
    1. Beck F, Dörge A, Rick R, Thurau K: Osmoregulation of renal papillary cells. Pflugers Arch 405[Suppl 1]: S28–S32, 1985 - PubMed

Publication types

Substances