. 2013 Dec 1;208(11):1877-87.
doi: 10.1093/infdis/jit370. Epub 2013 Aug 1.

Emergence of new pandemic GII.4 Sydney norovirus strain correlates with escape from herd immunity

Affiliations

Emergence of new pandemic GII.4 Sydney norovirus strain correlates with escape from herd immunity

Kari Debbink et al. J Infect Dis. .

Abstract

Background: GII.4 noroviruses are a significant source of acute gastroenteritis worldwide, causing the majority of human norovirus outbreaks. Evolution of the GII.4 major capsid protein occurs rapidly, resulting in the emergence of new strains that produce successive waves of pandemic disease. A new pandemic isolate, GII.4 2012 Sydney, largely replaced previously circulating strains in late 2012. We compare the antigenic properties of GII.4 2012 Sydney with previously circulating strains.

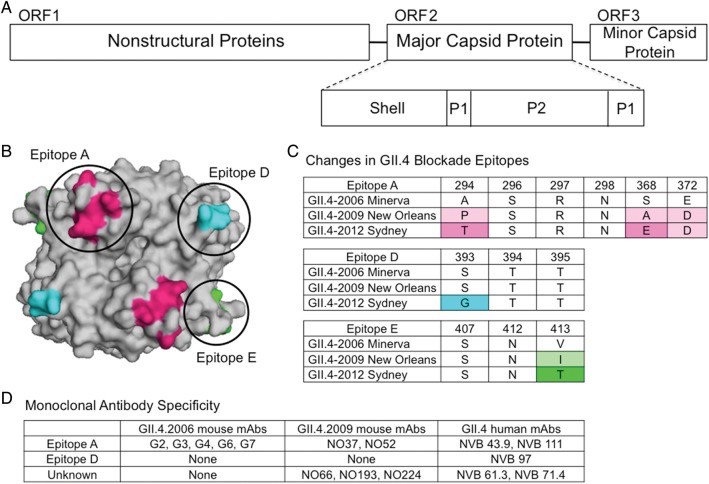
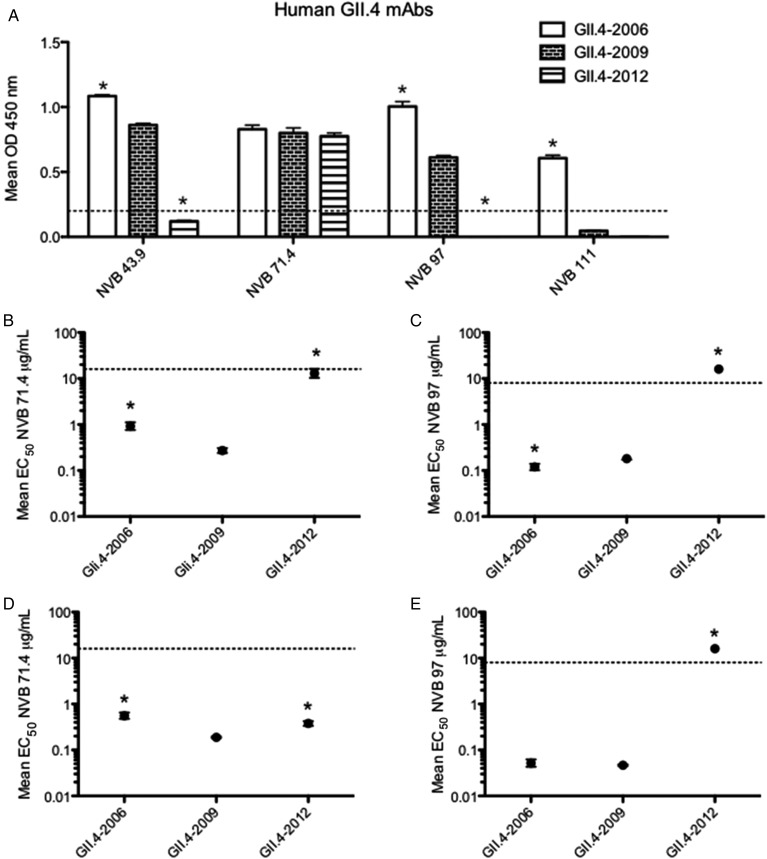
Methods: To determine whether GII.4-2012 Sydney is antigenically different from recently circulating strains GII.4-2006 Minerva and GII.4-2009 New Orleans in previously identified blockade epitopes, we compared reactivity and blockade profiles of GII.4-2006, GII.4-2009, and GII.4-2012 virus-like particles in surrogate neutralization/blockade assays using monoclonal antibodies and human polyclonal sera.

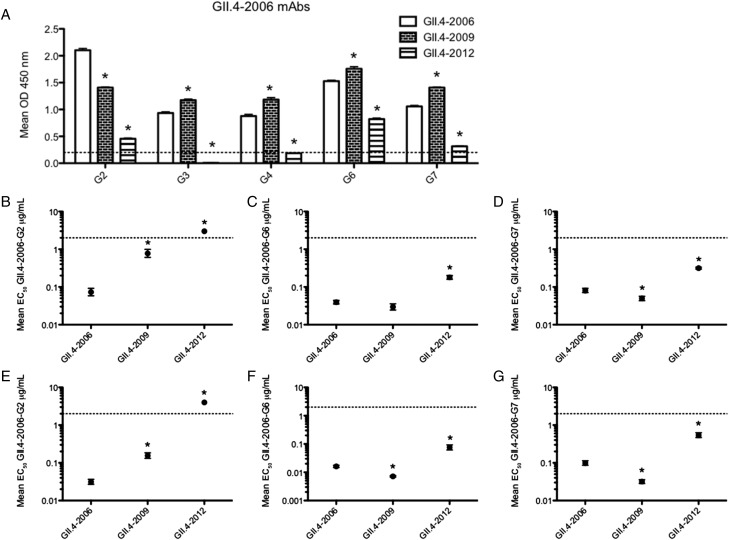
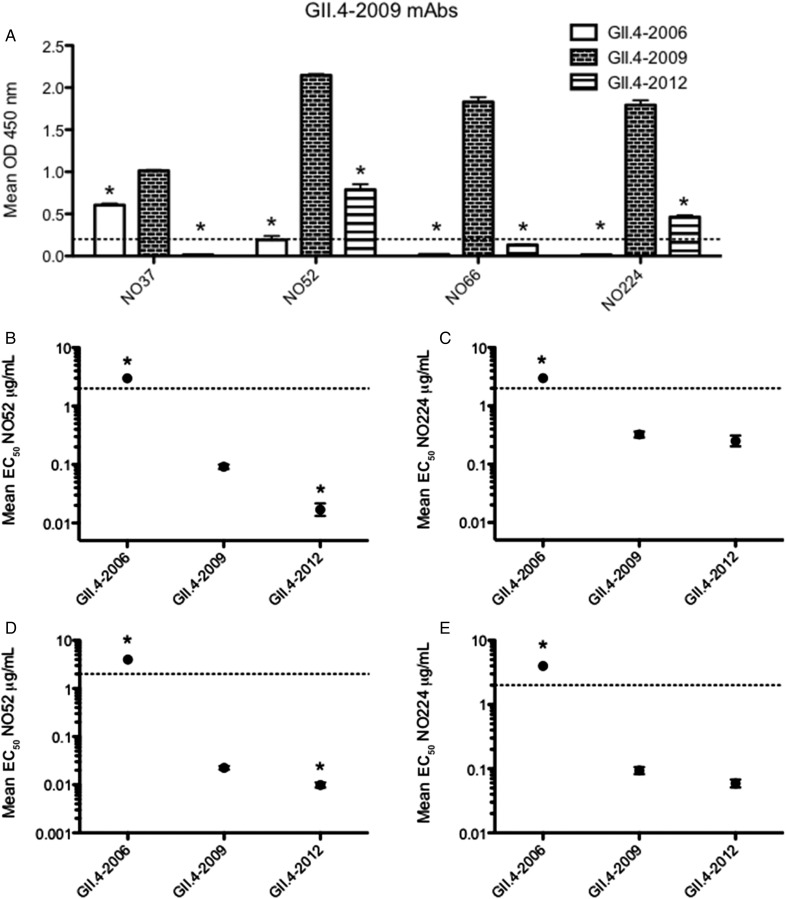
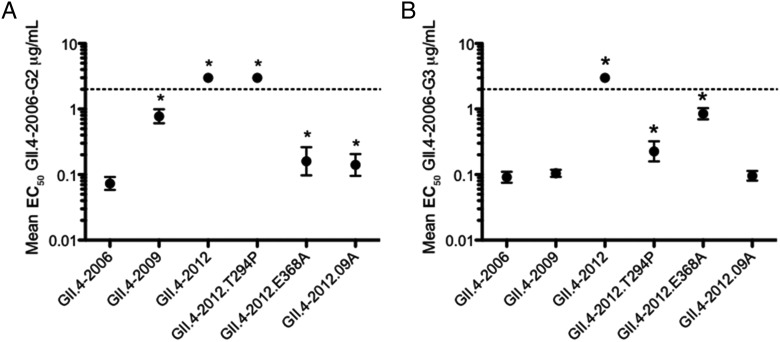
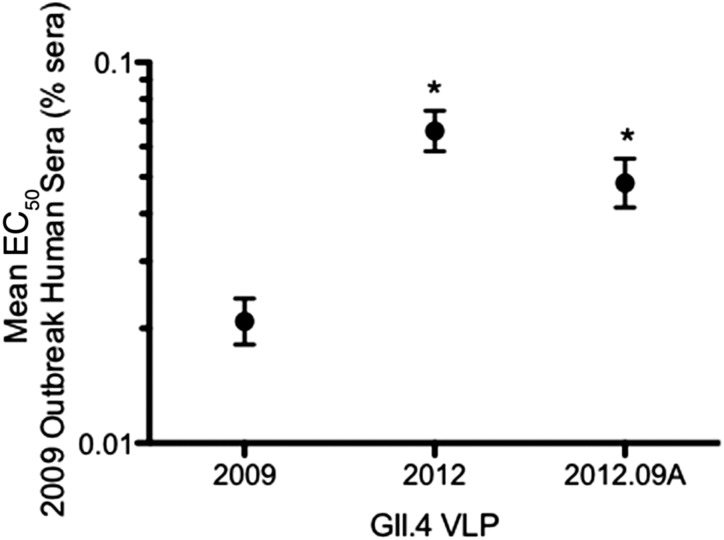
Results: Using monoclonal antibodies that map to known blockade epitopes in GII.4-2006 and GII.4-2009 and human outbreak polyclonal sera, we demonstrate either complete loss or significantly reduced reactivity and blockade of GII.4.2012 compared to GII.4-2006 and GII.4-2009.

Conclusions: GII.4-2012 Sydney is antigenically different from GII.4-2006 Minerva and GII.4-2009 New Orleans in at least 2 key blockade epitopes. Viral evolution in key potential neutralization epitopes likely allowed GII.4-2012 to escape from human herd immunity and emerge as the new predominant strain.

Keywords: GII.4 Sydney; norovirus; viral evolution; virus emergence; virus-like particles.


Figures

Figure 1.
Figure 1.
GII.4 norovirus structure and genetic variability in blockade epitopes. A, Schematic representation of the norovirus genome. Open reading frame (ORF) 1 encodes the nonstructural proteins, ORF2 encodes the major capsid protein, and ORF3 encodes the minor capsid protein. The major capsid protein is divided into the shell and the P1 and P2 subdomains. B, Blockade epitopes for GII.4 noroviruses. A structural model of a GII.4 norovirus P2 dimer indicates the location of previously identified blockade epitopes A, D, and E. C, GII.4-2012 changes in evolving blockade epitopes. Amino acid sequences from GII.4-2006, GII.4-2009, and GII.4-2012 were aligned and changes occurring in epitopes A, D, and E are noted in the tables. D, Previously reported epitope binding specificity of GII.4-2006 and GII.4-2009 mouse monoclonal antibodies (mAbs) and GII.4 human mAbs.
Figure 2.
Figure 2.
GII.4-2012 histoblood group antigen (HBGA) binding. Virus-like particles (VLPs) representing GII.4-2006, GII.4-2009, and GII.4-2012 strains were assayed for their ability to bind synthetic biotinylated HBGAs or pig gastric mucin type III (PGM). The mean optical density (OD) 450 nm was calculated and graphed. Error bars represent SEM. VLP reactivity is defined as a positive signal >3 times the background binding, indicated by the dashed line. Abbreviations: CHO, carbohydrate; Le, Lewis.
Figure 3.
Figure 3.
GII.4-2006 mouse monoclonal antibody (mAb) enzyme immunoassay (EIA) reactivity and blockade response against GII.4-2012. A, Mouse mAbs (1 µg/mL) against GII.4-2006 (G2, G3, G4, G6, and G7) were assayed for ability to react with GII.4-2006, GII.4-2009, and GII.4-2012 virus-like particles (VLPs) by EIA. The mean optical density (OD) 450 nm was calculated and graphed. Error bars represent SEM. *Reactivity is significantly different from that of the homotypic GII.4-2006 VLP. Reactivity is defined as a positive signal >0.2 by EIA, represented by the dashed line. VLP reactivity below the dashed line is considered nonreactive. BG, Mouse mAbs against GII.4-2006 (G2, G6, G7) were assayed for ability to block GII.4-2006, GII.4-2009, and GII.4-2012 VLP interaction with carbohydrate ligand pig gastric mucin type III (BD) or biotinylated B (EG). The mean percentage of control binding (percent of the VLP bound to carbohydrate ligand in the presence of an antibody compared to the amount of VLP bound with no antibody present) of each VLP was fit with a sigmoidal curve, and the mean EC50 (µg/mL) blockade titers (the antibody concentration at which 50% of VLP-PGM binding is blocked) for GII.4-2006, GII.4-2009, and GII.4-2012 were calculated. Error bars represent 95% confidence intervals. *Mean EC50 blockade titer for the test VLP is significantly different from the mean EC50 for GII.4-2006 (P < .05). Monoclonal antibodies that did not block a particular VLP were assigned an EC50 of 4 µg/mL for statistical analysis and are shown on the graph by data points above the upper limit of detection (dashed line). Statistics for both EIA and blockade assays were calculated by 1-way analysis of variance with Dunnett posttest.
Figure 4.
Figure 4.
GII.4-2009 mouse monoclonal antibody (mAb) enzyme immunoassay (EIA) reactivity and blockade response against GII.4-2012. A, Mouse mAbs (1 µg/mL) against GII.4-2009 (NO37, 52, 66, and 224) were assayed for ability to react with GII.4-2006, GII.4-2009, and GII.4-2012 VLPs by EIA. The mean optical density (OD) 450 nm was calculated and graphed. Error bars represent SEM. *Reactivity is significantly different from that of the homotypic GII.4-2009 virus-like particle (VLP). Reactivity is defined as a positive signal >0.2 by EIA, represented by the dashed line. VLP reactivity below the dashed line is considered nonreactive. BE, Mouse mAbs against GII.4-2009 (NO 52, 224) were assayed for ability to block GII.4-2006, GII.4-2009, and GII.4-2012 VLP interaction with carbohydrate ligand pig gastric mucin type III (B and C) or biotinylated B (DE). The mean percentage of control binding (percentage of the VLP bound to carbohydrate ligand in the presence of an antibody compared to the amount of VLP bound with no antibody present) of each VLP was fit with a sigmoidal curve, and the mean EC50 (µg/mL) blockade titers (the antibody concentration at which 50% of VLP-PGM binding is blocked) for GII.4-2006, GII.4-2009, and GII.4-2012 were calculated. Error bars represent 95% confidence intervals. *Mean EC50 blockade titer for the test VLP is significantly different from the mean EC50 for GII.4-2009 (P < .05). Monoclonal antibodies that did not block a particular VLP were assigned an EC50 of 4 µg/mL for statistical analysis and are shown on the graph by data points above the upper limit of detection (dashed line). Statistics for both EIA and blockade assays were calculated by 1-way analysis of variance with Dunnett posttest.
Figure 5.
Figure 5.
GII.4 human monoclonal antibody (mAb) enzyme immunoassay (EIA) reactivity and blockade response against GII.4-2012. A, Human mAbs against GII.4 norovirus (1 µg/mL) were assayed for ability to react with GII.4-2006, GII.4-2009, and GII.4-2012 virus-like particles (VLPs) by EIA. The mean optical density (OD) 450 nm was calculated and graphed. Error bars represent SEM. *Reactivity is significantly different from that of the GII.4-2009 VLP. Reactivity is defined as a positive signal >0.2 by EIA, represented by the dashed line. VLP reactivity below the dashed line is considered nonreactive. BE, Human mAbs against GII.4 noroviruses were assayed for ability to block GII.4-2006, GII.4-2009, and GII.4-2012 VLP interaction with carbohydrate ligand pig gastric mucin type III (B and C) or biotinylated B (D and E). The mean percentage of control binding (percentage of the VLP bound to carbohydrate ligand in the presence of an antibody compared to the amount of VLP bound with no antibody present) of each VLP was fit with a sigmoidal curve, and the mean EC50 (µg/mL) blockade titers (the antibody concentration at which 50% of VLP-PGM binding is blocked) for GII.4-2006, GII.4-2009, and GII.4-2012 were calculated. Error bars represent 95% confidence intervals. *Mean EC50 blockade titer for the tested VLP is significantly different from the mean EC50 for GII.4-2009 (P < .05). Monoclonal antibodies that did not block a particular VLP at the highest mAb concentration tested were assigned an EC50 of 2 times the upper limit tested in µg/mL for statistical analysis and are shown on the graph by data points above the upper limit of detection (dashed line). Statistics for both EIA and blockade assays were calculated by 1-way analysis of variance with Dunnett posttest.
Figure 6.
Figure 6.
Monoclonal antibody (mAb) blockade of chimeric GII.4-2012 virus-like particles (VLPs). Mouse and human epitope A–targeting monoclonal antibodies against GII.4 noroviruses (2006-G2, G3, G4, G6, G7, NO37, NO52, and NVB 43.9) were assayed for ability to block GII.4-2012.T294P, GII.4-2012.E368A, and GII.4-2012.09A interaction with carbohydrate ligand, and graphs representative of 2 distinct patterns are shown. The mean percentage of control binding (percent of the VLP bound to carbohydrate ligand in the presence of an antibody compared to the amount of VLP bound with no antibody present) of each VLP was fit with a sigmoidal curve, and the mean EC50 (µg/mL) blockade titers (the antibody concentration at which 50% of VLP-PGM binding is blocked) for GII.4-2009, GII.4-2012 VLP, GII.4-2012.T294P, GII.4-2012.E368A, and GII.4-2012.09A were calculated. Error bars represent 95% confidence intervals. *Mean EC50 blockade titer for the tested VLP is significantly different from the mean EC50 for GII.4-2009 (P < .05). Monoclonal antibodies that did not block a particular VLP at the highest mAb concentration tested were assigned an EC50 of 2 times the upper limit tested in µg/mL for statistical analysis and are shown on the graph by data points above the upper limit of detection (dashed line). Statistics for both enzyme immunoassay and blockade assays were calculated by 1-way analysis of variance with Dunnett posttest.
Figure 7.
Figure 7.
GII.4-2012 and GII.4-2012.09A blockade by GII.4-2009 outbreak human sera. Human convalescent polyclonal sera from 8 individuals infected in 2010 with GII.4-2009 New Orleans were assayed for ability to block GII.4-2009, GII.4-2012, and GII.4-2012.09A virus-like particle (VLP) interaction with carbohydrate ligand. The mean percentage of control binding (percentage of the VLP bound to carbohydrate ligand in the presence of sera compared to the amount of VLP bound with no sera present) of each VLP was fit with a sigmoidal curve, and the mean EC50 (% sera) blockade titers (the serum concentration at which 50% of VLP-PGM binding is blocked) for GII.4-2009, GII.4-2012, and GII.4-2012.09A were calculated. Error bars represent 95% confidence intervals. *Mean EC50 blockade titer is significantly different from the mean EC50 for GII.4-2009 (P < .05). Statistics were calculated by 1-way analysis of variance with Dunnett posttest.

References

    1. Scallan E, Hoekstra RM, Angulo FJ, et al. Foodborne illness acquired in the United States—major pathogens. Emerg Infect Dis. 2011;17:7–15. - PMC - PubMed
    1. Zheng DP, Ando T, Fankhauser RL, Beard RS, Glass RI, Monroe SS. Norovirus classification and proposed strain nomenclature. Virology. 2006;346:312–23. - PubMed
    1. Updated norovirus outbreak management and disease prevention guidelines. MMWR Recomm Rep. 2011;60:1–18. - PubMed
    1. Fankhauser RL, Monroe SS, Noel JS, et al. Epidemiologic and molecular trends of “Norwalk-like viruses” associated with outbreaks of gastroenteritis in the United States. J Infect Dis. 2002;186:1–7. - PubMed
    1. Lindesmith LC, Beltramello M, Donaldson EF, et al. Immunogenetic mechanisms driving norovirus GII.4 antigenic variation. PLoS Pathog. 2012;8:e1002705. - PMC - PubMed

Publication types

MeSH terms