. 2013 Aug;15(8):939-51.
doi: 10.1593/neo.13804.

Flavopiridol synergizes with sorafenib to induce cytotoxicity and potentiate antitumorigenic activity in EGFR/HER-2 and mutant RAS/RAF breast cancer model systems

Affiliations

Flavopiridol synergizes with sorafenib to induce cytotoxicity and potentiate antitumorigenic activity in EGFR/HER-2 and mutant RAS/RAF breast cancer model systems

Teddy S Nagaria et al. Neoplasia. 2013 Aug.

Abstract

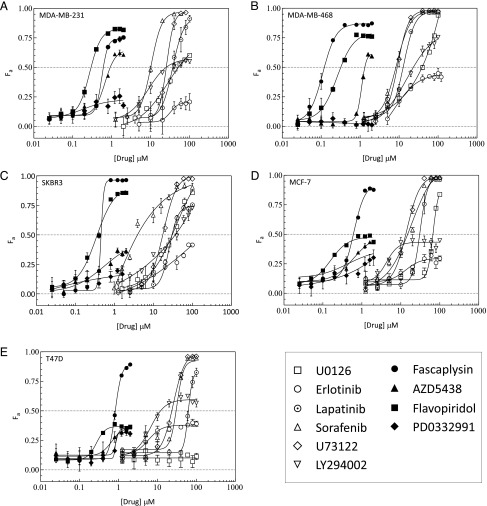
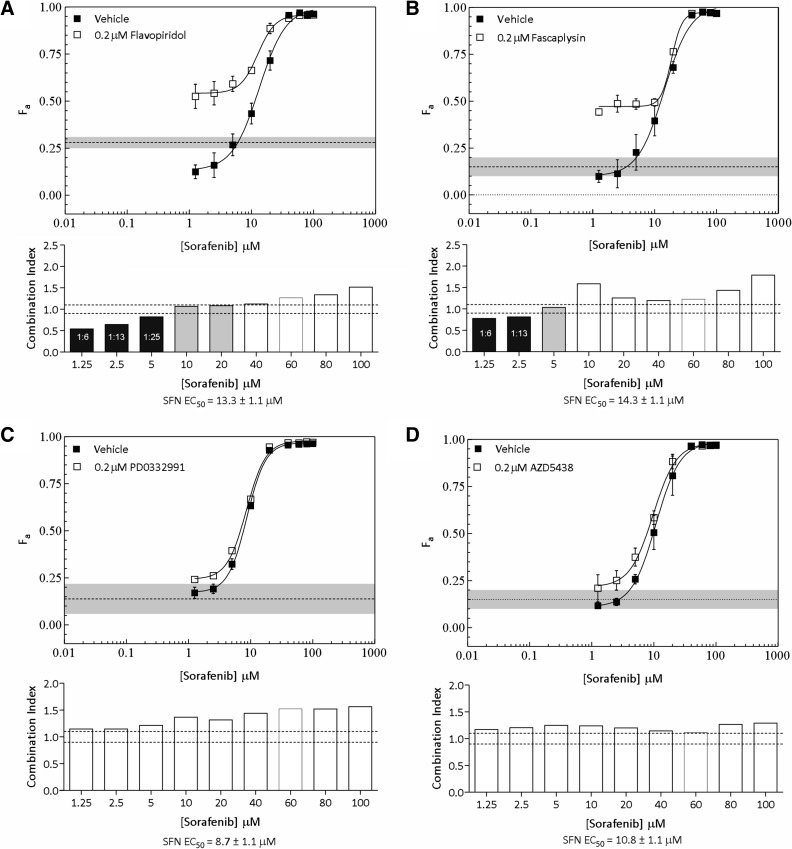
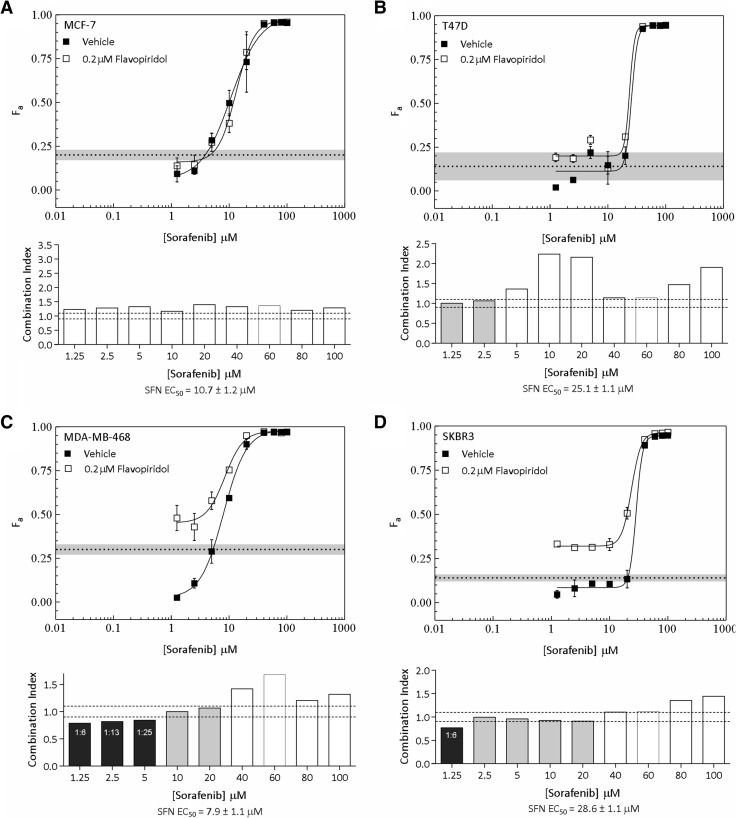
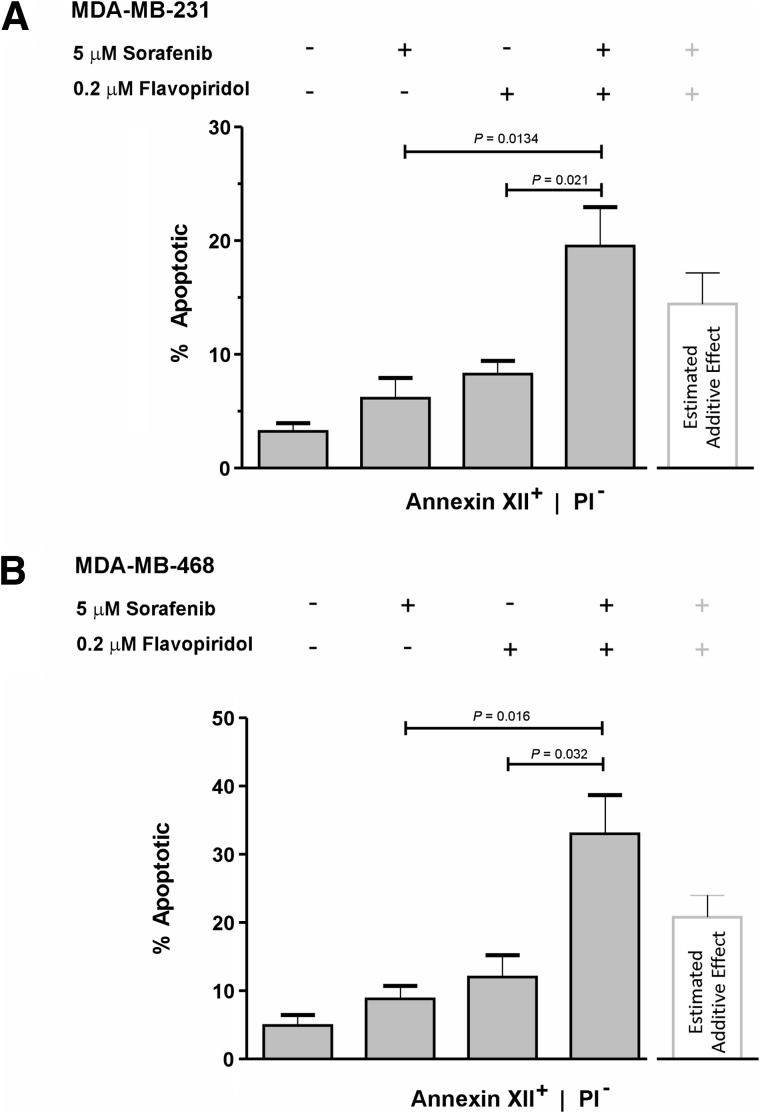
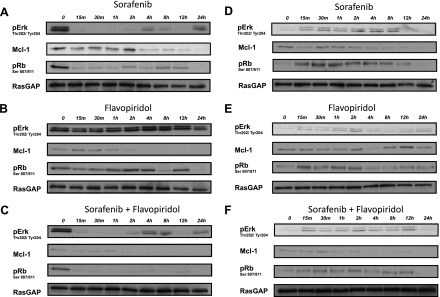
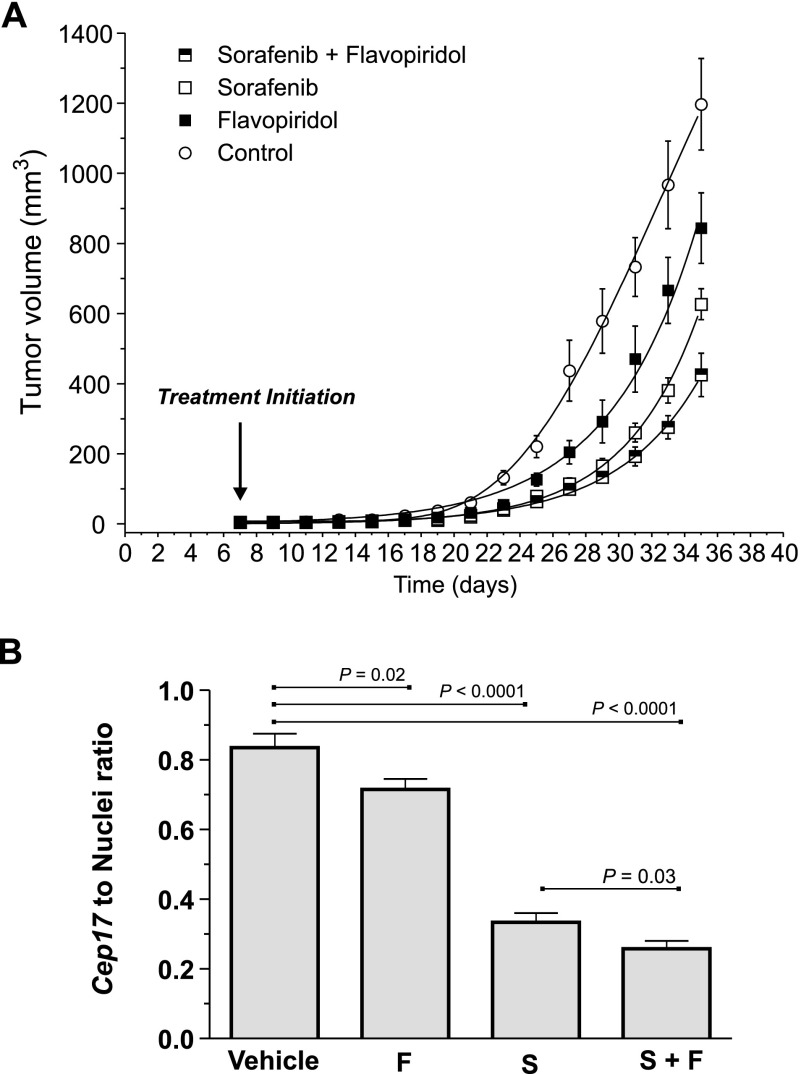
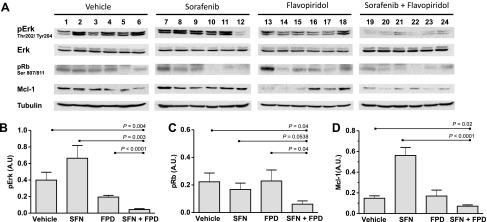
Oncogenic receptor tyrosine kinase (RTK) signaling through the Ras-Raf-Mek-Erk (Ras-MAPK) pathway is implicated in a wide array of carcinomas, including those of the breast. The cyclin-dependent kinases (CDKs) are implicated in regulating proliferative and survival signaling downstream of this pathway. Here, we show that CDK inhibitors exhibit an order of magnitude greater cytotoxic potency than a suite of inhibitors targeting RTK and Ras-MAPK signaling in cell lines representative of clinically recognized breast cancer (BC) subtypes. Drug combination studies show that the pan-CDK inhibitor, flavopiridol (FPD), synergistically potentiated cytotoxicity induced by the Raf inhibitor, sorafenib (SFN). This synergy was most pronounced at sub-EC50 SFN concentrations in MDA-MB-231 (KRAS-G13D and BRAF-G464V mutations), MDA-MB-468 [epidermal growth factor receptor (EGFR) overexpression], and SKBR3 [ErbB2/EGFR2 (HER-2) overexpression] cells but not in hormone-dependent MCF-7 and T47D cells. Potentiation of SFN cytotoxicity by FPD correlated with enhanced apoptosis, suppression of retinoblastoma (Rb) signaling, and reduced Mcl-1 expression. SFN and FPD were also tested in an MDA-MB-231 mammary fat pad engraftment model of tumorigenesis. Mice treated with both drugs exhibited reduced primary tumor growth rates and metastatic tumor load in the lungs compared to treatment with either drug alone, and this correlated with greater reductions in Rb signaling and Mcl-1 expression in resected tumors. These findings support the development of CDK and Raf co-targeting strategies in EGFR/HER-2-overexpressing or RAS/RAF mutant BCs.


Figures

Figure 1
Figure 1
Comparison of cytotoxicity induced by CDK and RTK-P inhibitors. (A) MDA-MB-231, (B) MDA-MB-468, (C) SKBR3, (D) MCF-7, and (E) T47D cells were treated with increasing concentrations of the indicated inhibitors. Cell viability was assayed after 72 hours. The fraction of cells killed (Fa ± SEM) by treatment with a panel of CDK inhibitors (solid markers) and RTK-P inhibitors (open markers) are shown. The RTK-P inhibitors U0126, erlotinib, lapatinib, SFN, U73122, and LY294002 were used to inhibit Mek, EGFR, EGFR/HER-2, Raf, PLC, and PI3K, respectively. Dose-effect profiles are representative of two to three independent experiments.
Figure 2
Figure 2
Potentiation of SFN-induced cytotoxicity by a panel of CDK inhibitors in MDA-MB-231 cells. (A–D, upper panels) The fraction of cells killed (Fa ± SEM) by SFN in the presence of DMSO (vehicle) or a fixed concentration (0.2 µM) of FPD (A), fascaplysin (B), PD0332991 (C), and AZD5438 (D). The fraction of cells killed by CDK inhibitors at a fixed concentration of 0.2 µM is shown for comparison [dashed lines; gray shading (±SEM)]. (A–D; lower panels) MDE-CI analysis of drug interactions in the upper panels. CIs as a function of SFN concentration are shown. Black, gray, and white bars denote synergistic (CI < 0.9), additive (CI = 0.9–1.1), or antagonistic interactions (CI > 1.1), respectively. Synergistic ratios and SFN-EC50 are indicated. Data are representative of two to three independent experiments.
Figure 3
Figure 3
Potentiation of SFN-induced cytotoxicity by FPD in MCF-7, T47D, MDA-MB-468, and SKBR3 cells. (A–D, upper panels) The fraction of cells killed (Fa ± SEM) by SFN in the presence of DMSO (vehicle) or a fixed concentration (0.2 µM) of FPD in MCF-7 (A), T47D (B), MDA-MB-468 (C), and SKBR3 (D) cells. The fraction of cells killed by CDK inhibitors at a fixed concentration of 0.2 µM is shown for comparison [dashed lines; gray shading (±SEM)]. (A–D, lower panels) MDE-CI analysis of drug interactions in the upper panels. CIs as a function of SFN concentration are shown. Black, gray, and white bars denote synergistic (CI < 0.9), additive (CI = 0.9–1.1), or antagonistic interactions (CI > 1.1), respectively. Synergistic ratios and SFN-EC50 are indicated. Data are representative of two to three independent experiments.
Figure 4
Figure 4
Potentiation of SFN-induced apoptosis by FPD. Cells were treated with either DMSO, 0.2 µM FPD, 5 µM SFN, or 1:25 ratio of FPD-SFN (0.2 µMand 5 µM, respectively) for 24 hours. The percentages (mean ± SEM) of early apoptotic (annexin XII+), non-necrotic (PI-) MDA-MB-231 (A) and MDA-MB-468 (B) cells detected after drug treatment (gray bars) are shown. The white bar indicates the fraction of apoptotic cells expected by simple addition of the percentage of apoptotic cells induced by SFN or FPD alone. Significant P values are indicated (t test; n = 3–4).
Figure 5
Figure 5
Inhibition of Ras-MAPK and Rb-E2F signaling by SFN-FPD combinations. MDA-MB-231 (A–C) and MDA-MB-468 (D–F) cells were treated with SFN (5 µM; A, D), FPD (0.2 µM; B, E), or a 1:25 combination ratio of FPD-SFN (0.2 µMand 5 µM, respectively; C, F). Erk phosphorylation at T202/Y204 indicative of its active state. Rb phosphorylation at S807/811 indicative of inactivation catalyzed by CDKs [33]. Loading was assessed by levels of the Ras GTPase-activating protein, RasGAP. Blots are representative of two to three independent experiments.
Figure 6
Figure 6
Combined treatment of SFN and FPD results in enhanced tumor suppression in vivo. (A) Tumor development profiles of drug-treated cohorts (six mice/cohort). Estimates of mean tumor volume ± SEM are shown. Control versus SFN, FPD, or SFN-FPD (P < .0001; two-way analysis of variance). SFN-FPD versus SFN or FPD (P < .0001; two-way analysis of variance). (B) Pulmonary metastatic tumor burden assessed by quantification of the ratio (±SEM) of human Cep17 signal and DAPI-stained nuclei in each cohort (n = 24; see also Figure W2). Significant P values (t test) areindicated.
Figure 7
Figure 7
SFN and FPD cooperatively inhibit Erk, Mcl-1, and Rb signaling in tumors. (A) Immunoblots of lysates prepared from resected tumors assessing pErk, pRb, and Mcl-1 levels in the indicated cohorts (n = 24). Loading was assessed by tubulin levels. (B–D) Densitometry analyses of the average intensity of pErk, pRb, and Mcl-1. The mean ± SEM intensity expressed as a ratio of tubulin intensity across treatment cohorts (six mice/cohort) is shown. Significant P values (t test) are indicated. A.U., arbitrary units.

Similar articles

Cited by

References

    1. Rusnak DW, Alligood KJ, Mullin RJ, Spehar GM, Arenas-Elliott C, Martin AM, Degenhardt Y, Rudolph SK, Haws TF, Jr, Hudson-Curtis BL, et al. Assessment of epidermal growth factor receptor (EGFR, ErbB1) and HER2 (ErbB2) protein expression levels and response to lapatinib (Tykerb, GW572016) in an expanded panel of human normal and tumour cell lines. Cell Prolif. 2007;40:580–594. - PMC - PubMed
    1. Pegram MD, Konecny GE, O'Callaghan C, Beryt M, Pietras R, Slamon DJ. Rational combinations of trastuzumab with chemotherapeutic drugs used in the treatment of breast cancer. J Natl Cancer Inst. 2004;96:739–749. - PubMed
    1. Slamon DJ, Godolphin W, Jones LA, Holt JA, Wong SG, Keith DE, Levin WJ, Stuart SG, Udove J, Ullrich A, et al. Studies of the HER-2/neu protooncogene in human breast and ovarian cancer. Science. 1989;244:707–712. - PubMed
    1. Janne PA, Gray N, Settleman J. Factors underlying sensitivity of cancers to small-molecule kinase inhibitors. Nat Rev Drug Discov. 2009;8:709–723. - PubMed
    1. Gerlinger M, Rowan AJ, Horswell S, Larkin J, Endesfelder D, Gronroos E, Martinez P, Matthews N, Stewart A, Tarpey P, et al. Intratumor heterogeneity and branched evolution revealed by multiregion sequencing. NEngl J Med. 2012;366:883–892. - PMC - PubMed

Publication types

MeSH terms