. 2013 Jul 30:4:197.
doi: 10.3389/fphys.2013.00197. eCollection 2013.

Do physiological and pathological stresses produce different changes in heart rate variability?

Affiliations

Do physiological and pathological stresses produce different changes in heart rate variability?

Andrea Bravi et al. Front Physiol. .

Abstract

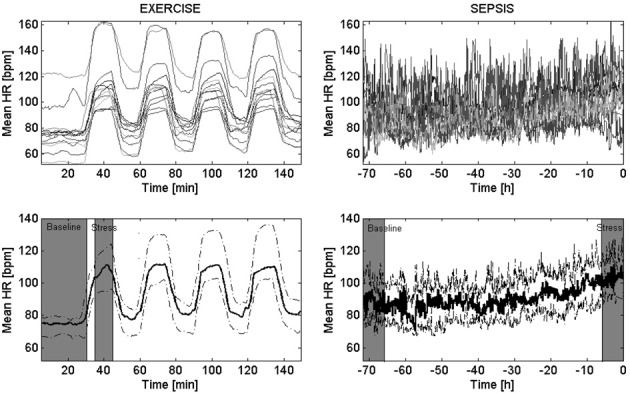
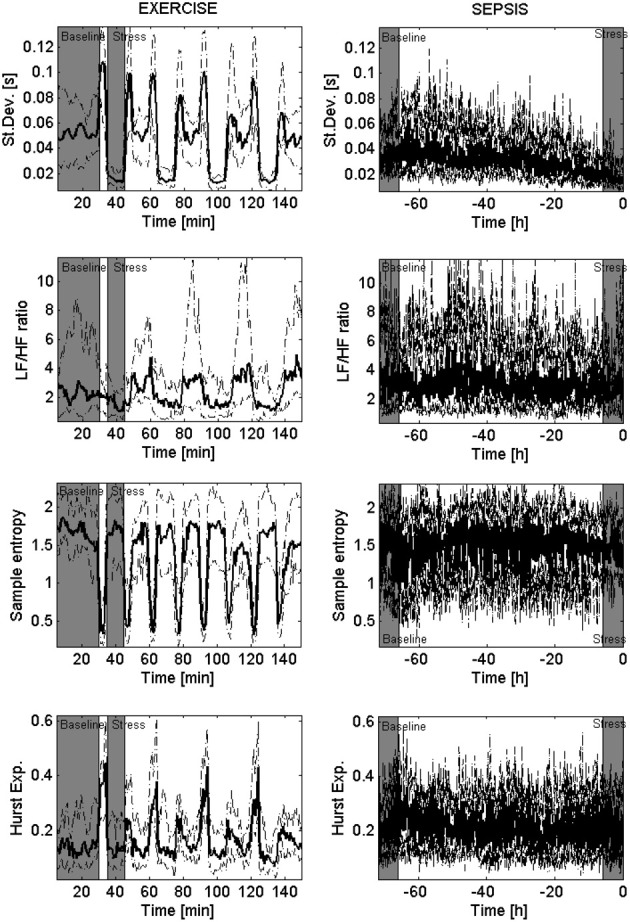
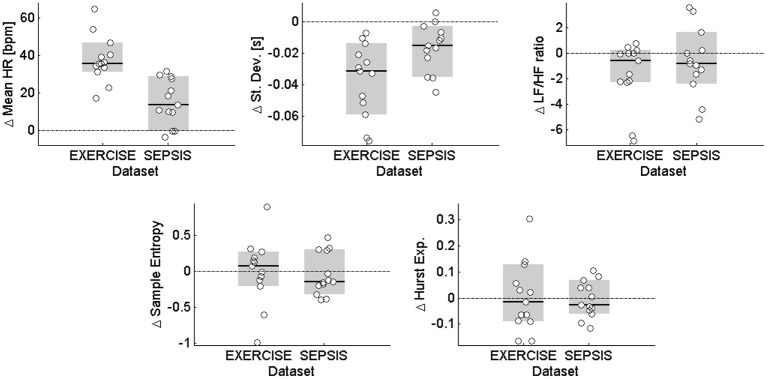
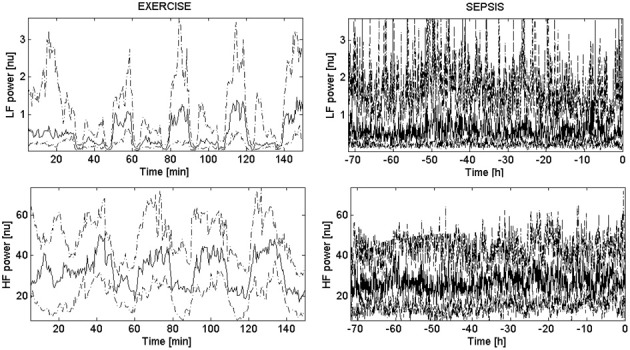
Although physiological (e.g., exercise) and pathological (e.g., infection) stress affecting the cardiovascular system have both been documented to be associated with a reduction in overall heart rate variability (HRV), it remains unclear if loss of HRV is ubiquitously similar across different domains of variability analysis or if distinct patterns of altered HRV exist depending on the stressor. Using Continuous Individualized Multiorgan Variability Analysis (CIMVA™) software, heart rate (HR) and four selected measures of variability were measured over time (windowed analysis) from two datasets, a set (n = 13) of patients who developed systemic infection (i.e., sepsis) after bone marrow transplant (BMT), and a matched set of healthy subjects undergoing physical exercise under controlled conditions. HR and the four HRV measures showed similar trends in both sepsis and exercise. The comparison through Wilcoxon sign-rank test of the levels of variability at baseline and during the stress (i.e., exercise or after days of sepsis development) showed similar changes, except for LF/HF, ratio of power at low (LF) and high (HF) frequencies (associated with sympathovagal modulation), which was affected by exercise but did not show any change during sepsis. Furthermore, HRV measures during sepsis showed a lower level of correlation with each other, as compared to HRV during exercise. In conclusion, this exploratory study highlights similar responses during both exercise and infection, with differences in terms of correlation and inter-subject fluctuations, whose physiologic significance merits further investigation.

Keywords: dimensions of variability; disease; domains of variability; exercise; physical activity; sepsis.


Figures

Figure 1
Figure 1
Trends of mean heart rate in EXERCISE and SEPSIS. Top panels show how the mean heart rate (HR) changed over time for all the subjects (above), for either EXERCISE (left) or SEPSIS (right) datasets. Bottom panels report the median trends across each population—i.e., population trend—(bold solid line), together with the 95% confidence interval (dashed line). The EXERCISE time series start from 30 min prior the beginning of the first exercise bout, to the end of the last resting period. The SEPSIS time series start from 72 h prior the administration of antibiotics, to the time of administration of antibiotics (t = 0). In gray are highlighted the areas we referred to as “baseline” and “stress.”
Figure 2
Figure 2
Population trends in physiological dimensions of variability. These eight panels show the population trends of four measures of variability, hypothetically linked to separate physiological dimensions. From the top, each row presents: standard deviation, LF/HF ratio (computed through the Lomb–Scargle periodogram), sample entropy, and Hurst exponent (computed through Scaled windowed variance). The columns depict the median trend across all the subjects (bold solid line) and its 95% confidence intervals (dashed line) for the EXERCISE dataset (left) and the SEPSIS dataset (right). In gray are highlighted the areas we referred to as “baseline” and “stress.”
Figure 3
Figure 3
Distributions of change from baseline to stress. The five panels show the distributions for mean HR and the four investigated measures of HRV. Each white circle represents the change in the median variability of a given subject from baseline to stress, as described in Table 3. The black solid line is the median of the dataset, and the gray area identifies the 95% confidence intervals for the median. The horizontal dash-dot lines highlight the lines of no change from baseline to stress.
Figure A1
Figure A1
Population trends of LF and HF power. Body: These four panels show the population trends of LF (top) and HF (bottom) power computed through the Lomb–Scargle periodogram. Each panel depicts the median trend across all the subjects (bold solid line) and its 95% confidence intervals (dashed line) for the EXERCISE dataset (left) and the SEPSIS dataset (right).

References

    1. Ahmad S., Ramsay T., Huebsch L., Flanagan S., McDiarmid S., Batkin I., et al. (2009). Continuous multi-parameter heart rate variability analysis heralds onset of sepsis in adults. PLoS ONE 4:e6642 10.1371/journal.pone.0006642 - DOI - PMC - PubMed
    1. Barrera-Ramirez J., Bravi A., Geoffrey G., Seely A., Kenny G. (2013). Comparison of heart and respiratory rate variability measures using an intermittent incremental submaximal exercise model. Appl. Physiol. Nutr. Metab. [Epub ahead of print]. 10.1139/apnm-2012-0370 - DOI - PubMed
    1. Bente Klarlund P. (2005). Natural immunity—effect of exercise. Nat. Immun. (Elsevier) 5, 263–288
    1. Bravi A. (2013). CIMVA Core Description manual. Available online at: http://ohridal.org/cimva/CIMVA-Core-Description.pdf
    1. Bravi A., Green G., Longtin A., Seely A. J. (2012). Monitoring and identification of sepsis development through a composite measure of heart rate variability. PLoS ONE 7:e45666 10.1371/journal.pone.0045666 - DOI - PMC - PubMed