. 2013 Jul 30:2:e00768.
doi: 10.7554/eLife.00768.

Functional genomic characterization of neoblast-like stem cells in larval Schistosoma mansoni

Affiliations

Functional genomic characterization of neoblast-like stem cells in larval Schistosoma mansoni

Bo Wang et al. Elife. .

Abstract

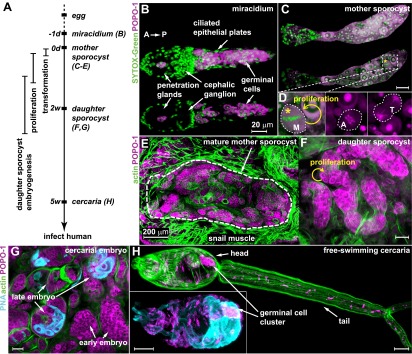
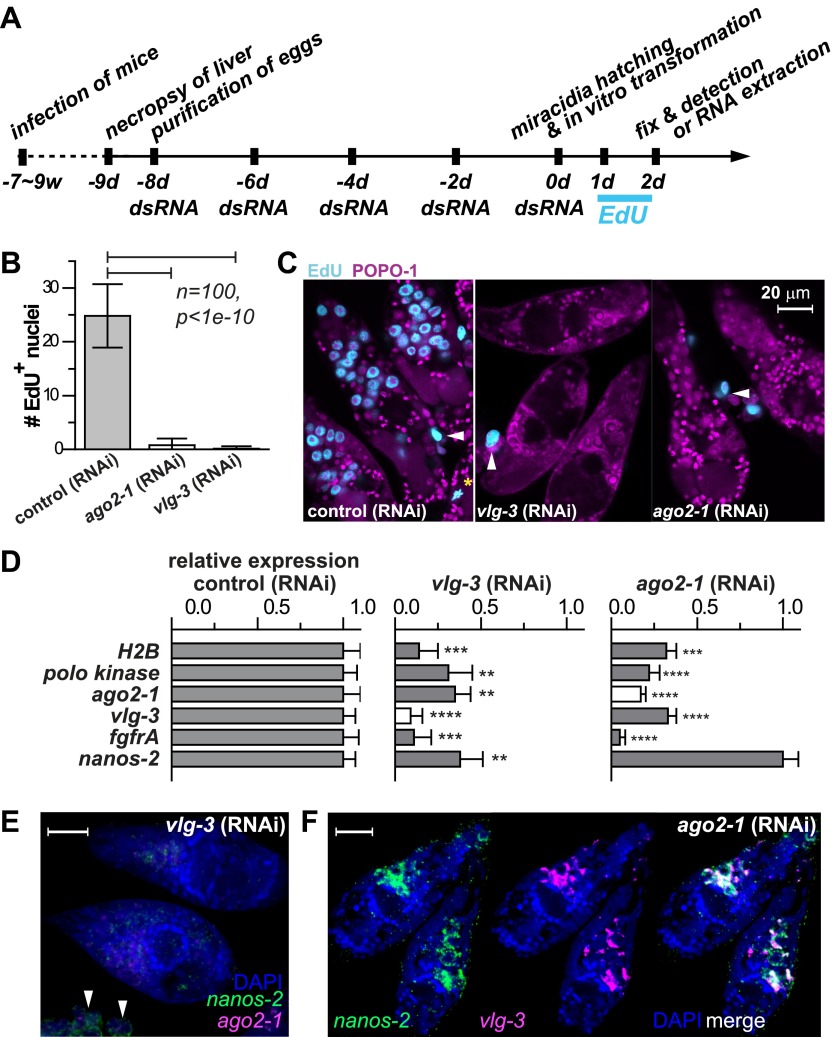
Schistosomes infect hundreds of millions of people in the developing world. Transmission of these parasites relies on a stem cell-driven, clonal expansion of larvae inside a molluscan intermediate host. How this novel asexual reproductive strategy relates to current models of stem cell maintenance and germline specification is unclear. Here, we demonstrate that this proliferative larval cell population (germinal cells) shares some molecular signatures with stem cells from diverse organisms, in particular neoblasts of planarians (free-living relatives of schistosomes). We identify two distinct germinal cell lineages that differ in their proliferation kinetics and expression of a nanos ortholog. We show that a vasa/PL10 homolog is required for proliferation and maintenance of both populations, whereas argonaute2 and a fibroblast growth factor receptor-encoding gene are required only for nanos-negative cells. Our results suggest that an ancient stem cell-based developmental program may have enabled the evolution of the complex life cycle of parasitic flatworms. DOI:http://dx.doi.org/10.7554/eLife.00768.001.

Keywords: Other; Schistosoma mansoni; neoblasts; schistosomiasis; stem cells; trematode development.


Conflict of interest statement

The authors declare that no competing interests exist.

Figures

Figure 1.
Figure 1.. Germinal cells are detected throughout the asexual phase of the S. mansoni life cycle.
(A) A schematic timeline of schistosome asexual amplification. (BC) Maximum intensity projections of confocal stacks (top) and single optical slices (bottom) of a POPO-1 and SYTOX-Green co-stained miracidium (B) and a sporocyst 24 hr after in vitro transformation (C). (D) Representative images of cells at metaphase (M), anaphase (A), and telophase (T) (from left to right), captured in sporocysts 24 hr post-transformation. (EG) Cryosections of the tentacle of a Biomphalaria glabrata snail showing a mother sporocyst (perimeter highlighted by dashed line) with daughter sporocysts packed inside (3 weeks post infection) (E); an individual daughter sporocyst that has migrated to the digestive glands of a B. glabrata snail 6 weeks post infection (F); and cercarial embryos within a daughter sporocyst in the digestive glands of a B. glabrata snail 6 weeks post infection (G) (staged after Cheng and Bier, 1972). Actin is stained with phalloidin. Peanut agglutinin (PNA) visualizes acetabular glands and ducts of the cercariae. (H) A mature cercaria. The inset shows a magnified view of this animal’s head visualized with PNA and POPO-1 staining. Scale bars are 20 µm, except in (E) which is 200 µm. DOI: http://dx.doi.org/10.7554/eLife.00768.003
Figure 2.
Figure 2.. Life-cycle stage-specific transcriptional profiling to characterize germinal cell gene expression.
(A) EdU labeling to detect proliferating cells at various time points following transformation. For these experiments sporocysts were co-cultured with Bge cells, a cell line derived from embryos of B. glabrata snails, to sustain the normal development of larval schistosomes. Arrows indicate cells weakly incorporating EdU at the early time point; arrowheads indicate proliferating Bge cells. Asterisks highlight cells in mitosis. In the absence of SYTOX-Green, POPO-1 also stains somatic nuclei, which are small and compact. Scale bars are 20 µm. (B) Transcripts expressed in sporocysts 48 hr post-transformation, ranked by abundance as measured by RNAseq. Orthologs shared between sporocyst-enriched genes and planarian neoblast-enriched transcripts are highlighted in cyan. (C) Relative expression levels of ago2-1, vlg-3, and nanos-2 during sporocyst development with respect to the expression in miracidia, measured by qPCR in biological triplicate. Error bars are standard deviations. **p<0.01. ***p<0.001 (t-test). DOI: http://dx.doi.org/10.7554/eLife.00768.004
Figure 2—figure supplement 1.
Figure 2—figure supplement 1.. Transcriptional profiling reveals genome-wide similarity between schistosome germinal cells and planarian neoblasts.
(A) Histogram of fold changes of gene expression in sporocysts 48 hr post-transformation with respect to expression in miracidia, follows a log-normal distribution. The half standard deviation is used as the threshold to define differentially expressed transcripts. (B) Expression of sporocyst-specific genes that have homologs in neoblast-enriched transcripts is plotted logarithmically in fold change vs RPKM. A group of well-characterized conserved stem cell/neoblast markers, including ago2-1, vlg-3, and fgfrA, listed in Table 1, is highlighted by open symbols. (C) Confocal sections of sporocysts 24 hr post-transformation showing the expression of various conserved neoblast genes which overlap with the expression of cell cycle-associated transcripts. From top to bottom: mago nashi homolog (Smp_103470), far upstream (fuse) binding protein (Smp_044550), nucleosome assembly protein (nap, Smp_023530), adenosylhomocysteinase (ahcy, Smp_028440), pescadillo related gene (Smp_055800), and p30 dbc protein (Smp_193440). DOI: http://dx.doi.org/10.7554/eLife.00768.005
Figure 3.
Figure 3.. ago2-1 and vlg-3 are expressed in proliferative germinal cells.
(A) Top: confocal sections showing colocalization of ago2-1 and PCNA by FISH in sporocysts 24 hr post-transformation. Bottom: cells expressing ago2-1 incorporate EdU after a pulse 48–72 hr post-transformation. (B) vlg-3 is co-expressed with the cell cycle-associated transcript, H2A (top), and vlg-3 is expressed in cells that incorporate EdU following a pulse at 48–72 hr post-transformation (1254 vlg-3+ EdU+/1362 EdU+ cells) (bottom). Arrowheads indicate proliferating Bge cells; asterisks indicate mitotic cells. Scale bars are 20 µm. DOI: http://dx.doi.org/10.7554/eLife.00768.007
Figure 3—figure supplement 1.
Figure 3—figure supplement 1.. SmAGO2-1 is homologous to PIWI and AGO2 proteins, and SmNANOS2 is homologous to NANOS proteins.
The alignments are shown with respect to homologs of Drosophila melanogaster (Dm), Mus musculus (Mm), and planarian Schmidtea mediterranea (SMED) proteins. (A) PIWI domains. (B) Nanos RNA-binding domains. Blue: conserved residues, red: divergent residues. DOI: http://dx.doi.org/10.7554/eLife.00768.008
Figure 4.
Figure 4.. ago2-1, vlg-3, and nanos-2 expression identifies heterogeneity in the germinal cell population.
(A) FISH to detect nanos-2 and ago2-1 mRNA in EdU-labeled parasites. Relative to the nanos-2 germinal cells, nanos-2+ cells require longer time periods to incorporate EdU. Germinal cells are defined as ago2-1+ cells. The open arrowheads indicate nanos-2+ cells that are EdU, whereas filled arrowheads point to those that are EdU+. Times for EdU pulses are indicated in figures. (B) FISH to detect nanos-2 and vlg-3 mRNA. Scale bars are 20 µm. (C) The ratio between nanos-2 and nanos-2+ germinal cells increases with time after transformation. (D) Fractions of cells that incorporate EdU after pulses of various lengths. All EdU pulses start at 20 hr post-transformation, and the end times are indicated in the parentheses along the x-axis. DOI: http://dx.doi.org/10.7554/eLife.00768.009
Figure 5.
Figure 5.. vlg-3 and ago2-1 are required for germinal cell maintenance and proliferation.
(A) Timeline for RNAi experiments; EdU was added to the culture at 20–40 hr post-transformation. (B) Average number of EdU+ nuclei per sporocyst in control, ago2-1 (RNAi), and vlg-3 (RNAi) experiments. (C) Representative confocal stacks showing EdU incorporation after RNAi. Arrowheads indicate proliferating Bge cells; asterisk indicates an EdU+ mitotic cell. (D) Relative gene expression levels measured by qPCR for control and RNAi sporocysts, both in biological triplicate. The white bars indicate the genes targeted by RNAi. Error bars represent standard deviations. **p<0.01, ***p<0.001, ****p<0.0001 (t-test). (EF) FISH to detect nanos-2 and ago2-1 expression after vlg-3 RNAi (E), and nanos-2 and vlg-3 expression after ago2-1 RNAi (F). In (E), non-specific binding of probes to the Bge cells illustrates the background levels (arrowheads). The expression patterns in control RNAi animals are unchanged. Scale bars are 20 µm. DOI: http://dx.doi.org/10.7554/eLife.00768.010
Figure 6.
Figure 6.. fgfrA is required for germinal cell proliferation.
(A) Relative expression levels of fgfrA during sporocyst development with respect to the expression in miracidia, measured by qPCR. (B) Average number of EdU+ nuclei per sporocyst in control and fgfrA (RNAi) parasites labeled at 20–40 hr post-transformation. (C) Relative gene expression levels measured by qPCR for control and fgfrA (RNAi) sporocysts. The white bar indicates efficient knockdown of fgfrA by RNAi. qPCR experiments were performed in biological triplicate. Error bars are standard deviations. ***p<0.001, ****p<0.0001 (t-test). DOI: http://dx.doi.org/10.7554/eLife.00768.011

Comment in

Similar articles

Cited by

References

    1. Basch PF. 1981. Cultivation of Schistosoma mansoni in vitro. I. Establishment of cultures from cercariae and development until pairing. J Parasitol 67:179–85. 10.2307/3280632 - DOI - PubMed
    1. Basch PF, DiConza JJ. 1974. The miracidium-sporocyst transition in Schistosoma mansoni: surface changes in vitro with ultrastructural correlation. J Parasitol 60:935–41. 10.2307/3278518 - DOI - PubMed
    1. Berriman M, Haas BJ, LoVerde PT, Wilson RA, Dillon GP, Cerqueira GC, et al. 2009. The genome of the blood fluke Schistosoma mansoni. Nature 460:352–8. 10.1038/nature08160 - DOI - PMC - PubMed
    1. Bixler LM, Lerner JP, Ivanchenko M, McCormick RS, Barnes DW, Bayne CJ. 2001. Axenic culture of Schistosoma mansoni sporocysts in low O2 environments. J Parasitol 87:1167–8. 10.1645/0022-3395(2001)087[1167:ACOSMS]2.0.CO;2 - DOI - PubMed
    1. Boyle JP, Wu XJ, Shoemaker CB, Yoshino TP. 2003. Using RNA interference to manipulate endogenous gene expression in Schistosoma mansoni sporocysts. Mol Biochem Parasitol 128:205–15. 10.1016/S0166-6851(03)00078-1 - DOI - PubMed

Publication types