

Performance evaluation of three continuous glucose monitoring systems: comparison of six sensors per subject in parallel
- PMID: 23911165
- PMCID: PMC3879748
- DOI: 10.1177/193229681300700406
Performance evaluation of three continuous glucose monitoring systems: comparison of six sensors per subject in parallel
Abstract
Background: This study is aimed at comparing the performance of three continuous glucose monitoring (CGM) systems following the Clinical and Laboratory Standards Institute's POCT05-A guideline, which provides recommendations for performance evaluation of CGM systems.
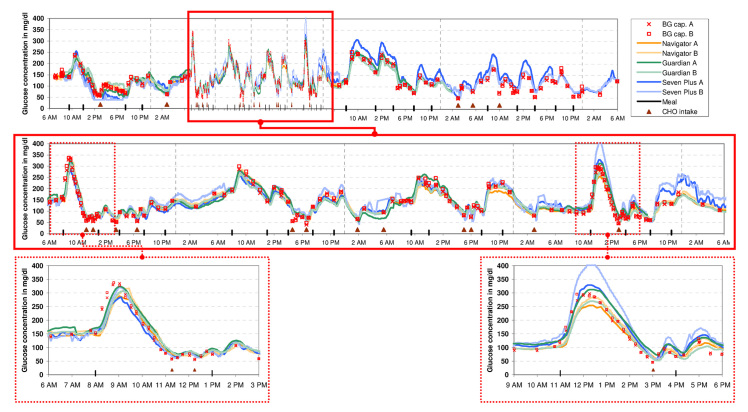
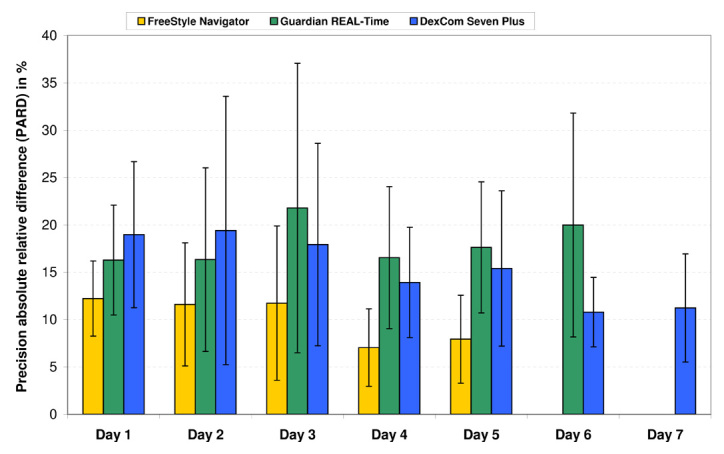
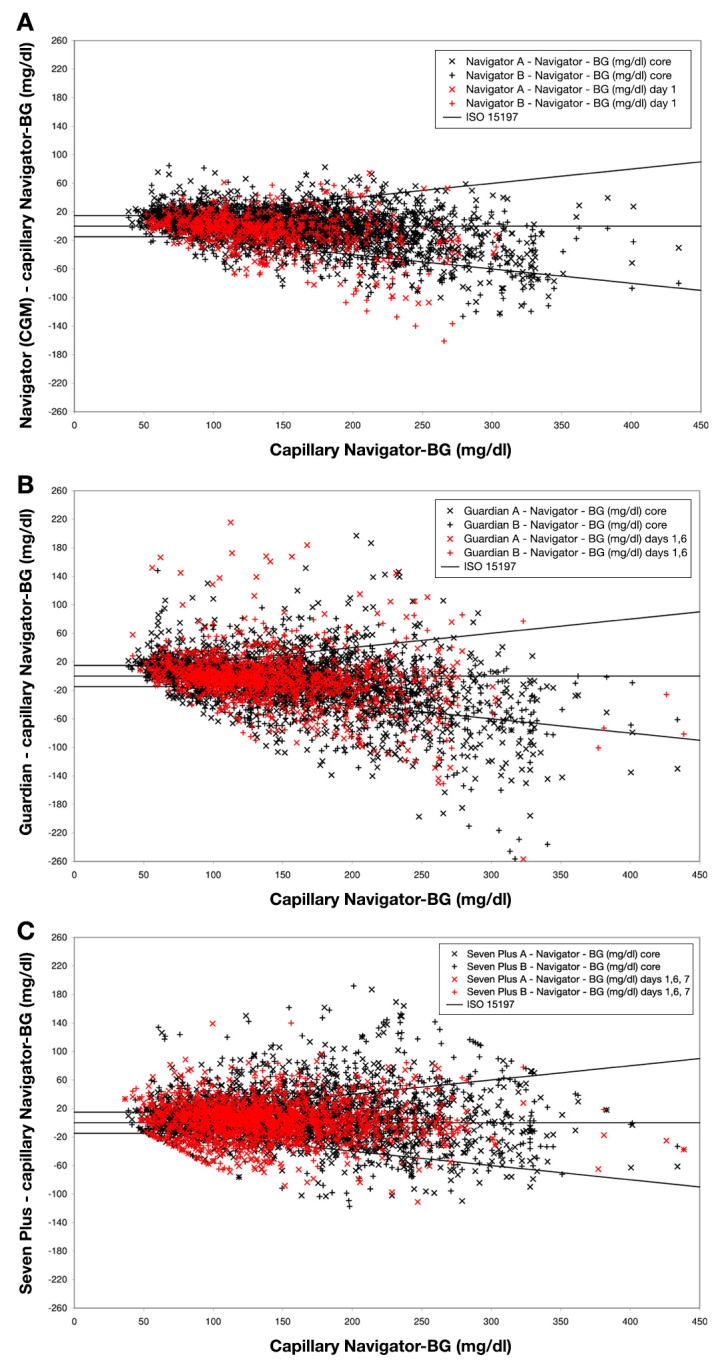
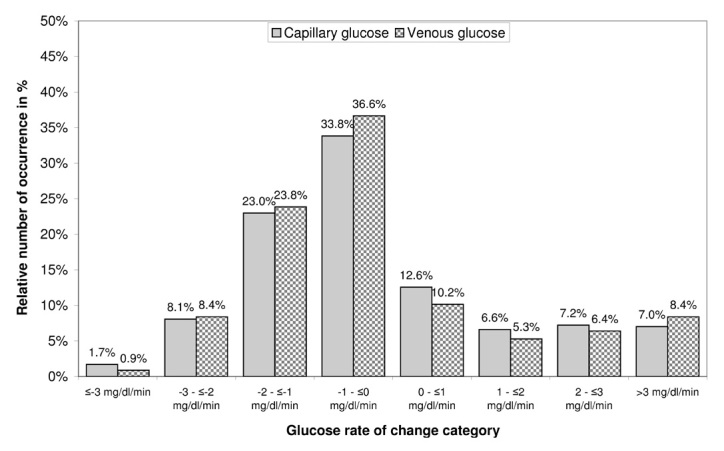
Methods: A total of 12 subjects with type 1 diabetes were enrolled in this study. Each subject wore six CGM systems in parallel, two sensors of each CGM system [FreeStyle Navigator™ (Navigator), MiniMed Guardian® REAL-Time with Enlite sensor (Guardian), DexCom™ Seven® Plus 3rd generation (Seven Plus)]. Each sensor was used for the lifetime specified by the manufacturer. To follow POCT05-A recommendations, glucose excursions were induced on two separate occasions, and venous and capillary blood glucose (BG) concentrations were obtained every 15 min for five consecutive hours. Capillary BG concentrations were measured at least once per hour during the day and once at night. Parameters investigated were CGM-to-BG differences [mean absolute relative difference (MARD)] and sensor-to-sensor differences [precision absolute relative difference (PARD)].
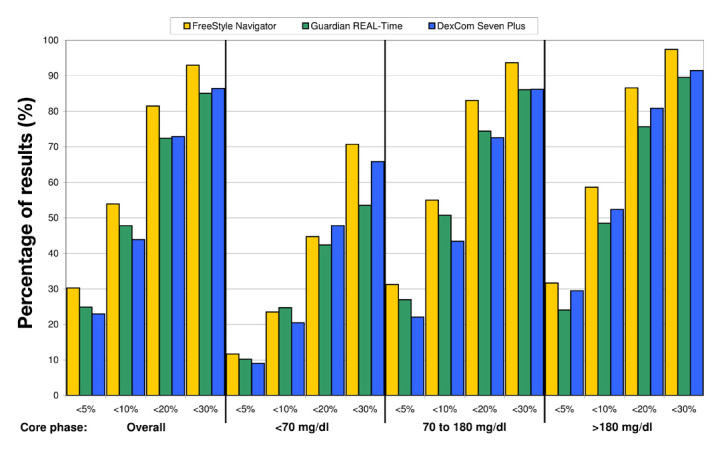
Results: Compared with capillary BG reference readings, the Navigator showed the lowest MARD, with 12.1% overall and 24.6% in the hypoglycemic range; for the Guardian and the Seven Plus, MARD was 16.2%/34.9% and 16.3%/32.7%, respectively. PARD also was lowest for the Navigator (9.6%/9.8%), followed by the Seven Plus (16.7%/25.5%) and the Guardian (18.1%/20.2%). During induced glucose excursions, MARD between CGM and BG was, again, lowest for the Navigator (14.3%), followed by the Seven Plus (15.8%) and the Guardian (19.2%).
Conclusions: In this study, two sensors of each of the three CGM systems were compared in a setting following POCT05-A recommendations. The Navigator CGM system achieved more accurate results than the Guardian or the Seven Plus with respect to MARD and PARD. Performance in the hypoglycemic range was markedly worse for all CGM systems when compared with BG results.
© 2013 Diabetes Technology Society.
Figures
References
-
- Clinical and Laboratory Standards Institute Performance metrics for continuous interstitial glucose monitoring; approved guideline. http://shopping.netsuite.com/c.1253739/site/Sample_pdf/POCT05A__sample.pdf . Accessed June 14, 2013.
-
- Clarke WL, Anderson S, Farhy L, Breton M, Gonder-Frederick L, Cox D, Kovatchev B. Evaluating the clinical accuracy of two continuous glucose sensors using continuous glucose-error grid analysis. Diabetes Care. 2005;28(10):2412–2417. - PubMed
-
- Weinstein RL, Schwartz SL, Brazg RL, Bugler JR, Peyser TA, McGarraugh GV. Accuracy of the 5-day FreeStyle Navigator Continuous Glucose Monitoring System: comparison with frequent laboratory reference measurements. Diabetes Care. 2007;30(5):1125–1130. - PubMed
-
- Mastrototaro J, Shin J, Marcus A, Sulur G. STAR 1 Clinical Trial Investigators. The accuracy and efficacy of real-time continuous glucose monitoring sensor in patients with type 1 diabetes. Diabetes Technol Ther. 2008;10(5):385–390. - PubMed
Publication types
MeSH terms
Substances
LinkOut - more resources
Full Text Sources
Other Literature Sources
Medical
