. 2013 Aug 1;154(3):505-17.
doi: 10.1016/j.cell.2013.07.005.

AMPD2 regulates GTP synthesis and is mutated in a potentially treatable neurodegenerative brainstem disorder

Affiliations

AMPD2 regulates GTP synthesis and is mutated in a potentially treatable neurodegenerative brainstem disorder

Naiara Akizu et al. Cell. .

Abstract

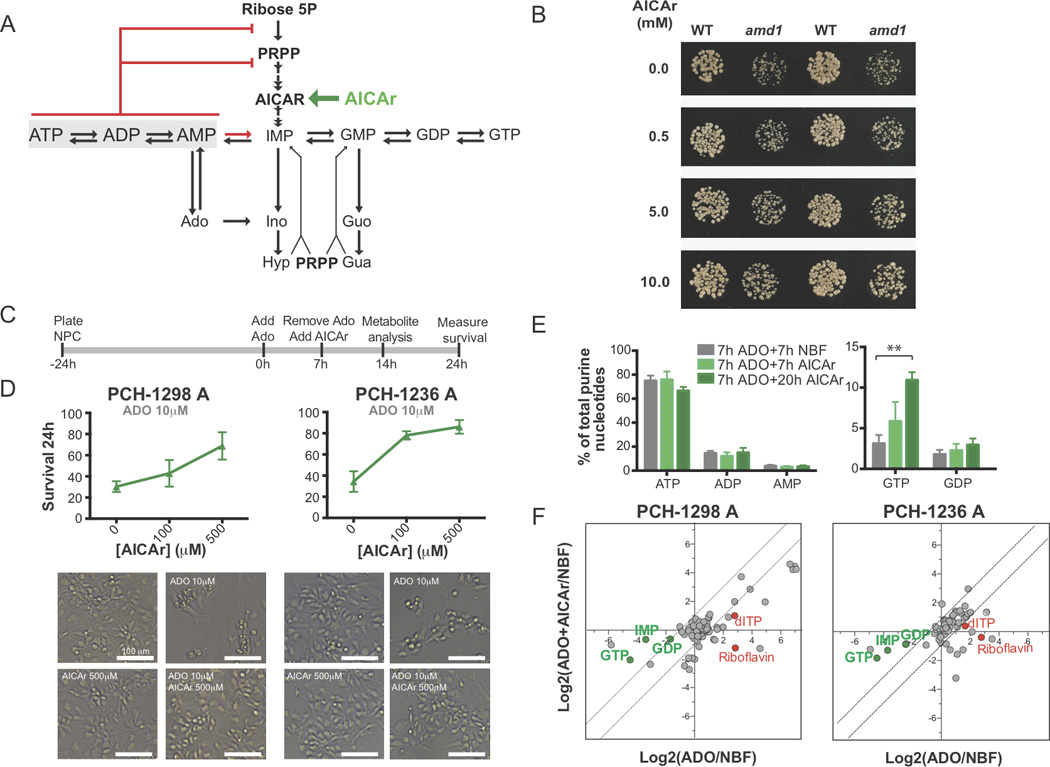
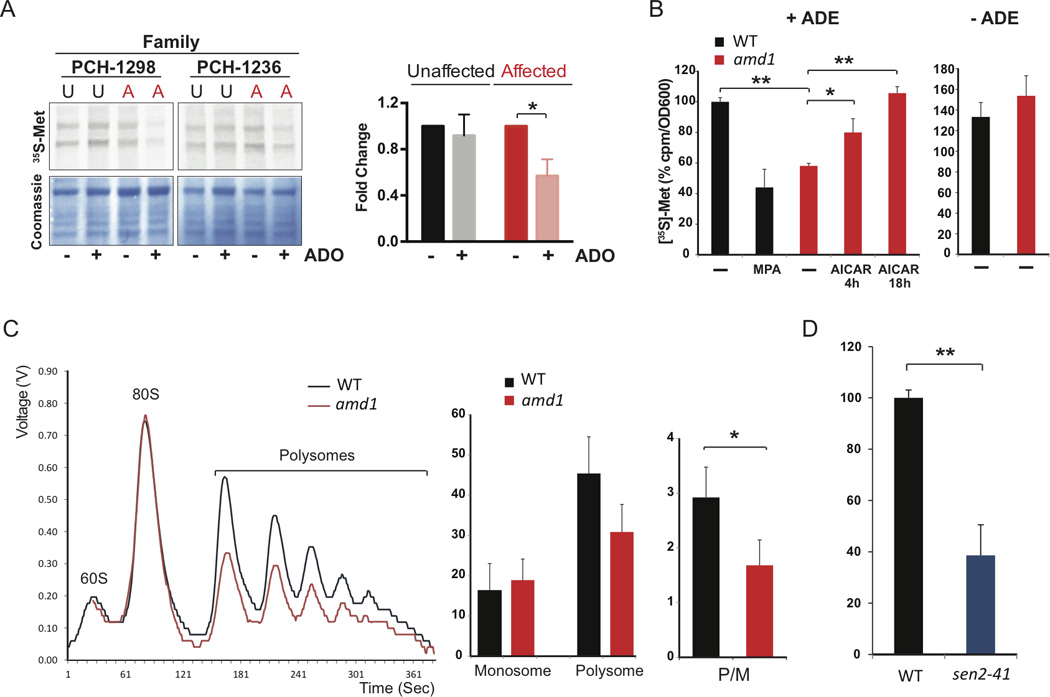
Purine biosynthesis and metabolism, conserved in all living organisms, is essential for cellular energy homeostasis and nucleic acid synthesis. The de novo synthesis of purine precursors is under tight negative feedback regulation mediated by adenosine and guanine nucleotides. We describe a distinct early-onset neurodegenerative condition resulting from mutations in the adenosine monophosphate deaminase 2 gene (AMPD2). Patients have characteristic brain imaging features of pontocerebellar hypoplasia (PCH) due to loss of brainstem and cerebellar parenchyma. We found that AMPD2 plays an evolutionary conserved role in the maintenance of cellular guanine nucleotide pools by regulating the feedback inhibition of adenosine derivatives on de novo purine synthesis. AMPD2 deficiency results in defective GTP-dependent initiation of protein translation, which can be rescued by administration of purine precursors. These data suggest AMPD2-related PCH as a potentially treatable early-onset neurodegenerative disease.


Figures

Figure 1
Figure 1. Recessive mutations in AMPD2 cause loss of brainstem and cerebellar structures, typical of PCH
(A) Brain MRI from one of the affected patients for each PCH family. Control child brain MRIs are from pediatric brain atlas (http://www.seattlechildrens.org/healthcare-professionals/education/radiology/pediatricbrainatlas/). Upper: midline sagittal MRI, Lower: axial MRI at optic chiasm level. Images show smaller cerebellum (red arrowhead) and brainstem hypoplasia (red arrow) typical of PCH in all patients compared with the control. All patients show near complete absence of the corpus callosum. All patients show typical “Figure 8” shape of the brainstem (red circle). Corresponding mutation in cDNA (c) and protein (p) is below each scan. Fs: frame shift; *: stop codon. (B) Schematic representation of three AMPD2 isoforms. Mutations indicated relative to their position in cDNA. (C) Mutated amino acids in PCH are fully conserved. See also Figure S1 and Table S1.
Figure 2
Figure 2. Mutations in AMPD2 cause protein instability and loss of protein function
(A) Phylogenic tree representing yeast, mouse and human AMP deaminase proteins. (B) 10-fold serial dilutions (left to right) of WT or amd1 yeast strains transformed with yeast AMD1 or human AMPD2 gene on adenine-supplemented media. Yeast amd1 mutant growth restriction is relieved by either yeast AMD1 or human AMPD2 forced-expression. (C) 10-fold serial dilutions of amd1 mutant yeast transformed with tetracycline-regulated expression of AMD1 WT or corresponding human mutations on adenine-supplemented media in presence of 0.1µg/ml of doxycycline. Forced expression of WT but not patient mutations rescues growth restriction. (D) Immunoblot analysis of AMPD2 levels in affected (A) and unaffected (U) fibroblasts. GAPDH is shown as loading control. Affecteds show absent or near-absent AMPD2. Corresponding AMPD2 mutations listed below each family. (E) Reduced AMP deaminase activity in affected (A) compared with related unaffected (U) fibroblasts, measured by standard colorimetric AMP deaminase assay. Upper: blue intensity represents relative activity. Lower: quantification of activity ±SD for three independent experiments. *P<0.05: **P<0.005. Student’s t-test. See also Figure S2.
Figure 3
Figure 3. Adenosine supplementation reduces viability of AMPD2 deficient patient-derived cells
(A) Schematic of nucleotide metabolic pathway. Red arrow: enzymatic reaction catalyzed by AMPD2, mutated in PCH patients (red). Ado, adenosine; Gua, guanine; Guo, guanosine: Ino, inosine: Hyp, hypoxanthine: PRPP, Phosphoribosyl pyrophosphate (B) Survival of unaffected and affected fibroblasts from families PCH-1298 and PCH-1236, cultured with escalating adenosine concentrations for 72h. Mean ±SD (four independent replicates). (C) Bright field images for affected PCH-1298 and PCH-1236 fibroblasts in standard medium or 50µM adenosine supplemented medium, documenting modest drop in survival. (D) Bright field images for PCH-1298 and PCH-1236 unaffected and affected derived induced pluripotent stem cells (iPSC) and neural rosettes (NR). PAX6 (green) and NESTIN (red) immunostaining in neural progenitor cells (NPCs), corresponding to one unaffected and one affected clone per family. (E) Survival rates of unaffected and affected NPCs from families PCH-1298 and PCH-1236, cultured with escalating adenosine concentrations for 72h, showing 10-fold increase sensitivity to adenosine concentrations of NPCs compared with fibroblasts. Mean ±SD (three clones assayed at least in quadruplicates). (F) Bright field images for affected PCH-1298 and PCH-1236 NPCs in standard medium or 10µM adenosine supplemented medium, documenting severely reduced survival. See also Figure S3 and Table S2.
Figure 4
Figure 4. Adenosine supplementation induces adenosine nucleotide accumulation and severe guanine nucleotide depletion in AMPD2-mutant patient cells
(A–D) Percentage of adenosine (A, C) or guanine (B, D) nucleotide levels measured by HPLC in affected and unaffected fibroblasts or NPCs cultured with or without adenosine for 5h. Gray: Unaffected, Red: Affected. Mean ±SD (0µM ADO n=4; 50µM ADO n=2). *P<0.05, **P<0.0005; student’s t-test. (E) Graphical representation of LC-MS/MS data. Concentrations were used to calculate the fold change (FC) of each metabolite in 10µM vs. 0µM adenosine treatment, represented in log scale. Average log2(FC) for two affected clones in family PCH-1298 (top) and family PCH-1236 (bottom) (y-axis) and two unaffected clones (x-axis) from family PCH-1298. Dashed lines: arbitrarily defined correlation threshold. Red dots: metabolites outside the threshold limits that significantly change in affecteds and are more reduced than in unaffected (U). Guanine nucleotides and IMP are consistently reduced (red) in affected (A) NPCs. See also Figure S4, Table S3 and S4
Figure 5
Figure 5. AMP deaminase deficiency is associated with postnatal neurodegeneration and altered nucleotide levels in mouse
(A) Parasagittal cresyl-violet sections from WT, Ampd2 KO and Ampd2/3 DKO at P20. Smaller size of the Ampd2/3 DKO whole brain (upper panels) and cerebellum (middle panels) is evident. Cerebellar lobules labeled with roman numerals. Cell loss visible in the CA3 region of the hippocampus in the Ampd2/3 DKO (lower panels, arrowheads). Scale bar, 0.5mm. (B) qPCR of Ampd2 and Ampd3 normalized with Actin as loading control. Fb: forebrain; Hb: hindbrain; Cb: cerebellum; Ctx: cortex. E: embryonic day; P: postnatal day. Mean ±SD of three replicates. (C) AMP deaminase activity from WT, Ampd2 KO and Ampd3 KO in brain, liver and heart. Ampd2 KO and Ampd3 KO conserve about half of WT AMP deaminase activity in brain. Mean ±SD of four replicates. *P<0.05, **P<0.0005; student’s t-test. (D) Kaplan-Meier survival curve of Ampd2/3 DKO compared to Ampd2 KO, Ampd3 KO and WT. Mean of Ampd2/3 DKO survival is 17.8±0.5 days. (E) Parasagittal H&E sections from WT and Ampd2/3 DKO at P15. Scattered eosinophilic neurons are visible in the hippocampus (upper panels, arrowheads) and in the Purkinje cell layer of the cerebellum (lower panels) of DKOs. Insets: Higher-magnification of pyknotic cells (dark staining). GC: cerebellar granule cell; PCL: Purkinje cell layer. Scale bar, 0.5mm. (F) Whole brain nucleotide levels in P14 brains from the four genotypes. ATP levels were significantly increased (26%) and GTP significantly decreased (33%) in Ampd2/3 DKO. See also Movie S1
Figure 6
Figure 6. AICAr treatment restores cell growth in yeast and viability in patient NPCs
(A) Schematic of purine nucleotide metabolic pathway highlighting the inhibitory effect of adenosine nucleotides on de novo synthesis pathway (red) and the metabolic route for AICAr (green) in AMPD2 deficient cells. (B) Culture of identical concentration of WT and amd1 yeast cells in presence of adenine, demonstrating rescue of growth defects upon increasing AICAr concentration. (C) Schematic of AICAr rescue experimental protocol in human NPCs. Adenosine was added at time 0h then washed out at 7h and replaced with AICAr. Metabolites and survival were analyzed at 14h and 24h respectively. (D) Improved survival of affected NPCs treated with increasing AICAr concentrations. Graph represents mean ±SD from two clones assayed at least in quadruplicates. Lower panels: bright field images of cells demonstrating increase in cell survival upon AICAr treatment. (E) Percentage of adenosine (A) or guanine (B) nucleotide levels measured by HPLC in affected NPCs, cultured in adenosine for 7h followed by standard medium (NBF) or AICAr 500 µM. Data is compared to 7h adenosine + 7h standard medium to minimize the contamination from non-viable NPCs in longer cultures. GMP was non-detectable under all conditions and is thus not shown. Mean ±SD for three clones derived from PCH-1298 and PCH-1236 family affected NPCs. **P<0.005 student’s t-test. (F) Graphical representation of LC-MS/MS data. Concentrations were used to calculate the fold change (FC) of each metabolite in 10µM adenosine+standard medium (NBF) (x-axis) or 10µM adenosine+500µM AICAr (y-axis) vs. NBF. Average log2(FC) for two affected (A) clones from each family PCH-1298 (left) and family PCH-1236 (right). Dashed lines: arbitrarily defined correlation threshold. Green and red dots: metabolites outside the threshold limits that significantly increase (green) or decrease (red) with AICAr. Guanine nucleotides and IMP are significantly higher in affected NPCs that receive AICAr for 7h after adenosine challenge. Metabolites outside the graph scale are not represented (i.e. AICAr). See also Figure S5 and Table S5.
Figure 7
Figure 7. AMPD2 deficiency results in translation initiation blocking
(A) Metabolic labeling with [35S]-Methionine of NPCs shows reduced incorporation in affecteds (A) compared with unaffecteds (U) in presence of adenosine (+: 10µM for 5h). Upper panel: [35S] autoradiogram. Lower panel: Coomassie staining. Graph: autoradiogram quantification normalized for total protein for three NPC clones. (B) Metabolic labeling with [35S]-Methionine of yeast cells grown in SD-CASA media supplemented with adenine. Mycophenolyc acid (MPA 30µg/ml, inhibits guanine nucleotide synthesis) used as positive control. A decrease of 41% in the rate of incorporation of [35S]-Methionine in amd1 strain is rescued by AICAr incubation prior to metabolic labeling in a time-dependent fashion, whereas no difference was detected in the absence of adenine (right) (C) Representative polysome profiles of WT and amd1 mutant strains grown with adenine. Polysome (P) and monosome (M; 80S peak) profiles were quantified from three independent experiments. Polysome to monosome ratio (P/M) suggests a defect in protein translation initiation (right). (D) Metabolic labeling with [35S]-Methionine of WT and sen2-41 mutant at non permissive temperature. *P<0.05; **P<0.0005, student’s t-test, all graphs show mean ±SD

References

    1. Alfonzo JD, Sahota A, Taylor MW. Purification and characterization of adenine phosphoribosyltransferase from Saccharomyces cerevisiae. Biochim Biophys Acta. 1997;1341:173–182. - PubMed
    1. Archer S, Juranka PF, Ho JH, Chan VL. An analysis of multiple mechanisms of adenosine toxicity in baby hamster kidney cells. J Cell Physiol. 1985;124:226–232. - PubMed
    1. Barth PG. Pontocerebellar hypoplasias. An overview of a group of inherited neurodegenerative disorders with fetal onset. Brain Dev. 1993;15:411–422. - PubMed
    1. Bausch-Jurken MT, Mahnke-Zizelman DK, Morisaki T, Sabina RL. Molecular cloning of AMP deaminase isoform L. Sequence and bacterial expression of human AMPD2 cDNA. J Biol Chem. 1992;267:22407–22413. - PubMed
    1. Budde BS, Namavar Y, Barth PG, Poll-The BT, Nurnberg G, Becker C, van Ruissen F, Weterman MA, Fluiter K, te Beek ET, et al. tRNA splicing endonuclease mutations cause pontocerebellar hypoplasia. Nat Genet. 2008;40:1113–1118. - PubMed

Publication types

MeSH terms

Associated data