. 2013 Aug 1;154(3):530-40.
doi: 10.1016/j.cell.2013.07.007.

Cooperativity and rapid evolution of cobound transcription factors in closely related mammals

Affiliations

Cooperativity and rapid evolution of cobound transcription factors in closely related mammals

Klara Stefflova et al. Cell. .

Abstract

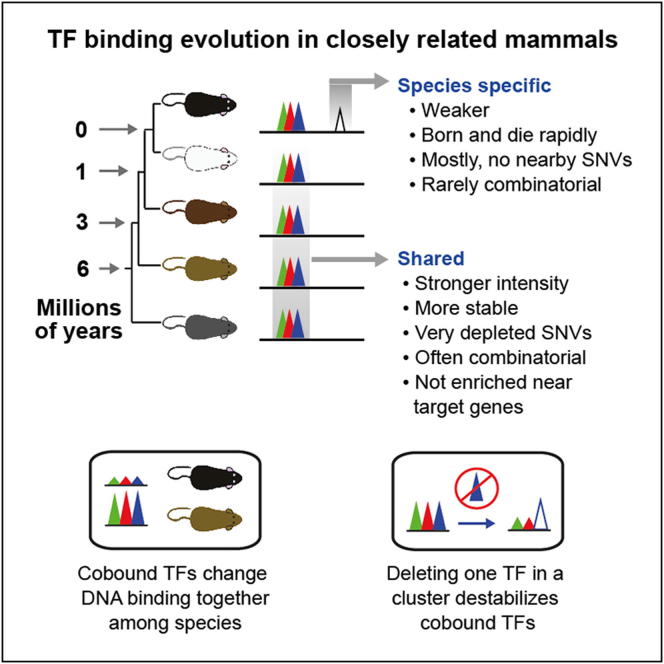
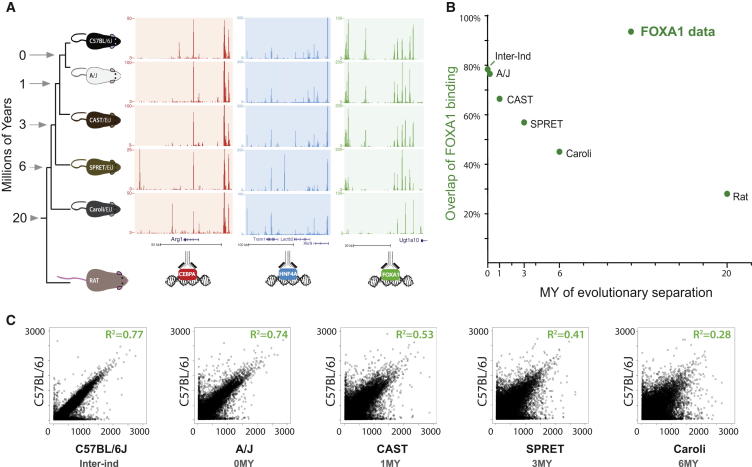
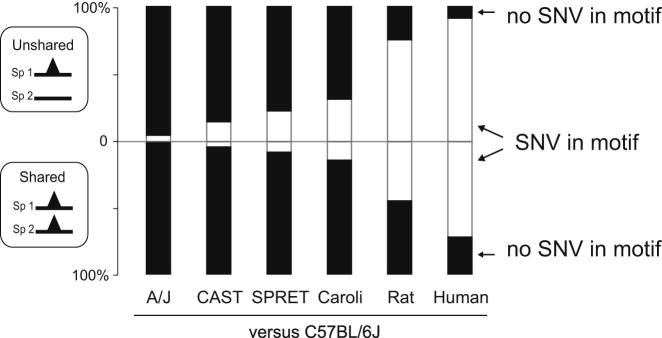
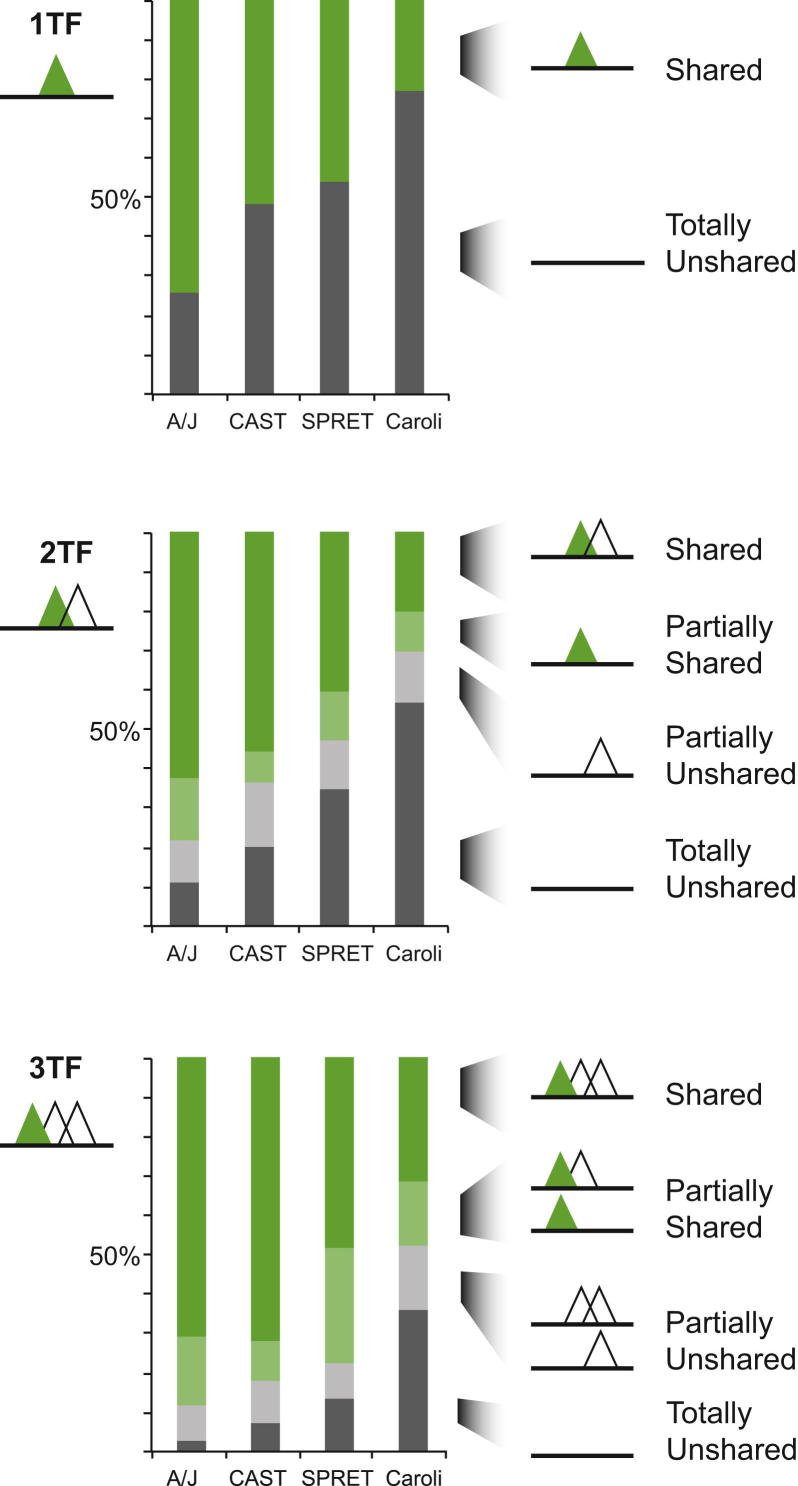
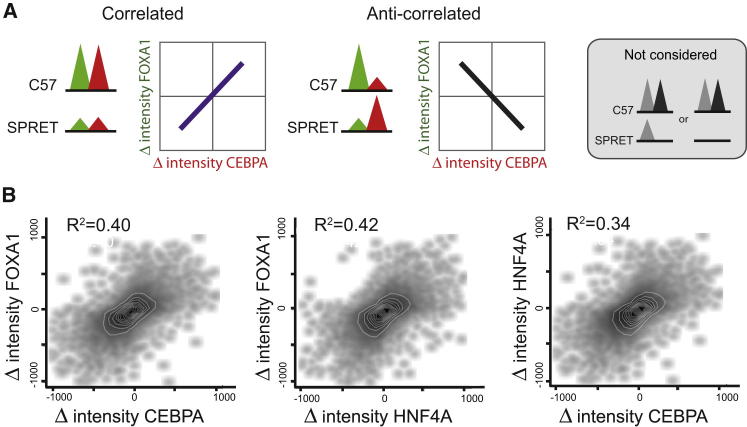
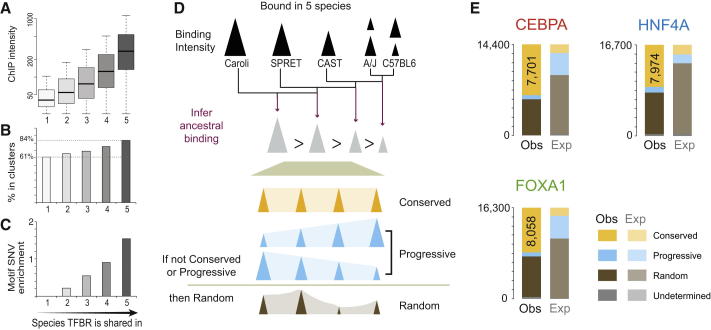
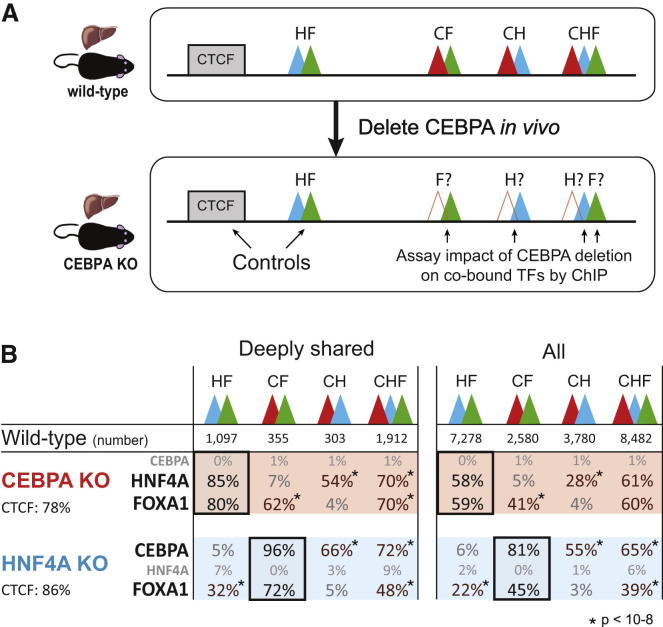
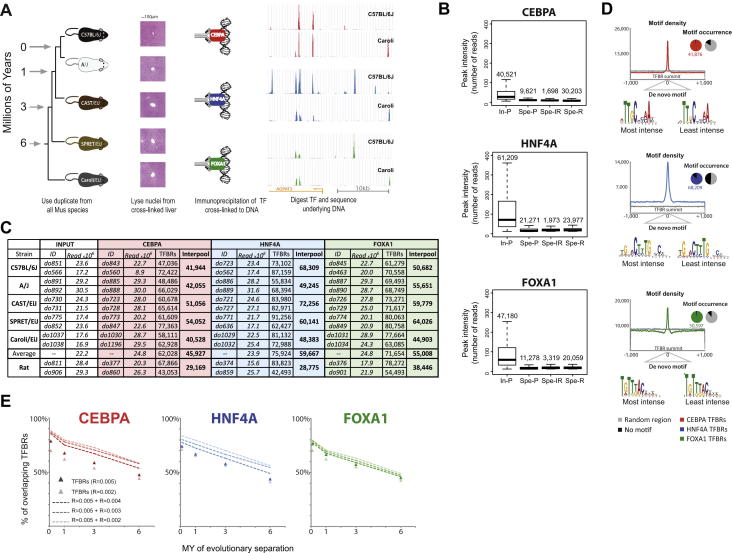
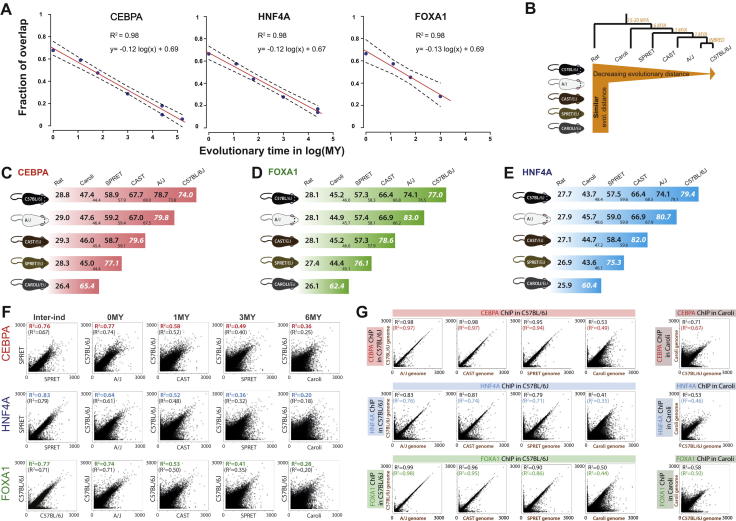
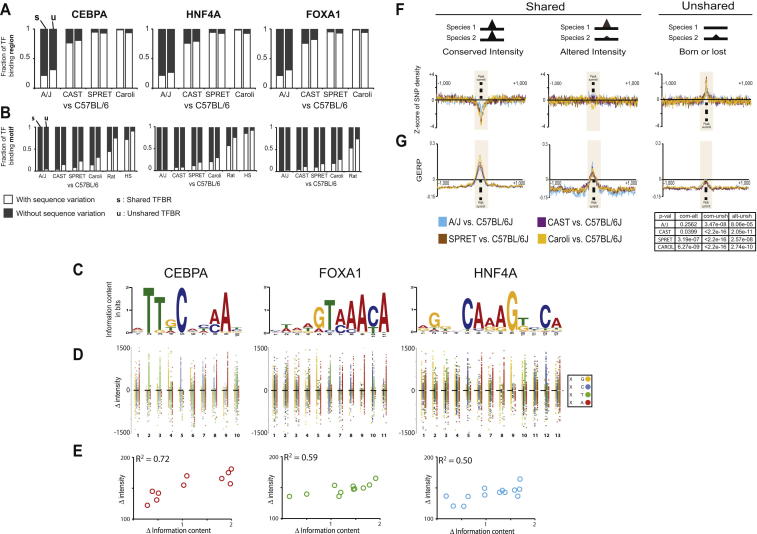
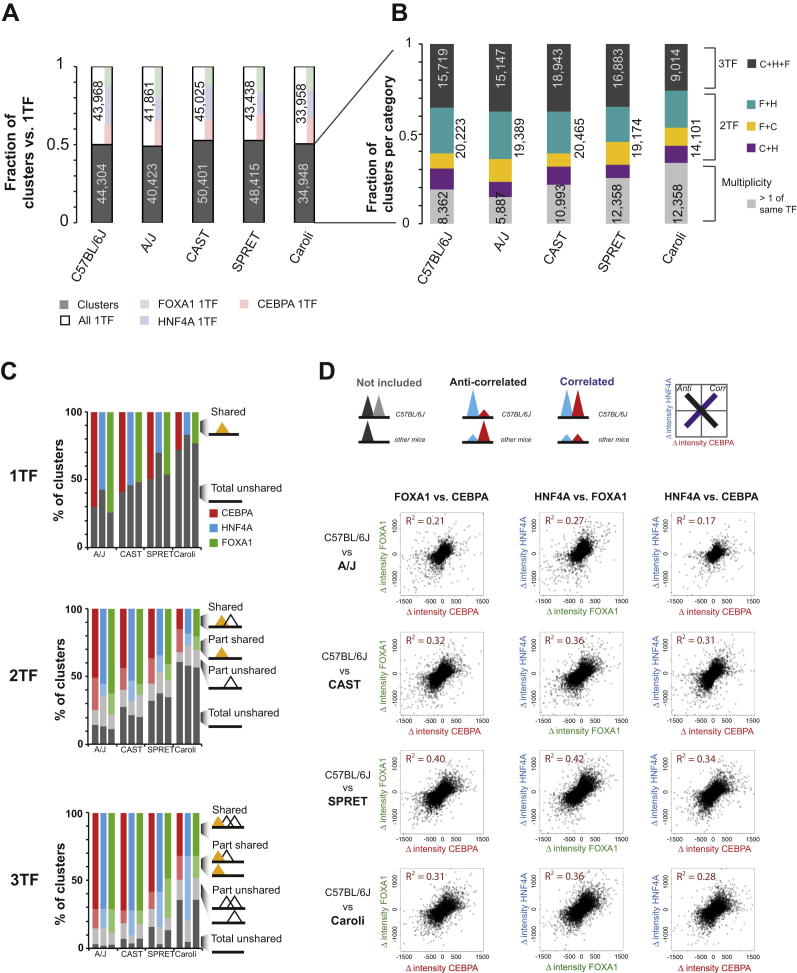
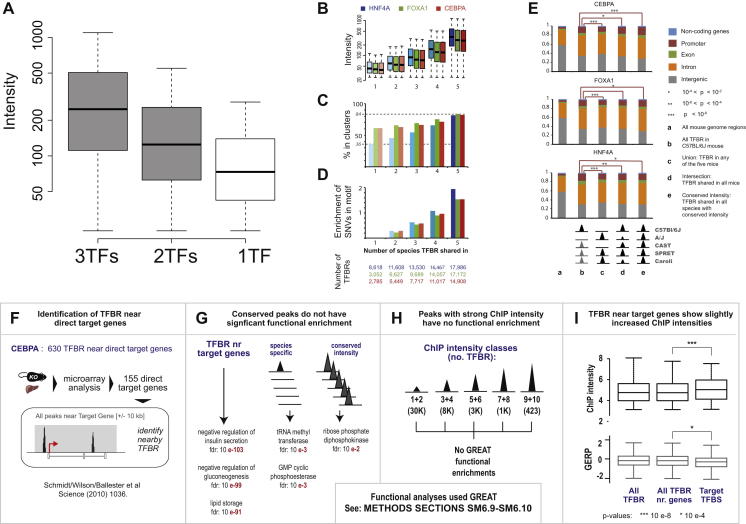
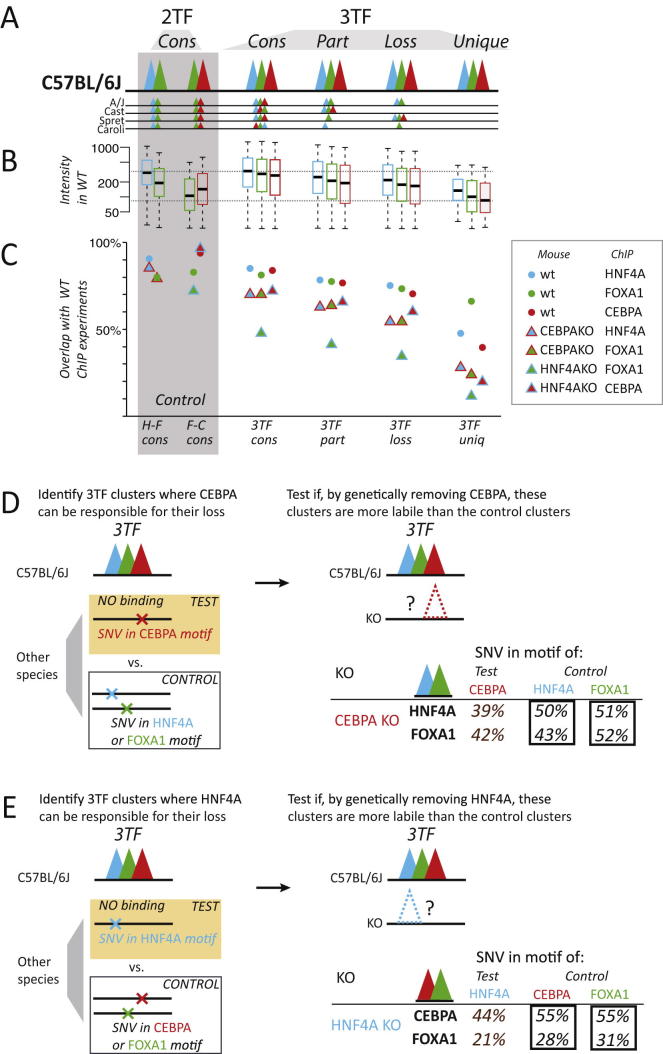
To mechanistically characterize the microevolutionary processes active in altering transcription factor (TF) binding among closely related mammals, we compared the genome-wide binding of three tissue-specific TFs that control liver gene expression in six rodents. Despite an overall fast turnover of TF binding locations between species, we identified thousands of TF regions of highly constrained TF binding intensity. Although individual mutations in bound sequence motifs can influence TF binding, most binding differences occur in the absence of nearby sequence variations. Instead, combinatorial binding was found to be significant for genetic and evolutionary stability; cobound TFs tend to disappear in concert and were sensitive to genetic knockout of partner TFs. The large, qualitative differences in genomic regions bound between closely related mammals, when contrasted with the smaller, quantitative TF binding differences among Drosophila species, illustrate how genome structure and population genetics together shape regulatory evolution.


Figures

None
Graphical abstract
Figure 1
Figure 1
Rate of Accumulation of TF Binding Occupancy Differences between Closely Related Mammals within One Order (A) To assess the rate at which TF binding differences accumulate, we identified and compared the global in vivo binding of FOXA1, CEBPA, and HNF4A in livers of six closely related rodents ranging in evolutionary separation from 1 to 20 MY. Examples of both shared and species-specific TF binding locations are indicated at representative loci. (B) The fraction of FOXA1 binding found at homologous locations when comparing C57BL/6J and other rodent species (y axis) is plotted against the evolutionary distance between species in millions of years (x axis). (C) FOXA1 binding intensities were compared across the entire genome within and between mouse species. TF binding profiles between individuals within the same species (C57BL/6J) showed a high correlation (green inset, R2 = 0.77), which decreased with increasing evolutionary distance. See also Figures S1 and S2.
Figure 2
Figure 2
Evolutionary Differences in TF Binding Cannot Be Explained Purely by Genetic Variation in Directly Bound Sequence Motifs We categorized CEBPA binding events by whether they were unshared (top bar chart) or shared (bottom bar chart) between C57BL/6J and a second species. We then identified whether the directly bound motif is identical (black shaded) or contains genetic variation (white shaded). Variation increased with evolutionary distance; unshared binding events had SNVs in their bound genetic sequences at a slightly higher frequency (p < 2.2 × 10−16 with Fisher’s exact test). The vast majority of peaks do not have genetic sequence variations within their directly bound motifs; importantly, this is true for unshared peaks where, for instance, less than a quarter of C57BL/6J peaks not found in SPRET/EiJ have variation from the C57BL/6J reference. See also Figure S3.
Figure 3
Figure 3
Regions Bound by Multiple TFs in C57BL/6J Are More Likely to Be Found in a Second Mouse Species The probability that FOXA1 (and/or its partners) will be lost depends on the TF binding neighborhood. FOXA1 binding occurring in isolation (1TF) is far more likely to be lost than binding events found in a TF binding cluster with two TFs (2TF) or three TFs (3TF); these cases represent loss of all factors simultaneously (labeled as totally unshared). See also Figure S4 for similar plots for CEBPA and HNF4A.
Figure 4
Figure 4
TF Binding Intensities Differ in a Positively Correlated Manner (A) For each pair of TFs, all regions that were cobound and shared between C57BL/6J and SPRET/EiJ were identified. Each scatterplot shows the change in intensity for one TF versus the second TF between these species. (B) Combinatorial TF binding intensities coevolve. The differences in TF binding intensities showed good correlation between different TFs, suggesting coordinate evolution. Comparisons of C57BL/6J with each of the other mouse species show similar results. See also Figure S4.
Figure 5
Figure 5
TF Binding Regions Shared in All Five Mice Often Show Higher and More Constrained Binding Intensity (A) The average intensity of TF binding increases with the number of species in which FOXA1 is bound. (B) FOXA1 binding regions shared among more species are more likely to be part of combinatorially bound regions. (C) The FOXA1 binding regions shared among more species are more likely to be robust to SNVs in the underlying FOXA1 motif. (D) The ancestral intensity for each TF binding region in the mouse genome at four ancestral nodes was inferred using parsimony and was used to establish whether TF binding intensity was conserved or monotonic during evolution. If neither model was matched, then binding regions were classified as evolving randomly. (E) The expected distribution of conserved, directionally changing, and randomly changing TF binding intensity over time was established by randomizing the intensities of each species’ bound regions. A few TFBRs fell outside this classification due to occasions of inherent ambiguity in inferring ancestral binding intensity; these are listed as undetermined. In comparison, observed in vivo TF binding data consistently showed depletion of directed evolution and strong enrichment of conserved binding intensities (p < 10−6). See also Figure S5.
Figure 6
Figure 6
Effect of Knocking Out CEBPA and HNF4A In Vivo on the Binding of the Remaining TFs in Cobound Clusters (A) Livers from a genetically engineered CEBPA KO mice were obtained, and ChIP experiments were performed against HNF4A and FOXA1 to evaluate the impact of CEBPA deletion on cobound TFs located in clusters ([HNF4A (H, blue), FOXA1 (F, green), and CEBPA (C, red)] and CTCF [a noninteracting partner, as a control]). Corresponding experiments were performed using HNF4A KO mice. (B) The effect of knocking out CEBPA and HNF4A was evaluated for the following cluster classes: 2TF clusters containing HNF4A and FOXA1 (HF), CEBPA and FOXA1 (CF), and CEBPA and HNF4A (CH) and finally, all three TFs (CHF). Two TF binding experiments served as controls in CEBPA and HNF4A KO mice: CTCF, which binds independently of tissue-specific TFs (Faure et al., 2012), and the 2TF clusters not containing the deleted factor (in darker black frames) because knocking out CEBPA should not affect the binding of HNF4A or FOXA1 found in HF clusters, and knocking out HNF4A should not affect CF clusters. The TF binding differences in WT versus KO show that genetically removing one of the TF found in a cluster destablizes the binding of cobound TFs. This effect is in almost all cases statistically significant and is observed for both deeply shared (left) and all (right) 2TF and 3TF clusters. See also Figure S6.
Figure S1
Figure S1
Quality Evaluation of the In Vivo TF Binding Data Assayed in Five Mouse Species, Related to Figure 1 (A) ChIP followed by high-throughput sequencing (ChIP-seq) of CEBPA, HNF4A and FOXA1 in C57BL/6J, A/J, CAST/EiJ, SPRET/EiJ, and Caroli/EiJ mice showing their phylogenetic relationship and H&E stained livers for each species. (B) Intensity distribution of peaks called for final TFBR sets in C57BL/6J: the Inter-pool (In-P)) compared to peaks present in the replicates but excluded from the final set by (i) pooling samples (Spe-P), (ii) overlapping inter-replicate with pool (Spe-IR) or (iii) combining replicates (Spe-R). (C) Summary table of genomic background (Input) and ChIP-seq data sets for CEBPA, HNF4A and FOXA1 duplicate in C57BL/6J, A/J, CAST/EiJ, SPRET/EiJ, and Caroli/EiJ, and rat included in the subsequent analysis. Listed are sequencing run identifiers, the number of reads sequenced, the number of peaks called by SWEMBL in both replicates, and the final number of TFBRs in the Inter-pool used for all downstream analyses. The average TFBR numbers for the five mouse species are also shown in a separate row. (D) Motif analysis of TFBRs in C57BL/6J mice. Motif density: The plot of cumulative motif density for all CEBPA, HNF4A, and FOXA1 TFBRs -/+ 1,000bp from the TFBR summit shows a distinct increase of motif density within ∼300bp around the summit for each TF (coded by color, as per Figure 1). This is in contrast to the density of each motif across 50,000 random regions (gray). Motif occurrence: In the 300bp region of high motif density around the TFBR summit, the motif occurrence is clearly higher for TFBRs compared to random 300bp region (pie charts). On average we can find motif in 99.1%, 89.2%, and 98.4% CEBPA, HNF4A, and FOXA1 TFBRs, respectively. De novo motif: We can find motif de novo in the 2,000 highest and lowest intensity TFBRs (+/−25bp around the summit), unlike for random genomic regions (data not shown). (E) When considering shadow regions (e.g., regions that are unbound in an anchor species but where in orthologous regions in different species TFs are bound), the overlap of TFBRs between pair of species anchored on C57BL/6J does not dramatically change with increasing leniency of peak calling, and closely follows the calculated rate of TFBRs divergence during evolution obtained using standard peak calling parameters, as per Figure 1B.
Figure S2
Figure S2
TF Binding Divergence across Closely Related Mouse Species, Related to Figure 1 (A) The rate of decay of TF binding overlap over 20-180 million years (MY) of evolution is linear when plotted as log of MY. C57BL/6J is used as a reference for calculating the overlap and evolutionary distance. In addition to our data spanning 6-20 MY, the comparison over 80-180 MY years additionally used data from Schmidt et al. (2010). Namely, for CEBPA we plotted the dog (80 MY of divergence), the human (80 MY of divergence) and the opossum (180 MY of divergence). For HNF4A we plotted only the overlap between C57BL/6J and dog and human. No additional data were available for FOXA1. The mouse strain A/J has been removed due to the incompatibility of the evolutionary distance from C57BL/6J (0 MY) and the logarithmic scale. (B) The fraction of overlapping TFBRs between five mouse species and a rat shows in vertical direction the overlap between similarly distant species (e.g., Rat versus C57BL/6J, A/J, CAST/EiJ, SPRET/EiJ, Caroli/EiJ in the first row) while in horizontal direction it follows the decreasing evolutionary distance. (C–E) The percentage of overlapping TFBRs between each pair of mouse species and rat for FOXA1 (D), HNF4A (E), and CEBPA (C) is robust to our choice of anchor species (the values in vertical line of the matrix are within ± 2 standard deviations). We see similar overlap if we consider only genomic regions that align between C57BL/6J and rat (the small print number at the bottom right of each overlap percentage), showing that the changes in TF binding are not solely accumulating in fast evolving Mus genomic regions. Far-right diagonal overlap in italics shows the proportion of TFBRs that overlap between two replicates from two individuals of the same species. (F) The correspondence of TFBR intensities between individuals is shown quantitatively by correlating two Inter-pools, each containing two biological replicates of SPRET/EiJ (for CEBPA, HNF4A) or C57BL/6J (for FOXA1), showing high correlation coefficients when we consider all TF binding regions (R2 in brackets) or only the overlapping TF binding regions (R2 in color, top left corner for each plot). This correlation of intensities decays with evolutionary distance, as shown by plotting the intensity for orthogonal TF binding regions in C57BL/6J and A/J, CAST/EiJ, SPRET/EiJ, and Caroli/EiJ. (G) The evolutionary decay of intensity correlation is not the result of a mapping bias. Correlation of the intensities of all TF binding regions from the same C57BL/6J ChIP-seq sample aligned either to its own genome (“C57BL/6J genome”) or to genomes of related mouse species, illustrates the most extreme effect of miscalling all SNVs on read alignment for CEBPA, HNF4A, and FOXA1. From left to right, these are all TF binding regions in C57BL/6J aligned to NCBI37 genome (its own “C57BL/6J genome”) versus A/J, CAST, SPRET and Caroli genomes. In addition, Caroli ChIP-seq sample is also aligned to Caroli versus C57BL/6J genome (far right). The R2 is based on Pearson correlation for overlapping and all TF binding regions (black and in color + brackets, respectively) and is listed in top left corner.
Figure S3
Figure S3
Correlation of TF Binding and Its Underlying Sequence Variation, Related to Figure 2 (A) Pairwise comparison of C57BL/6J and each other species identified the shared and unshared (respectively, s and u) TF bindings regions. Within each category, the TFBRs with sequence variation (in white) and without sequence variation (in black) within +/−150 nt around the peak summit are shown. (B) In pairwise comparisons as per (A), the TFBRs with sequence variation (in white) and without sequence variation (in black) in the central canonical motif for each TF are shown. (C) The logo representation of the position weighted matrix for each TF’s motif. (D) For CEBPA, FOXA1, and HNF4A, TF binding sites that had a SNV in the directly bound motif were collected. Each of these SNVs was plotted based on its location in the canonical motif (x axis), and the TF binding intensity difference with which it was associated (y axis). Each point was color-coded by the base occurring in C57BL/6J; for instance, a T in C57BL/6J is plotted as green (where in another species, the same base is A, G, or C), A in red, G in orange and C in blue. (E) The difference in TF binding intensity is correlated with the change in information content of the TF binding motif of CEBPA, HNF4A and FOXA1. (F) The distribution of Z-score of single nucleotide variation (SNV) density in a region of +/−1000 bp around the CEBPA summit is shown for the five mouse species. Compared to the background genome, the SNV densities between the genomes of C57BL/6J and A/J, CAST/EiJ, SPRET/EiJ or Caroli/EiJ are strongly depleted in the TF binding regions with conserved intensity, but similar for TF binding that varies in intensity, and strongly enriched for unshared TF binding. (G) The distribution of GERP scores (Genomic Evolutionary Rate Profiling) in a region of +/−1000 bp around CEBPA summits is shown for the five mouse species. Using this criteria, the TF binding regions with conserved intensity show much greater sequence constraint than regions with altered intensity or where TF binding was present in one species but not in another by pairwise comparison. The t –test based p-value for each comparison and species is listed on the right.
Figure S4
Figure S4
Coevolution of TF Binding Occurring in Clusters, Related to Figures 3 and 4 (A) Number of TFBRs with a single TF binding (1TF) or clusters of multiple TF binding. The ratio of clusters (gray) to 1TF (white) occurrences is similar in each mouse species. Within singletons, the proportion of free-standing CEBPA, HNF4A, and FOXA1 is shown by color as an inset (right side of each white bar). (B) Number of each sub-classification of the clusters of co-bound TFs. The largest fraction are generally the 3TF clusters, containing precisely one of each TF (gray, inset is the total number of TFBR). Within the 2TF clusters (multicolored, right outset is the total numbers of TFBR), the 2TF clusters containing FOXA1 and HNF4A (F+H, blue) are more often found than the combinations of the other two TFs (F+C, yellow; C+H, purple). A minority of clusters has multiple TFBRs for the same factor(s) (light gray inset is total number of TFBR). (C) TF binding events occurring in relative isolation (1TF) are far more likely to vary between species than binding events found in a cluster of TF binding with two TFs (2TF) or three TFs (3TF). When analyzed from the point of view of a specific TF (in yellow on right annotations), we define part shared as TFBR where co-bound TFs are missing in a second species, part unshared as those where co-bound TFs are present but the anchor TF is absent, and total unshared as TFBR lacking any TF occupancy in a second species. (D) The intensity differences between species of TFs co-bound in clusters differ in a coherent manner. All regions that were co-bound by two or more TFs and shared between C57BL/6J and any second mouse species (A/J, CAST/EiJ, SPRET/EiJ or Caroli/EiJ) were interrogated to see if, on average, we detect correlated or anti-correlated evolution of TF binding intensities. Each scatterplot shows the inter-species difference in intensity for one TF versus a second TF; for instance, in the first column, we plot the difference in intensity of FOXA1 versus the difference in intensity of CEBPA for each species-pair. The changes in TF binding intensities are consistently correlated. Pairs of TFs that were only partially conserved or differ entirely in occupancy between the C57BL/6J and other species were not considered.
Figure S5
Figure S5
Relationships among TF Binding Intensity, Cluster, Conservation, and Function, Related to Figure 5 (A) The distribution of ChIP intensities, plotted by number of nearby TFs. 3TF-clusters and 2TF-clusters are shown in gray, and singly-bound 1TF sites are shown in white. On average, the more TFs are present in a cluster, the stronger the ChIP enrichment. (B) The average intensity of TF binding increases in line with the number of species TFBRs are found in. (C) TFBRs shared among more species are more likely to be part of combinatorially bound clusters. (D) The TF binding regions shared among more species are more likely to be robust to SNVs in the underlying TF motif. (E) The set of TFBR shared by all five mouse species with conserved intensity (column e) and without conserved intensity (column d) are slightly (but statistically significantly) more likely to occur in promoter regions, when compared to the whole set of C57BL/6J TF binding regions (column b). (F) 155 direct target genes of CEBPA were selected by identifying, with microarray analysis, the genes with a significant expression decreases in a CEBPA KO mouse liver, when compared to WT liver (see Schmidt et al., 2010). The TFBRs located in a region from −10 Kb from the target gene 5′ start to +10 kb from the target gene 3′ end were selected (in further panels: TFBR near target gene). (G) When compared to TFBR near target genes, both species-specific TFBRs and TFBRs shared by all five species with a conserved intensity show very weak functional enrichment. This analysis was performed using the GREAT tool, and representative classes of highest statistical enrichments are shown for all TFBR categories. (H) We sorted TFBR in C57BL/6J mice by binding intensity into ten classes, and our search using the GREAT tool for evidence of functional enrichment was unsuccessful. (I) The TFBR near target genes shows a slight increase of ChIP strength compared to the TFBR near all genes. The conservation across the 29 mammals of the underlying sequence is only marginally significantly higher in this category.
Figure S6
Figure S6
Genetic Knockout of CEBPA and HNF4A to Destabilize Combinatorially Bound Regions, Related to Figure 6 (A) 3TF binding in C57BL/6J was sorted by how deeply conserved these 3TF clusters were as follows: Cons, all five species; Part, partially bound, no total losses; Loss, total loss in at least one other species; Unique, No binding at all found in any other mouse species. Clusters of 2TF found in the WT C57BL/6J and all the other mouse species are included as controls. (B) The distribution of binding intensities for each TF category in C57BL/6J are shown, color-coded (blue is HNF4A, green is FOXA1, red is CEBPA). (C) The overlap of a newly-created set of TF binding using new biological replicates in WT mouse liver were calculated versus the TFBR used throughout the manuscript (solid circles); in comparison, ChIP experiments were also performed in genetically engineered mice lacking either HNF4A or CEBPA (color-coded triangles). (D) We identified a subset of 3TF regions (1,173) in C57BL/6J where the whole cluster is absent from any of the other mouse species and where this disappearance can be linked to sequence changes in CEBPA motif only. We tested if these regions are more likely to be lost in CEBPA KO mouse liver, when compared to control regions where cluster disappearance is associated with changes in the HNF4A motif (1,882) or the FOXA1 (1,390) motif. We found that the 3TF sites identified as susceptible to CEBPA loss during evolution were also more sensitive to the genetic deletion of CEBPA. (E) We identified a subset of 3TF regions (1,882) in C57BL/6J where the whole cluster is absent from any of the other mouse species and where this disappearance can be linked to sequence changes in HNF4A motif only. We tested if these regions are more likely to be lost in HNF4A KO mouse liver, when compared to control regions where cluster disappearance can be linked to changes in the CEBPA (1,173) motif or the FOXA1 (1,390) motif. We found that the 3TF sites identified as susceptible to HNF4A loss during evolution were also more sensitive to the genetic deletion of HNF4A.

References

    1. Biddie S.C., John S., Sabo P.J., Thurman R.E., Johnson T.A., Schiltz R.L., Miranda T.B., Sung M.H., Trump S., Lightman S.L. Transcription factor AP1 potentiates chromatin accessibility and glucocorticoid receptor binding. Mol. Cell. 2011;43:145–155. - PMC - PubMed
    1. Biggin M.D. Animal transcription networks as highly connected, quantitative continua. Dev. Cell. 2011;21:611–626. - PubMed
    1. Boj S.F., Servitja J.M., Martin D., Rios M., Talianidis I., Guigo R., Ferrer J. Functional targets of the monogenic diabetes transcription factors HNF-1alpha and HNF-4alpha are highly conserved between mice and humans. Diabetes. 2009;58:1245–1253. - PMC - PubMed
    1. Bradley R.K., Li X.-Y., Trapnell C., Davidson S., Pachter L., Chu H.C., Tonkin L.A., Biggin M.D., Eisen M.B. Binding site turnover produces pervasive quantitative changes in transcription factor binding between closely related Drosophila species. PLoS Biol. 2010;8:e1000343. - PMC - PubMed
    1. ENCODE An integrated encyclopedia of DNA elements in the human genome. Nature. 2012;489:57–74. - PMC - PubMed

Supplemental References

    1. Albers C.A., Lunter G., MacArthur D.G., McVean G., Ouwehand W.H., Durbin R. Dindel: accurate indel calls from short-read data. Genome Res. 2011;21:961–973. - PMC - PubMed
    1. Bailey T.L., Williams N., Misleh C., Li W.W. MEME: discovering and analyzing DNA and protein sequence motifs. Nucleic Acids Res. 2006;34(Web Server issue):W369–W373. - PMC - PubMed
    1. Berlocher S.H., Swofford D.L. Searching for phylogenetic trees under the frequency parsimony criterion: an approximation using generalized parsimony. Syst. Biol. 1997;46:211–215. - PubMed
    1. Cooper G.M., Stone E.A., Asimenos G., Green E.D., Batzoglou S., Sidow A., NISC Comparative Sequencing Program Distribution and intensity of constraint in mammalian genomic sequence. Genome Res. 2005;15:901–913. - PMC - PubMed
    1. Garrison, E. and Marth, G. (2012). Haplotype-based variant detection from short-read sequencing. arXiv, arXiv: 1207.3907, http://arxiv.org/abs/1207.3907.

Publication types

Substances