. 2013 Aug 1;154(3):556-68.
doi: 10.1016/j.cell.2013.06.048.

Pharmacological inactivation of Skp2 SCF ubiquitin ligase restricts cancer stem cell traits and cancer progression

Affiliations

Pharmacological inactivation of Skp2 SCF ubiquitin ligase restricts cancer stem cell traits and cancer progression

Chia-Hsin Chan et al. Cell. .

Abstract

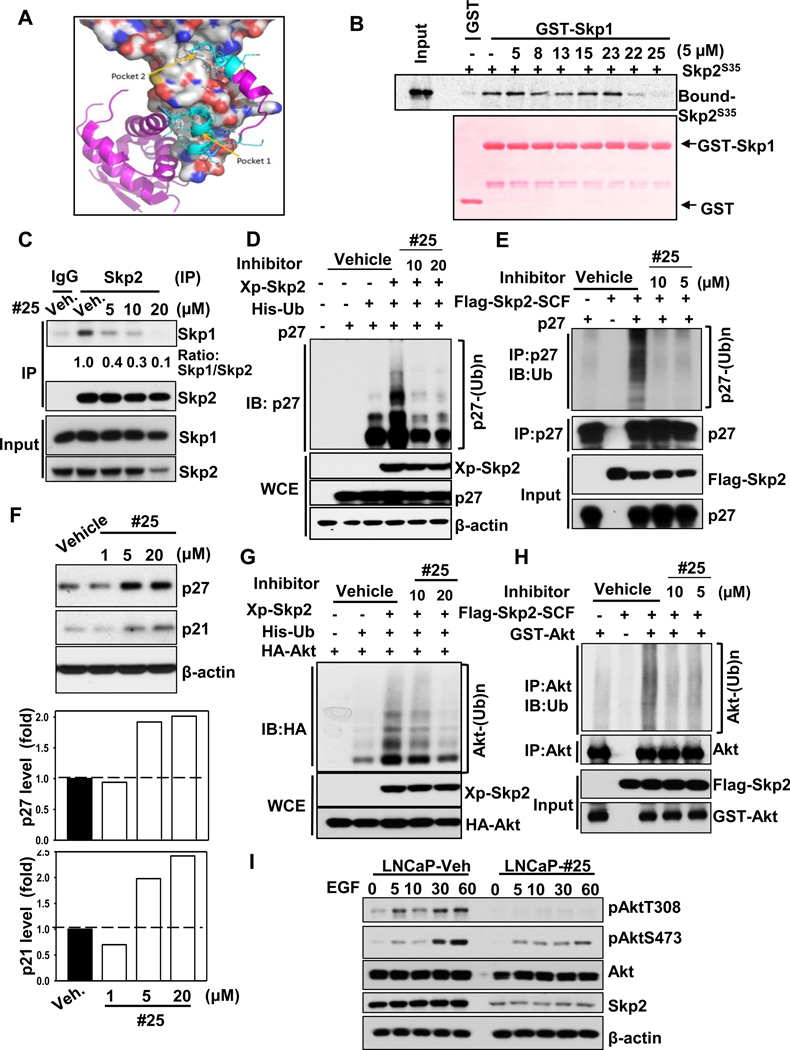
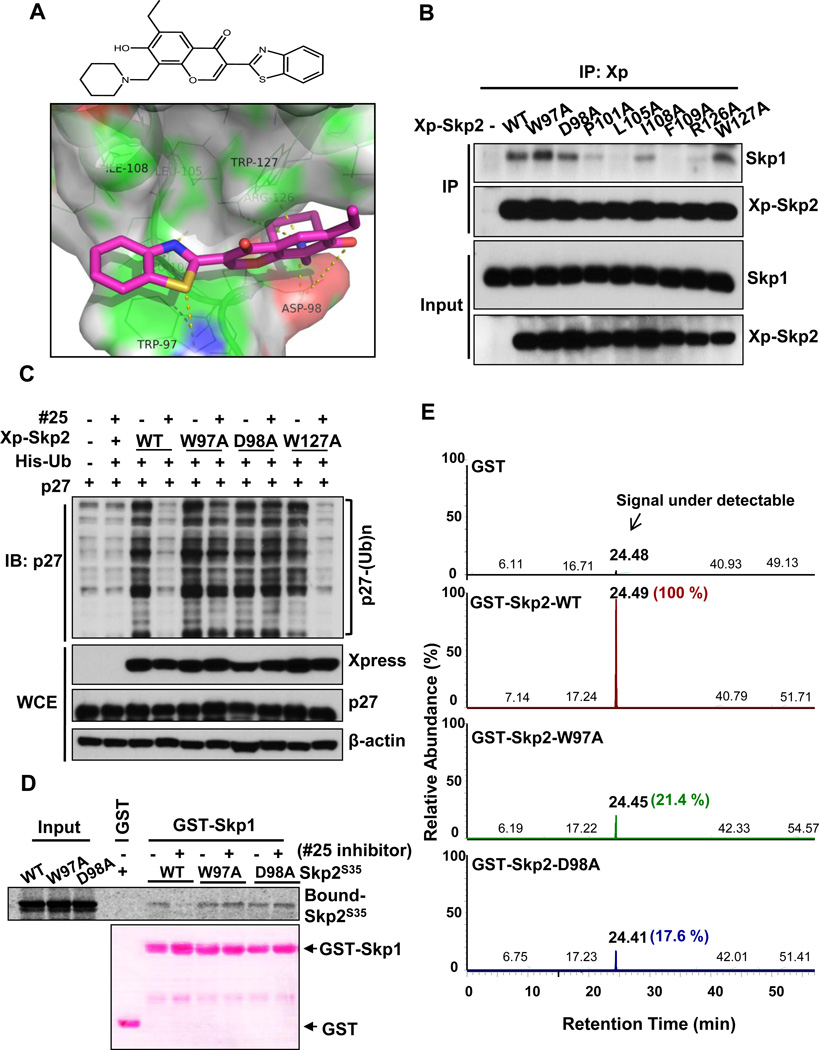
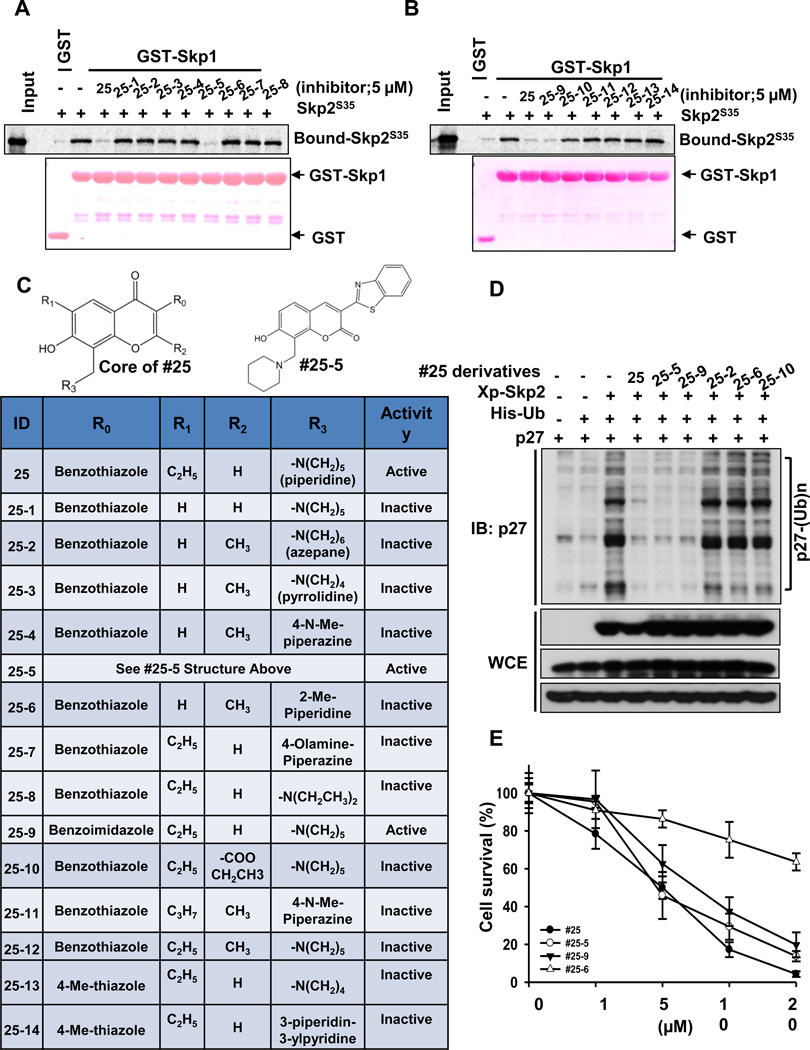
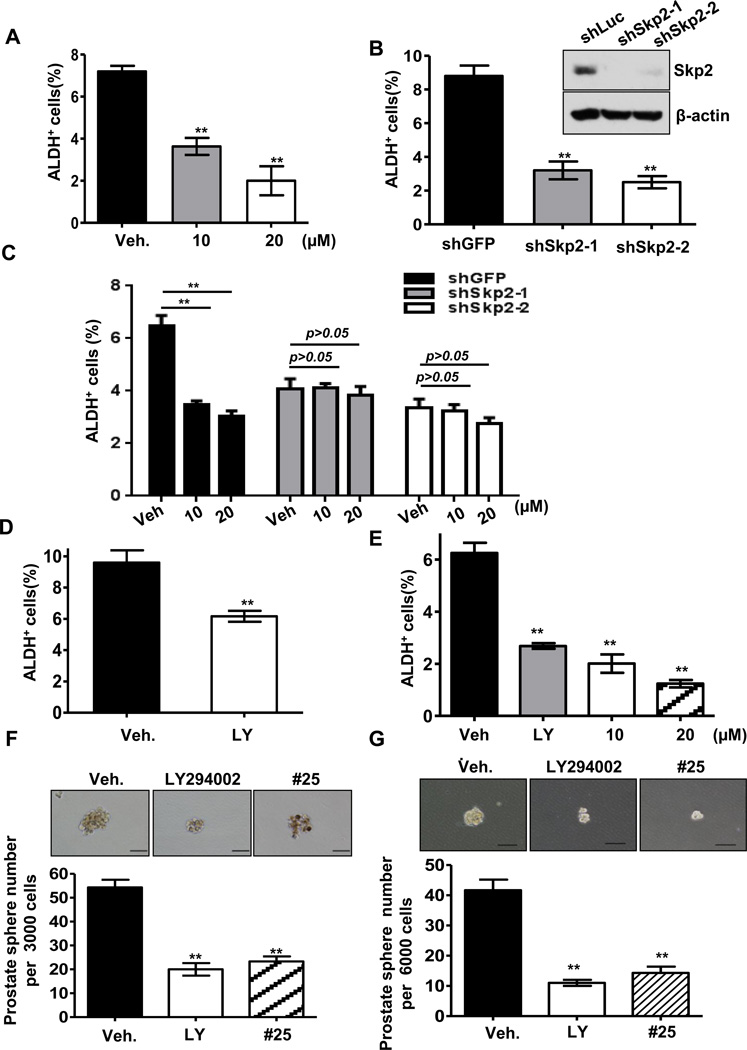
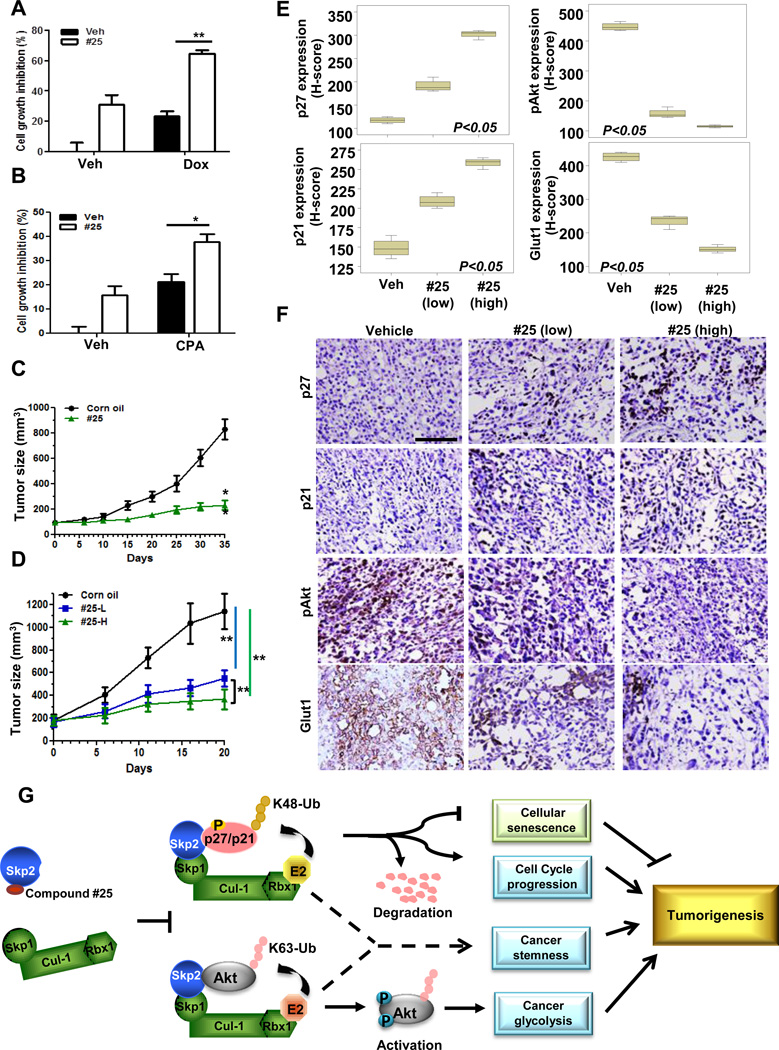
Skp2 E3 ligase is overexpressed in numerous human cancers and plays a critical role in cell-cycle progression, senescence, metabolism, cancer progression, and metastasis. In the present study, we identified a specific Skp2 inhibitor using high-throughput in silico screening of large and diverse chemical libraries. This Skp2 inhibitor selectively suppresses Skp2 E3 ligase activity, but not activity of other SCF complexes. It also phenocopies the effects observed upon genetic Skp2 deficiency, such as suppressing survival and Akt-mediated glycolysis and triggering p53-independent cellular senescence. Strikingly, we discovered a critical function of Skp2 in positively regulating cancer stem cell populations and self-renewal ability through genetic and pharmacological approaches. Notably, Skp2 inhibitor exhibits potent antitumor activities in multiple animal models and cooperates with chemotherapeutic agents to reduce cancer cell survival. Our study thus provides pharmacological evidence that Skp2 is a promising target for restricting cancer stem cell and cancer progression.


Figures

Figure 1
Figure 1. Identification of the Skp2 inhibitor which impairs Skp2 SCF E3 ligase activity via preventing Skp2-Skp1 binding
(A) The identified potential binding pockets on the interface of Skp2-Skp1 complex. Skp2 is shown as molecular surface (grey for carbon, blue for nitrogen, and red for oxygen atoms). Skp1 is displayed in purple/cyan ribbon and stick form. The cyan region represents residues of Skp1 interacting with Skp2 in the two pockets. (B) In vitro Skp2-Skp1 binding assay with or without compound #25. (C) In vivo Skp2-Skp1 binding assay with or without compound #25 in PC3 cells. (D) In vivo p27 ubiquitination assay in 293T cells transfected with p27, His-Ub, along with Xp-Skp2 in the presence of DMSO or compound #25. WCE indicates whole cell extracts. (E) In vitro Skp2-mediated p27 ubiquitination assay was performed with or without Flag-Skp2-SCF or p27 in the presence of DMSO or compound #25. (F) PC3 cells were treated with DMSO or compound #25 at different doses for 24h and harvested for immunoblotting (IB) assay. (G) In vivo Akt ubiquitination assay in 293T cells transfected with various constructs in the presence of DMSO or compound #25. (H) In vitro Skp2-mediated Akt ubiquitination assay was performed with or without Flag-Skp2-SCF or GST-Akt in the presence of DMSO or compound #25 (I) LNCaP cells were serum starved in the absence or presence of compound #25 for 24h, stimulated with or without EGF and harvested for IB assay. See also Figure S1.
Figure 2
Figure 2. Skp2 inhibitor directly interacts with Skp2 at Trp97 and Asp 98 residues
(A) Chemical structure of compound #25. 3-(1,3-benzothiazol-2-yl)-6-ethyl-7-hydroxy-8-(1-piperidinylmethyl)-4H-chromen-4-one (upper panel). The docking between compound #25 (magenta sticks) and predicted pocket 1 of Skp2 (surface representation). The residues in green lines form hydrogen bonding/hydrophobic/aromatic stacking interactions with compound #25. The yellow dashed lines represent hydrogen bonds between compound #25 and Skp2 (lower panel). (B) In vivo Skp2-Skp1 binding assay in 293T cells transfected with Skp2 or its various mutants. (C) In vivo p27 ubiquitination assay in 293T cells transfected with various constructs in the presence of DMSO or compound #25. (D) In vitro binding of Skp1 with Skp2 WT or various mutants in the presence of DMSO or compound #25. (E) The extracted ion chromatography spectra demonstrating the quantity of compound #25 bound to GST alone, GST-Skp2 WT, W97A mutant and D98A mutant (retention time ~ 24 min.). The identity of the bound compound was further confirmed by MS/MS analysis as shown in Figure S3. See also Figures S2 and S3.
Figure 3
Figure 3. The Skp2 inhibitor specific diminishes E3-ligase activity of Skp2-SCF complex, but not of other F-box SCF complex
(A–D) 293T cells transfected with various constructs in the presence of DMSO or compound #25 was treated with MG132 for 6 h followed by in vivo ubiquitination assay. (E) LNCaP cells were treated with DMSO, Skp2 inhibitors, or MLN4924 for 24h, and harvested for IB assay. See also Figures S4.
Figure 4
Figure 4. Inhibition of E3-ligase activity of Skp2-SCF complex results in cancer cell death, glycolysis defects and cellular senescence
(A) Prostate cancer cells and normal epithelial cells (PNT1A) were treated with various doses of compound #25, followed by cell survival assay. (B) Lung cancer cells and normal fibroblasts (IMR90) were treated with various doses of compound #25, followed by cell survival assay. (C) PC3 cells were treated with or without compound #25 for 4 days and harvested for senescence assay. (D, E) Lactate production was measured in PC3 (D) or LNCaP (E) cells treated with DMSO, LY294002 or compound #25. (F) Apoptosis rate was determined in PC3 cells treated with DMSO or compound #25. (G, H) PC3 cells with or without Skp2 knockdown (G) or PC3 cells stably expressed with Skp2 WT, W97A or D98A mutants (H) were treated with various doses of compound #25, followed by cell survival assay. Cell survival percentage of each stable cell lines treated with various doses of compound #25 was normalized to that treated with DMSO. Results are presented as mean values ±S.D. * indicates p<0.05, ** indicates p<0.01. See also Figures S5 and S6.
Figure 5
Figure 5. The structure-activity relationship (SAR) of compound #25 derivatives
(A, B) In vitro Skp2-Skp1 binding assay in the presence of DMSO, compound #25 or its derivatives. (C) SAR of compound #25 and its derivatives. #25-5 is illustrated separately due to its unique core structure. (D) In vivo p27 ubiquitination assay in 293T cells transfected with various constructs in the presence of DMSO, compound #25 or its derivatives with MG132 treatment. (E) PC3 cells were treated with various doses of compound #25 or its derivatives, followed by cell survival assay.
Figure 6
Figure 6. Skp2 inactivation diminishes cancer stem cell properties and heightens cancer cell sensitivity to chemotherapy
(A) Populations of ALDH+ cells were determined by FACS analysis in PC3 cells treated with vehicle or compound #25. (B) Populations of ALDH+ cells were determined by FACS analysis in PC3 cells with control or Skp2 knockdown. (C) Populations of ALDH+ cells were determined by FACS analysis in PC3 cells with control or Skp2 knockdown treated with vehicle or compound #25. (D) Populations of ALDH+ cells were determined by FACS analysis in PC3 cells with DMSO or LY294002. (E) Populations of ALDH+ cells were determined by FACS analysis in LNCaP cells treated with DMSO, LY294002 or compound #25. (F, G) Prostate sphere- formation assay in PC3 (F) and LNCaP (G) cells treated with DMSO, LY294002 or compound #25. Results are presented as mean values ±S.D. ** indicates p<0.01.
Figure 7
Figure 7. Skp2 inhibitor suppresses tumor growth in human tumor xenografts
(A, B) PC3 cells in the absence or presence of compound #25 were treated with Dox (A) or CPA (B), followed by cell survival assay. (C, D) Nude mice bearing A549 (C) or PC3 (D) tumor xenografts were administration with or without compound #25 via IP injection Mean tumor volumes ± s.d. are shown. n=6 mice per group. (E, F) The quantification results (E) and representative images (F) of histological analysis of p27, p21, pAkt, and Glut1 in PC3-induced tumor xenografts. “Low” indicates 40 mg/kg; “high” indicates 80 mg/kg of compound #25 were injected into mice. Scale bar indicates 100 µm. (G) The working model depicts how Skp2 inhibitor prevents Skp2-SCF complex formation and results in tumor suppression. Results are represented as mean values ±S.D. * indicates p<0.05, ** indicates p<0.01. See also Figure S7.

Comment in

References

    1. Ahad AM, Zuohe S, Du-Cuny L, Moses SA, Zhou LL, Zhang S, Powis G, Meuillet EJ, Mash EA. Development of sulfonamide AKT PH domain inhibitors. Bioorg Med Chem. 2011;19:2046–2054. - PMC - PubMed
    1. Bornstein G, Bloom J, Sitry-Shevah D, Nakayama K, Pagano M, Hershko A. Role of the SCFSkp2 ubiquitin ligase in the degradation of p21Cip1 in S phase. J Biol Chem. 2003;278:25752–25757. - PubMed
    1. Carrano AC, Eytan E, Hershko A, Pagano M. SKP2 is required for ubiquitin-mediated degradation of the CDK inhibitor p27. Nat Cell Biol. 1999;1:193–199. - PubMed
    1. Chan CH, Gao Y, Moten A, Lin HK. Novel ARF/p53-independent senescence pathways in cancer repression. J Mol Med (Berl) 2011;89:857–867. - PMC - PubMed
    1. Chan CH, Lee SW, Li CF, Wang J, Yang WL, Wu CY, Wu J, Nakayama KI, Kang HY, Huang HY, et al. Deciphering the transcriptional complex critical for RhoA gene expression and cancer metastasis. Nat Cell Biol. 2010a;12:457–467. - PMC - PubMed

Publication types

MeSH terms

Substances