. 2013 Aug 1;154(3):569-82.
doi: 10.1016/j.cell.2013.07.013.

BET bromodomains mediate transcriptional pause release in heart failure

Affiliations

BET bromodomains mediate transcriptional pause release in heart failure

Priti Anand et al. Cell. .

Abstract

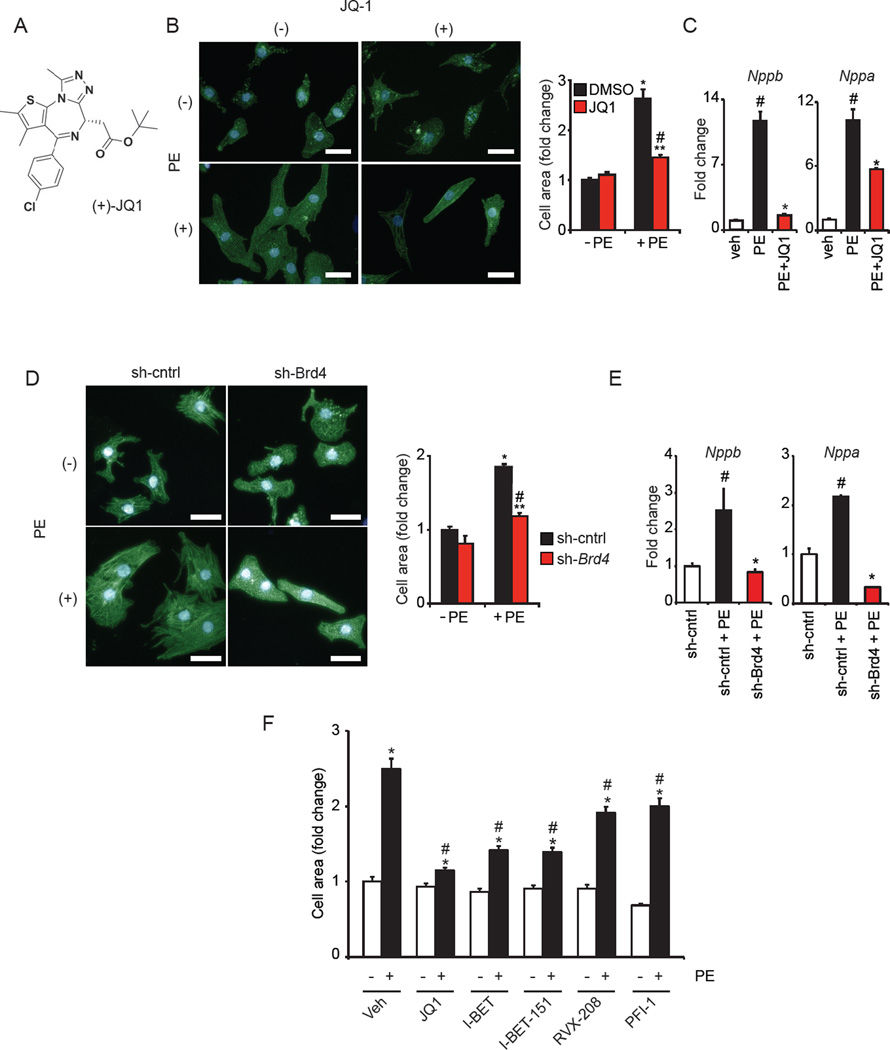
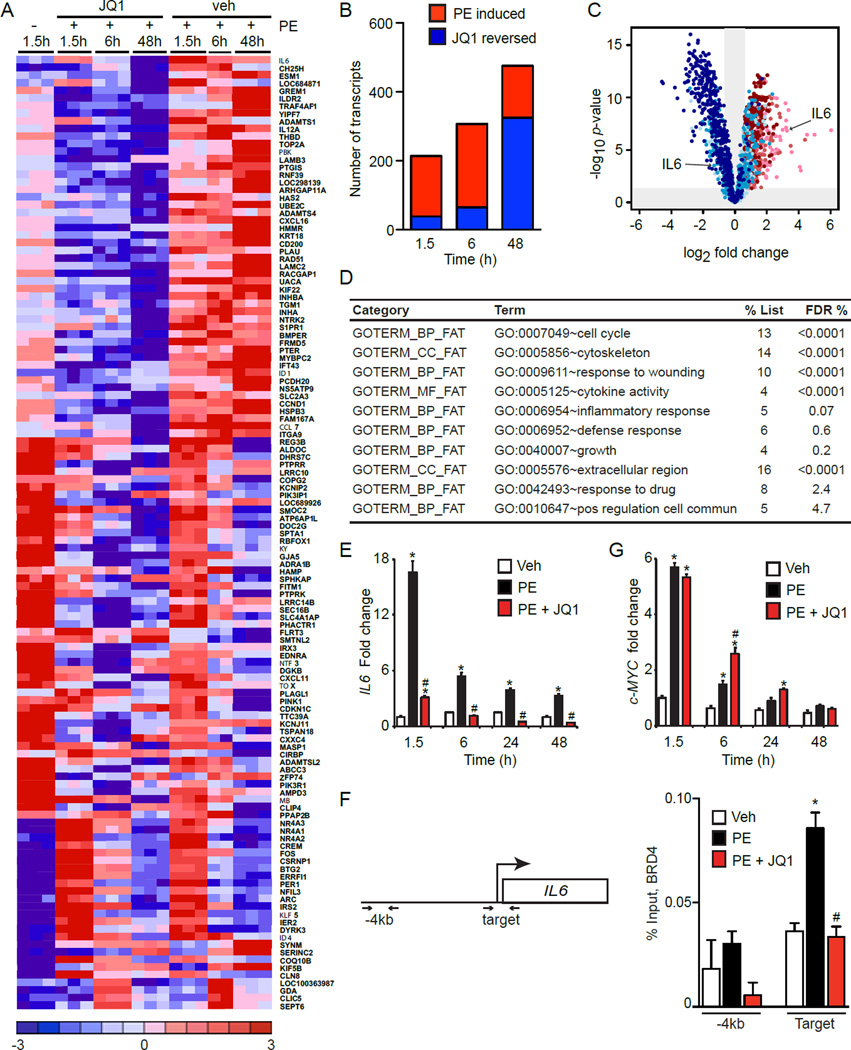
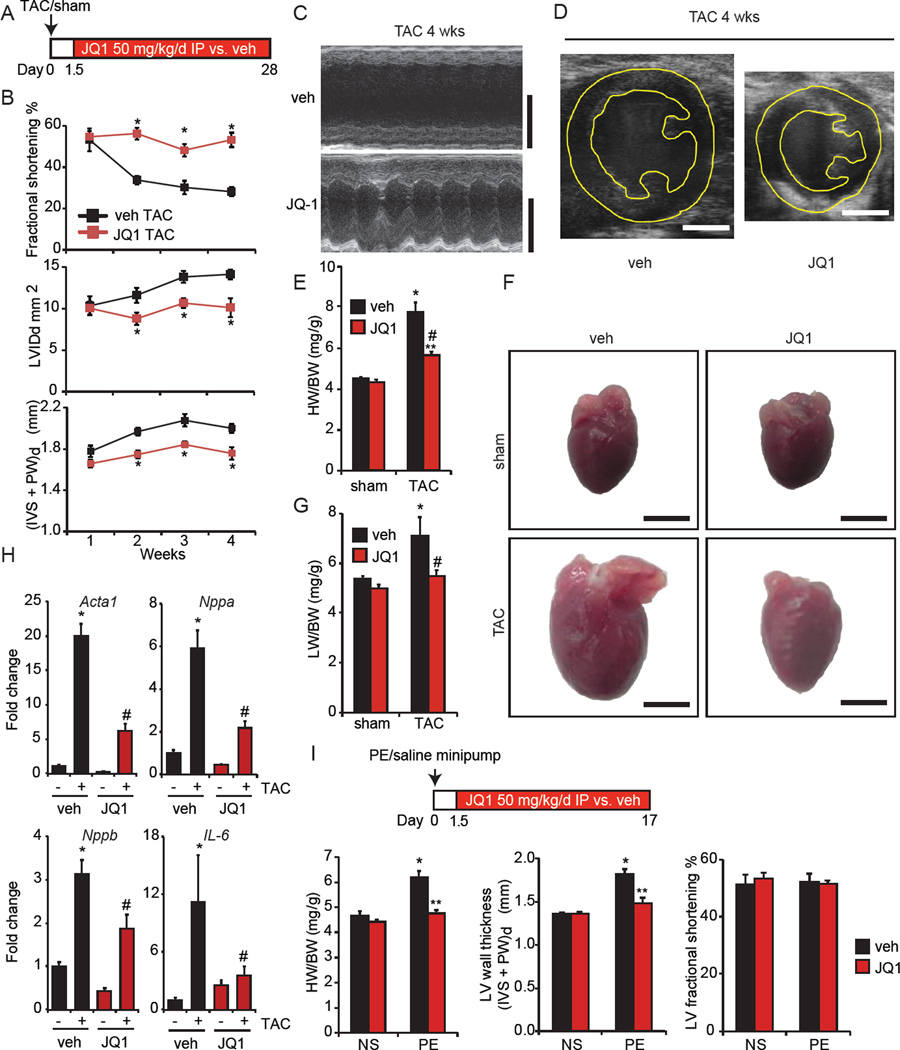
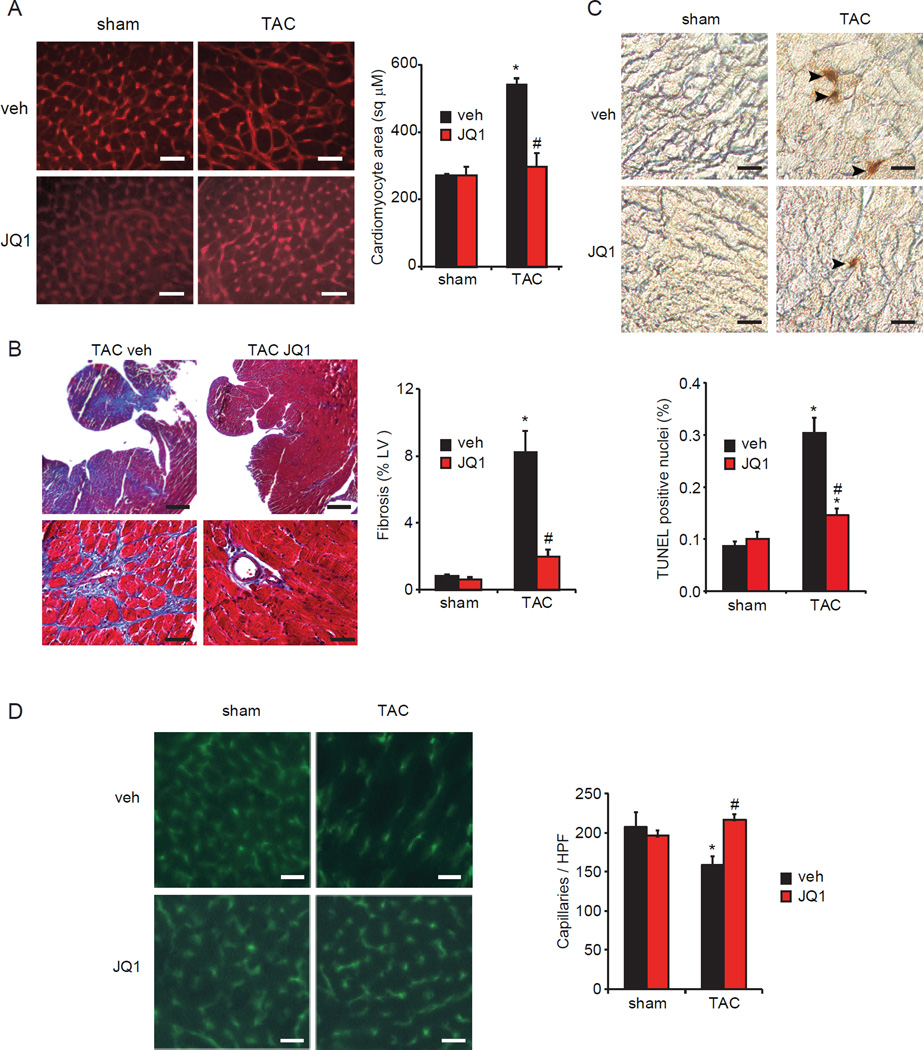
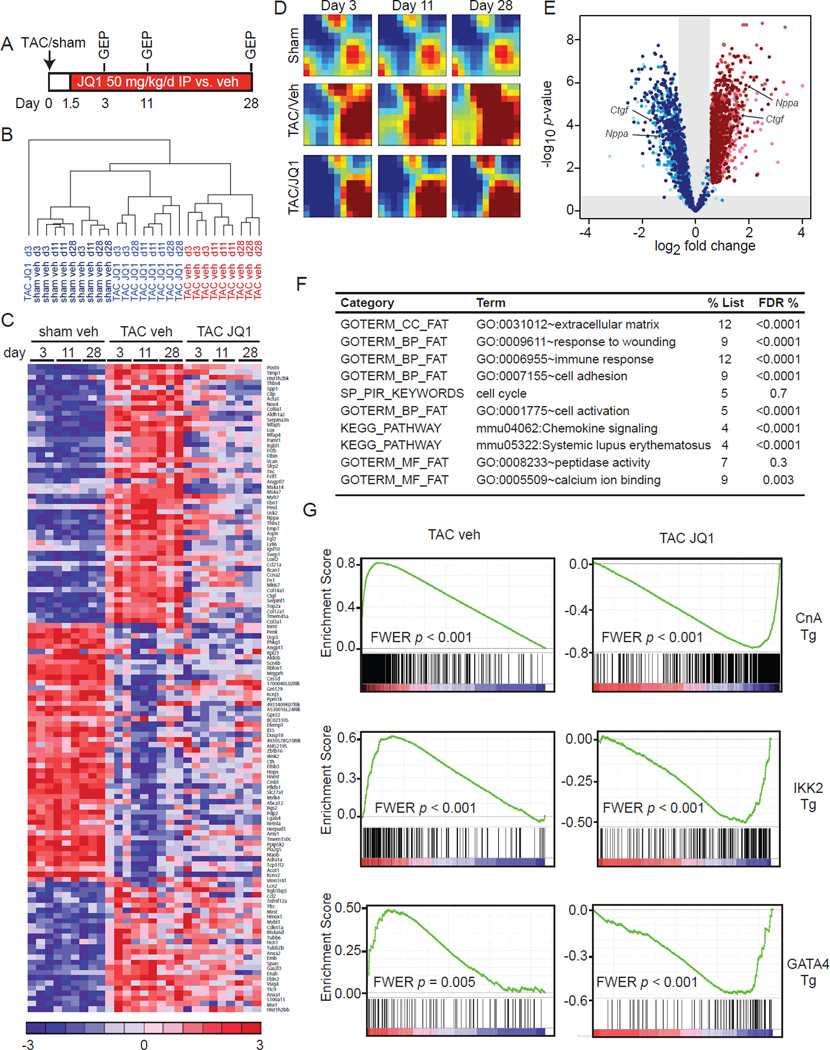
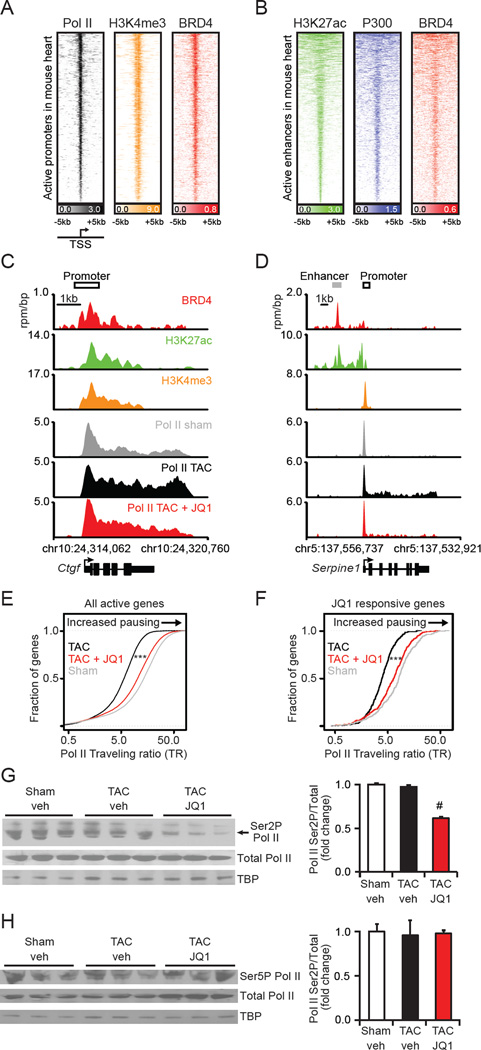
Heart failure (HF) is driven by the interplay between regulatory transcription factors and dynamic alterations in chromatin structure. Pathologic gene transactivation in HF is associated with recruitment of histone acetyl-transferases and local chromatin hyperacetylation. We therefore assessed the role of acetyl-lysine reader proteins, or bromodomains, in HF. Using a chemical genetic approach, we establish a central role for BET family bromodomain proteins in gene control during HF pathogenesis. BET inhibition potently suppresses cardiomyocyte hypertrophy in vitro and pathologic cardiac remodeling in vivo. Integrative transcriptional and epigenomic analyses reveal that BET proteins function mechanistically as pause-release factors critical to expression of genes that are central to HF pathogenesis and relevant to the pathobiology of failing human hearts. This study implicates epigenetic readers as essential effectors of transcriptional pause release during HF pathogenesis and identifies BET coactivator proteins as therapeutic targets in the heart.


Figures

Figure 1
Figure 1. BET bromodomain inhibition blocks CM hypertrophy in vitro
(A) (+)-JQ1 structure. (B) Representative image of NRVM treated ± JQ1 (250 nM) and PE (100 µM) for 48h with cell area quantification. *P<0.05 vs. DMSO −PE. **P<0.05 vs. JQ1 −PE. #P<0.05 vs. DMSO +PE. (C) qRT-PCR of NRVM treated with JQ1 (500nM) and PE (100µM, 48h, N=4). #P<0.05 vs. veh, *P<0.05 vs. PE. (D) Representative image of NRVM infected with Ad-sh-Brd4 or sh-cntrl treated ± PE (100µM, 48h) with cell area quantification. *P<0.05 vs. sh-cntrl −PE. **P<0.05 vs. sh-Brd4 −PE. #P<0.05 vs. sh-cntrl +PE. (E) qRT-PCR of NRVM during BRD4 knockdown ± PE (100 µM, 48h, N=4). #P<0.05 vs. sh-cntrl, *P<0.05 vs. sh-cntrl+PE. (F) Cell area of NRVM treated with indicated BET inhibitors (500 nM) ± PE (100 µM, 48h). *P<0.05 vs. –PE control for indicated compound. #P<0.05 vs. veh +PE. Bar=30µM. Data shown as mean ± SEM. See also Figure S1.
Figure 2
Figure 2. BET regulated transcriptional programs during CM hypertrophy in vitro
(A) Selected heat map of differentially expressed (DE) transcripts. NRVM treated with 500nM JQ1, 100µM PE. (B) Global analysis of DE transcripts showing induction of genes by PE with time (red) and progressive reversal of PE-mediated gene induction by JQ1 (blue). (C) Volcano plot showing fold change (x-axis) effect of PE+JQ1 versus PE+vehicle (shades of blue) on all genes upregulated at any time-point by PE vs. veh (shades of red). Progression from lighter to darker shading represents increasing time (1.5h, 6h, 48h). (D) Functional pathway analysis (DAVID) of PE-induced genes that were JQ1-reversed. FDR <5% considered statistically significant. (E) IL6 qRT-PCR in NRVM treated with JQ1 (500nM) and PE (100µM, N=4). *P<0.05 vs. veh, #P<0.05 vs. PE. (F) BRD4 ChIP-qPCR in NRVM treated with JQ1 (500nM) and PE (100µM) for 90min. Target and nontarget (-4kb region) primers depicted. N=3, *P<0.05 vs. veh, #P<0.05 vs. PE. (G) c-MYC qRT-PCR in NRVM treated with JQ1 (500 nM) and PE (100µM, N=4). *P<0.05 vs. veh, #P<0.05 vs. PE. Data shown as mean ± SEM. See also Figure S2 and Table S1.
Figure 3
Figure 3. BET Bromodomain inhibition with JQ1 potently attenuates pathologic cardiac hypertrophy and HF in vivo
(A) Experimental protocol. (B) Echocardiographic parameters during TAC (N=7). LVIDd is LV end diastolic area, (IVS + PW)d is sum thickness of the interventricular septum and posterior LV wall at end diastole. *P<0.05 vs. veh TAC. (C) Representative M-mode tracings and (D) end-diastolic 2D images at 4wks TAC. Bar=2 mm. (E) Heart/body weight (HW/BW) ratios, 4wks. *P<0.05 vs. sham veh. #P<0.05 vs. TAC veh. **P<0.05 vs. sham JQ1. (F) Representative photos of freshly excised whole hearts. Bar=3mm. (G) Lung/body weight (LW/BW) ratios, 4wks TAC (N=7 TAC, N=5 sham). *P<0.05 vs. sham veh. #P<0.05 vs. TAC veh. (H) qRT-PCR in mouse hearts (N=5–7). *P<0.05 vs. sham veh. #P<0.05 vs. TAC veh. (I) PE infusion (75 mg/kg/day) and JQ1 administration (N=7 PE, N=5 normal saline). *P<0.05 vs. NS veh. **P<0.05 vs. PE veh. Data shown as mean ± SEM. See also Figure S3 and Supplemental Videos 1–4.
Figure 4
Figure 4. BET Bromodomain inhibition attenuates cardinal histopathologic features of HF
(A) CM area quantification in LV sections. Bar=30µm. (B) Trichrome staining and quantification of fibrotic area. Bar=400µm (top), 40µm (bottom). (C) TUNEL staining of heart sections with quantification of TUNEL-positive nuclei. Bar=20 µm. (D) PECAM-1 immunofluorescence staining of LV sections with quantification of myocardial capillary density. HPF, 400X high powered field. Bar=30 µm. For panels A-D: N=3–4, 4wk time-point, *P<0.05 vs. sham veh, #P<0.05 vs. TAC veh. Data shown as mean ± SEM.
Figure 5
Figure 5. BETs co-activate a broad, but specific transcriptional program in the heart during TAC
(A) Protocol for GEP experiment. (B) Unsupervised hierarchical clustering of GEPs. (C) Heatmap of selected genes. Full list of DE genes in Table S2. (D) GEDI plots showing temporal evolution of gene clusters. (E) Volcano plot showing fold change effect of TAC+JQ1 vs. TAC-veh (shades of blue) on all genes upregulated at any time-point by TAC-veh vs. sham-veh (shades of red). Progression from lighter to darker shading represents increasing time (3d, 11d, 28d) (F) DAVID analysis of genes that were TAC-induced and JQ1-reversed. FDR <5% considered statistically significant. (G) GSEA for TAC-veh and TAC-JQ1 against three independent GEPs derived from CM-specific activation of canonical pro-hypertrophic transcriptional effectors in vivo: Calcineurin-NFAT (driven by a constitutively active Calcineurin A transgene (Bousette et al., 2010), NFκB driven by an IKK2 trasngene (Maier et al., 2012) and transgenic GATA4 overexpression (Heineke et al., 2007)). FWER p<0.250 represents statistically significant enrichment. Data representative for all three time-points. Plots shown for 28d time-point. Data shown as mean ± SEM. See also Figure S4 and Table S2.
Figure 6
Figure 6. BET bromodomain inhibition abrogates transcriptional pause release genomewide in pathologic hypertrophy
(A) Heatmap of Pol II (black), H3K4me3 (orange), and BRD4 (red) levels at active promoters ranked by Pol II levels in sham treated heart samples. Each row shows ±5kb centered on H3K4me3 peak. Rows ordered by average Pol II at the promoter. (B) Heatmap of H3K27ac (green), P300 (blue), and BRD4 (red) levels at active enhancers ranked by H3K27ac levels in adult heart. Each row shows ±5kb centered on H3K27ac peak. Rows ordered by amount of H3K27ac at enhancer. Color scaled intensities of A-B are in units of reads per million per base pair (rpm/bp). (C-D) Gene tracks at (C) Ctgf and (D) Serpine1 gene in heart. BRD4 (red) is from sham treated hearts. H3K27ac (green) and H3K4me3 (orange) derived from published landscapes of wild type mouse hearts (Shen et al., 2012) that are age/sex/strain-matched to our sham treated hearts. Pol II are from either sham (grey), TAC (black), or TAC+JQ1 treated (red) heart. x-axis shows genomic position. y-axis shows ChIP-seq occupancy (rpm/bp). (E-F) Empirical cumulative distribution plots of Pol II traveling ratios (TR) (Rahl et al., 2010) for genes that are transcriptionally active in either sham or TAC treated hearts (E) and genes that are TAC-induced and reversed by JQ1 (F). Differences in TR distribution between TAC and TAC+JQ1 treated hearts are statistically significant (*** Welch’s two-tailed t test, p < 2×10⁻¹⁶). (G-H) Western blots with densitometry of heart tissue nuclear extracts from sham, TAC, and TAC+JQ1 treated hearts for total Pol II or indicated phosphoforms (N=3; #P<0.05 vs. TAC veh). Data shown as mean ± SEM. See also Figure S5 and Table S3.

Comment in

References

    1. Banerjee C, Archin N, Michaels D, Belkina AC, Denis GV, Bradner J, Sebastiani P, Margolis DM, Montano M. BET bromodomain inhibition as a novel strategy for reactivation of HIV-1. Journal of leukocyte biology. 2012;92:1147–1154. - PMC - PubMed
    1. Bisgrove DA, Mahmoudi T, Henklein P, Verdin E. Conserved P-TEFb-interacting domain of BRD4 inhibits HIV transcription. Proc Natl Acad Sci U S A. 2007;104:13690–13695. - PMC - PubMed
    1. Bousette N, Chugh S, Fong V, Isserlin R, Kim KH, Volchuk A, Backx PH, Liu P, Kislinger T, MacLennan DH, et al. Constitutively active calcineurin induces cardiac endoplasmic reticulum stress and protects against apoptosis that is mediated by alpha-crystallin-B. Proc Natl Acad Sci U S A. 2010;107:18481–18486. - PMC - PubMed
    1. Dawson MA, Kouzarides T, Huntly BJ. Targeting epigenetic readers in cancer. N Engl J Med. 2012;367:647–657. - PubMed
    1. Delmore JE, Issa GC, Lemieux ME, Rahl PB, Shi J, Jacobs HM, Kastritis E, Gilpatrick T, Paranal RM, Qi J, et al. BET bromodomain inhibition as a therapeutic strategy to target c-Myc. Cell. 2011;146:904–917. - PMC - PubMed

Publication types

MeSH terms

Associated data