. 2013 Aug 27;110(35):14124-31.
doi: 10.1073/pnas.1312804110. Epub 2013 Aug 2.

Orexin-neuromodulated cerebellar circuit controls redistribution of arterial blood flows for defense behavior in rabbits

Affiliations

Orexin-neuromodulated cerebellar circuit controls redistribution of arterial blood flows for defense behavior in rabbits

Naoko Nisimaru et al. Proc Natl Acad Sci U S A. .

Abstract

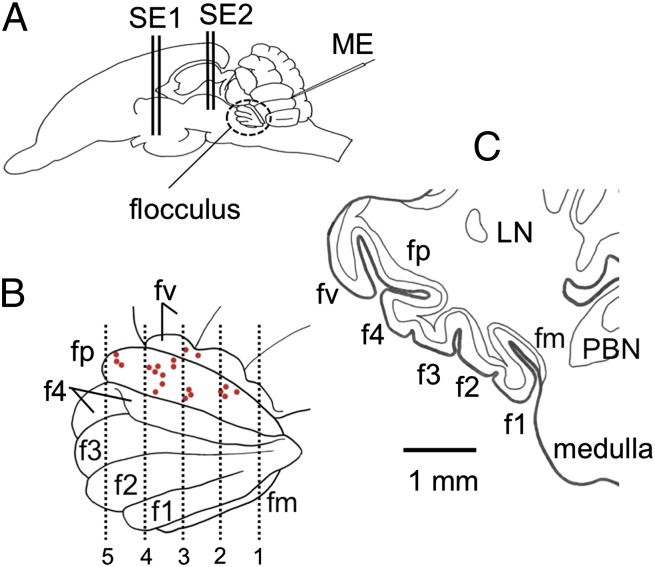
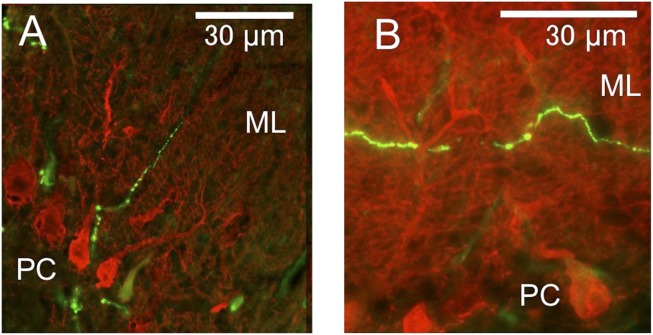
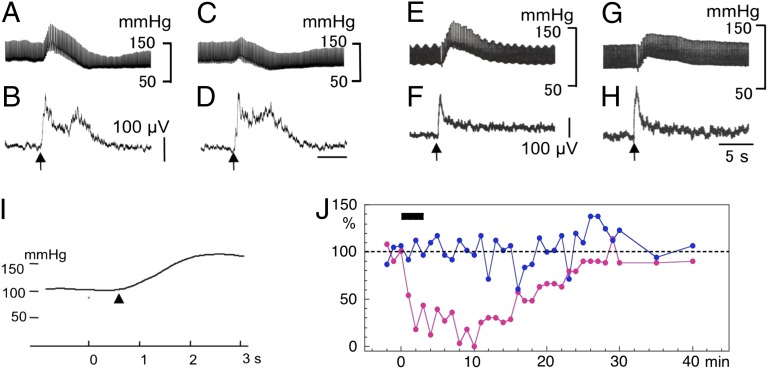
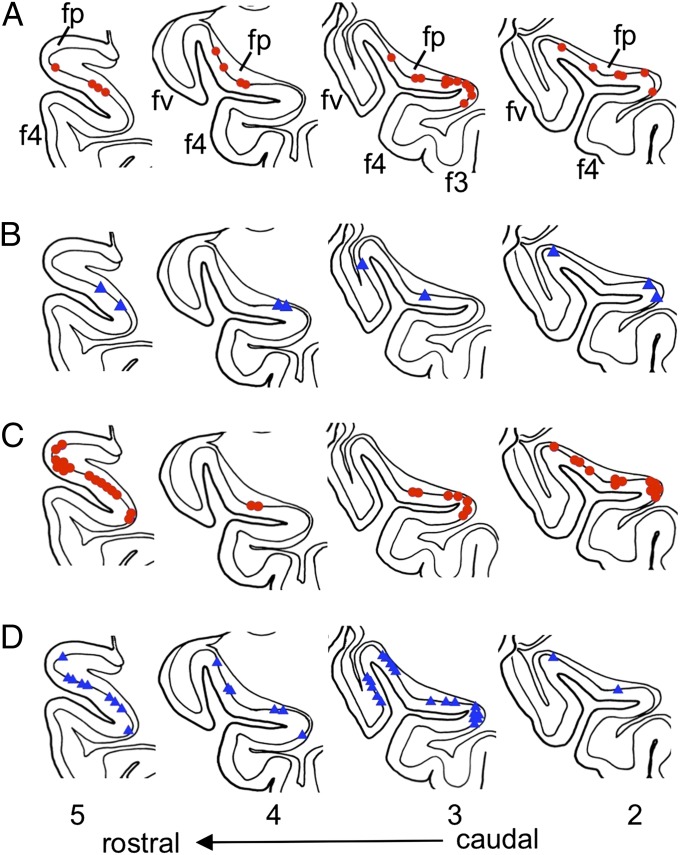
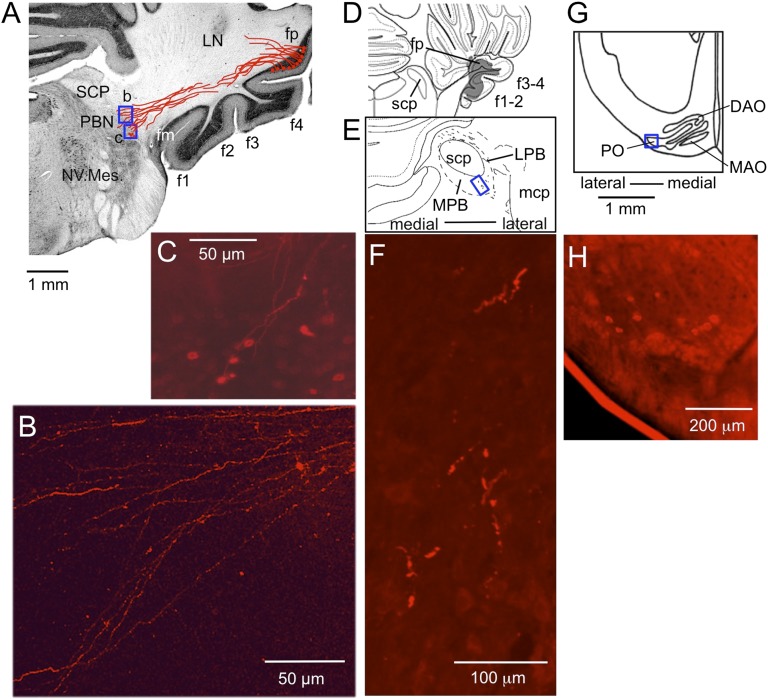
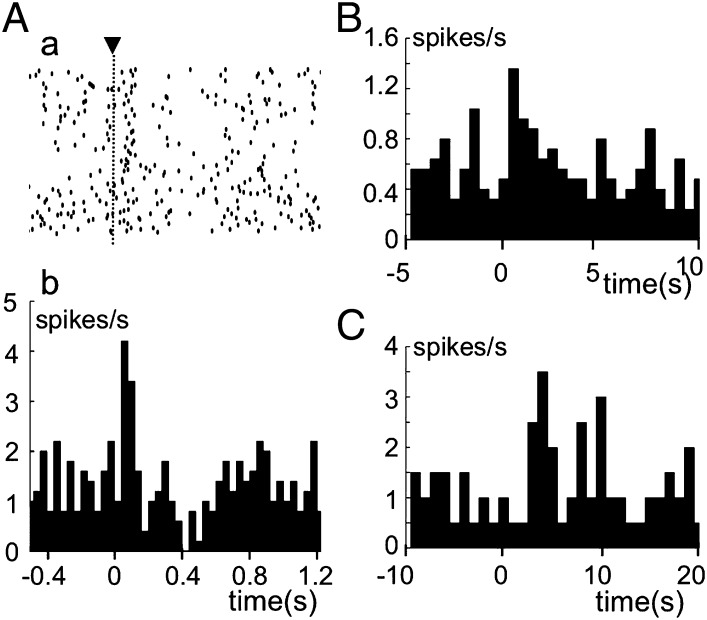
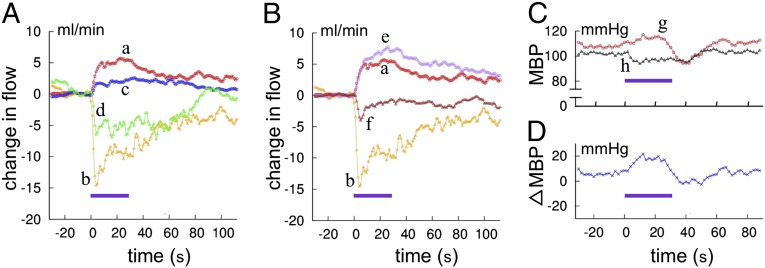
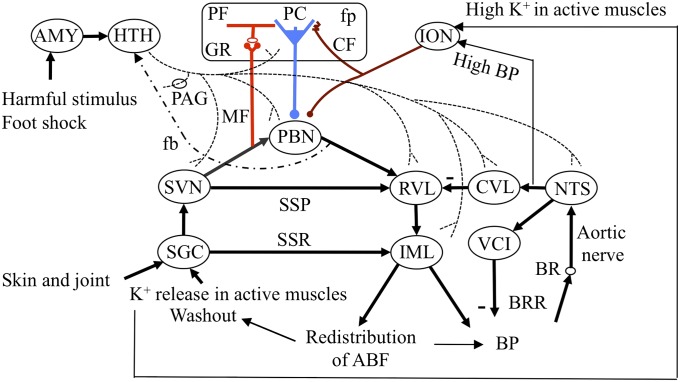
We investigated a unique microzone of the cerebellum located in folium-p (fp) of rabbit flocculus. In fp, Purkinje cells were potently excited by stimulation of the hypothalamus or mesencephalic periaqueductal gray, which induced defense reactions. Using multiple neuroscience techniques, we determined that this excitation was mediated via beaded axons of orexinergic hypothalamic neurons passing collaterals through the mesencephalic periaqueductal gray. Axonal tracing studies using DiI and biotinylated dextran amine evidenced the projection of fp Purkinje cells to the ventrolateral corner of the ipsilateral parabrachial nucleus (PBN). Because, in defense reactions, arterial blood flow has been known to redistribute from visceral organs to active muscles, we hypothesized that, via PBN, fp adaptively controls arterial blood flow redistribution under orexin-mediated neuromodulation that could occur in defense behavior. This hypothesis was supported by our finding that climbing fiber signals to fp Purkinje cells were elicited by stimulation of the aortic nerve, a high arterial blood pressure, or a high potassium concentration in muscles, all implying errors in the control of arterial blood flow. We further examined the arterial blood flow redistribution elicited by electric foot shock stimuli in awake, behaving rabbits. We found that systemic administration of an orexin antagonist attenuated the redistribution and that lesioning of fp caused an imbalance in the redistribution between active muscles and visceral organs. Lesioning of fp also diminished foot shock-induced increases in the mean arterial blood pressure. These results collectively support the hypothesis that the fp microcomplex adaptively controls defense reactions under orexin-mediated neuromodulation.

Keywords: OX-1R antagonist; baroreceptor; bicuculline; somatosympathetic; vestibulosympathetic.


Conflict of interest statement

The authors declare no conflict of interest.

Figures

Fig. 1.
Fig. 1.
Folium-p of rabbit flocculus. (A) Left side view of rabbit brain. ME, glass microelectrode; SE1, stimulating needle electrode inserted in the hypothalamus; SE2, another electrode in PAG. (B) Enlarged left side view of the flocculus showing its folial divisions. fp is exposed by retracting parts of the neighboring f4 and fv. Red spots, positions of the last microelectrode tracks in 21 experiments. Vertical lines 1–5 are drawn at 400, 800, 1,200, 1,600, and 2,000 μm from the caudal pole of fp. (C) Coronal section of the left flocculus at the level 4 in B. LN, lateral nucleus.
Fig. 2.
Fig. 2.
Orexinergic axons in flocculus. (A and B) Beaded orexin-immunopositive fibers double-stained for calbindin (red) and orexins (green). ML, molecular layer; PC, Purkinje cell.
Fig. 3.
Fig. 3.
Defense reactions evoked from the hypothalamus. (A–D) Stimulation of hypothalamus. Upward arrows indicate the moments of application of a train of 100-Hz pulses lasting 0.5 s. (A) Chart record of BP. (B) Integrated EMG recorded from nuchal muscles. (C and D) Similar to A and B, but recorded 10 min after i.v. injection of SB-334867. (E–H) Similar to A and D, but with stimulation of PAG. (I) Twenty times-averaged mean BP curve. ▴, the start of increase. (J) Plots changes in peak amplitudes of hypothalamus stimulation-evoked BP increases (red) and short-latency discharges in nuchal muscles (green) after i.v. injection of an OX-1R antagonist.
Fig. 4.
Fig. 4.
Recording from Purkinje cells. (A) Upper record, BP. Lower record, simple and complex spike discharges. Dots indicate complex spikes. The left hypothalamus was stimulated (horizontal bar). (B) Similar to A, but for another Purkinje cell. Specimens of simple and complex spikes are shown in an expanded time scale. (C–E) Examples of PSTHs for simple spike responses to hypothalamus/PAG stimulation. Ordinates, simple spike discharge frequency relative to the average frequency during 5-s prestimulation periods. Deviations of the PSTHs from that level occurring during 1-s poststimulation periods are shaded. Squares indicate the period of the stimulation. (F) Averaged PSTHs showing excitation before (red) and during (blue) continuous application of OX-1R antagonists at 100 nA (n = 16). A vertically hatched band indicates the 3-s period for statistical comparison between the two groups of plots. (G) Effects of iontophoresis of orexin-A (red) or OX-1R antagonists (blue) on spontaneous simple spike discharges. An obliquely hatched band indicates iontophoresis (n = 5 for each of the red and blue plots). (H) Similar to F, but with the effect of continuous iontophoresis of bicuculline on hypothalamus/PAG-induced inhibition (n = 5).
Fig. 5.
Fig. 5.
Location of hypothalamus/PAG stimulation-excited or -inhibited Purkinje cells. The 2–5, coronal sections of a standard flocculus specimen drawn at four levels indicated in Fig. 1B. The sites recording from Purkinje cells were determined on serial coronal sections and then replotted on the most closely positioned specimen section. (A) Hypothalamus stimulation-excited Purkinje cells (in red). (B) Hypothalamus stimulation-inhibited Purkinje cells (in blue). (C and D) Similar to A and B, but with PAG stimulation. Data were obtained from 7 rabbits with hypothalamus stimulation and 13 rabbits with PAG stimulation.
Fig. 6.
Fig. 6.
DiI- and BDA-labeled outputs and inputs of fp. (A) Coronal sections of cerebellum and medulla through right fp, into which DiI was injected. DiI-containing fibers were traced through three consecutive sections (100 μm thick) and superposed as drawn in red. LN, lateral cerebellar nucleus; NV. Mes., mesencephalic trigeminal nucleus; SCP, superior cerebellar peduncle. (B and C) Photomicrographs for two small areas (b and c) enclosed in A showing varicous pattern of the labeled axons (B) and retrogradely labeled neurons (C), respectively. (D) A section of the brainstem of another rabbit, relatively rostral corresponding to the level 5 in Fig. 4. BDA covered fp but extended also to the other floccular folia. (E) A 45-μm-thick section cut at 810 μm caudal to D, showing tissues around SCP in a larger scale. Wavy short lines indicate BDA-labeled axons. LPB, lateral PBN; MPB, medial PBN; mcp, middle cerebellar peduncle. (F) A photomicrograph of the part enclosed by a rectangle in E showing axon terminal-like structure labeled by BDA. (G) A section of the ventrolateral medulla at the caudal level of the principal olive (PO) of a third rabbit. Only the side contralateral to the fp injected with DiI is shown. (H) A photomicrograph for the area enclosed by a square in (G) showing retrogradely labeled IO neurons.
Fig. 7.
Fig. 7.
Sources of climbing fiber signals. Complex spikes were recorded from fp Purkinje cells and distinguished from simple spikes by their characteristic configurations. (A) Raster diagram (a) and corresponding PSTH (b) for complex spike discharges evoked from an fp Purkinje cell. ▾, moment of stimulation of the right aortic nerve with electric single pulses. Ordinate in b, discharge rate of complex spikes/s. (B) PSTH of complex spikes evoked by hypothalamic stimulation (time at 0 s) that induced transient mean BP increase. (C) Similar to B, but for one-shot injection of 40 mM KCl solution into left iliac artery at time 0 s.
Fig. 8.
Fig. 8.
Electric foot shock-evoked changes of arterial blood flow and blood pressure. (A) Redistribution of arterial blood flow. Curves a and b indicate control FAF and VAF, and the superposed curves c and d indicate FAF and VAF following systemic administration of OX-1R antagonist. Each curve indicates an average of four trials in the same session. (B) Changes in arterial blood flow recorded in the same rabbit as that whose data are shown in A before (curves a and b, same data as in A) and 5 d after kainite injection into bilateral fp regions (curves e and f, average of six trials). (C) Changes in mean BP (MBP) evoked by foot-shock stimulation. Curve g, before kainite lesioning; curve h, after kainate lesioning. (D) Difference between the curves g and h. Horizontal bars indicate the period of foot shock stimulation.
Fig. 9.
Fig. 9.
Neuronal circuit diagram for cerebellar control of defense reactions. AMY, amygdala; BR, baroreceptor; CF, climbing fiber; fb, feedback pathway; GR, granule cell; HTH, hypothalamus; MF, mossy fber; PF, parallel fiber. Other abbreviations are defined in the text.

References

    1. Oscarsson O. Functional units of the cerebellum-sagittal zones and microzones. Trends Neurosci. 1979;2:144–145.
    1. Ito M. Cerebellar circuitry as a neuronal machine. Prog Neurobiol. 2006;78(3-5):272–303. - PubMed
    1. King JS, Cummings SL, Bishop GA. Peptides in cerebellar circuits. Prog Neurobiol. 1992;39(4):423–442. - PubMed
    1. Ito M. Functional roles of neuropeptides in cerebellar circuits. Neuroscience. 2009;162(3):666–672. - PubMed
    1. Schweighofer N, Doya K, Kuroda S. Cerebellar aminergic neuromodulation: Towards a functional understanding. Brain Res Brain Res Rev. 2004;44(2-3):103–116. - PubMed

Publication types

LinkOut - more resources