

Linking climate to incidence of zoonotic cutaneous leishmaniasis (L. major) in pre-Saharan North Africa
- PMID: 23912199
- PMCID: PMC3774431
- DOI: 10.3390/ijerph10083172
Linking climate to incidence of zoonotic cutaneous leishmaniasis (L. major) in pre-Saharan North Africa
Abstract
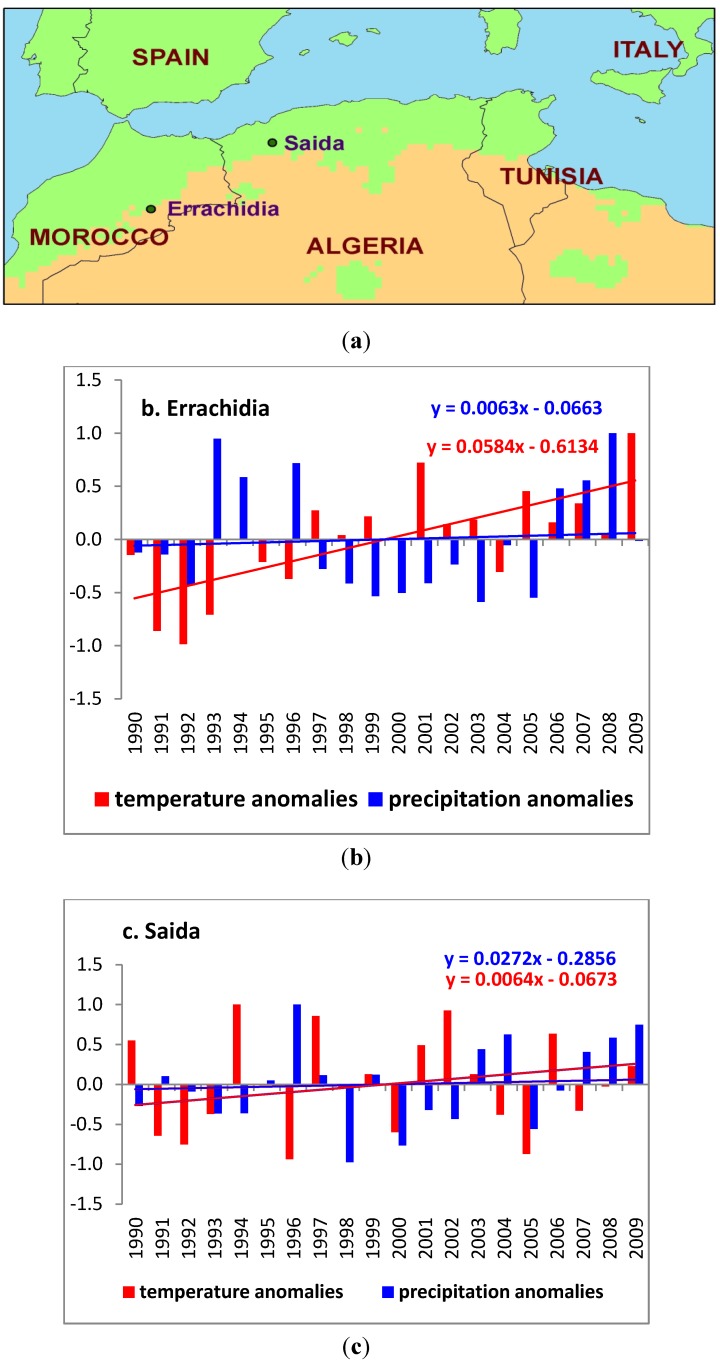
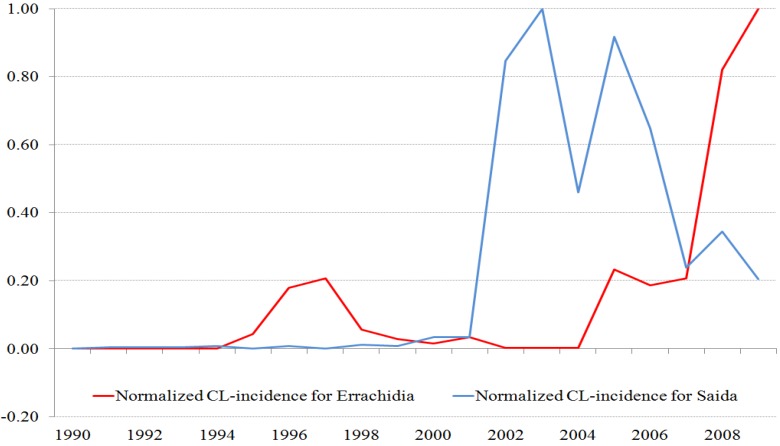
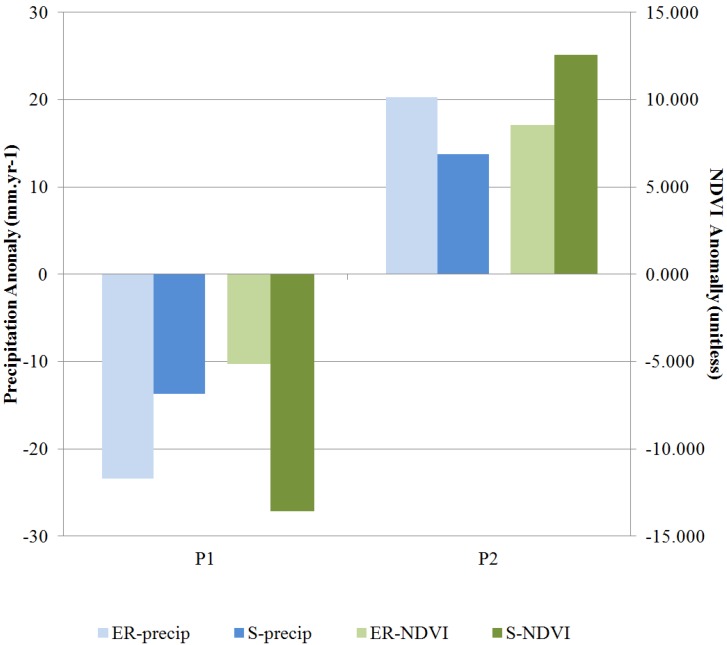
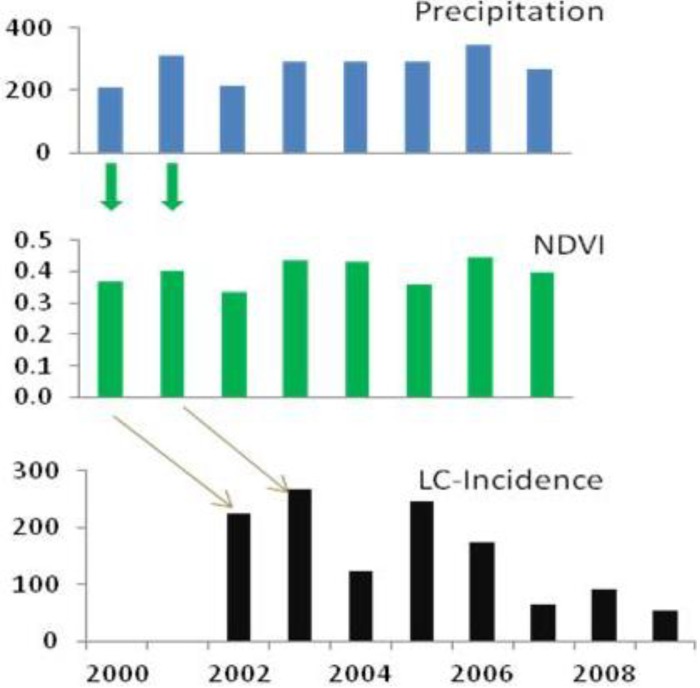
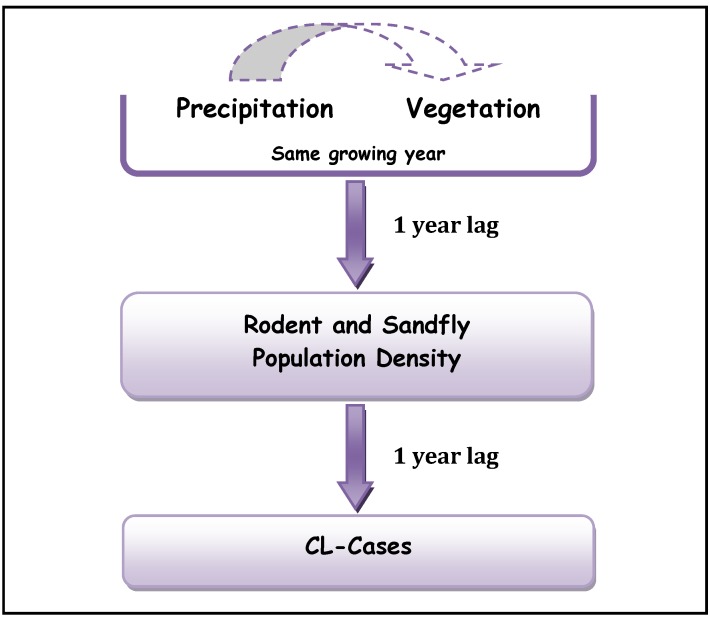
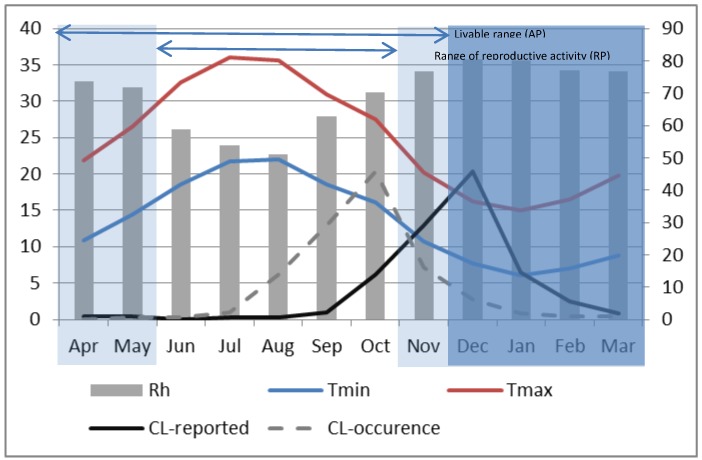
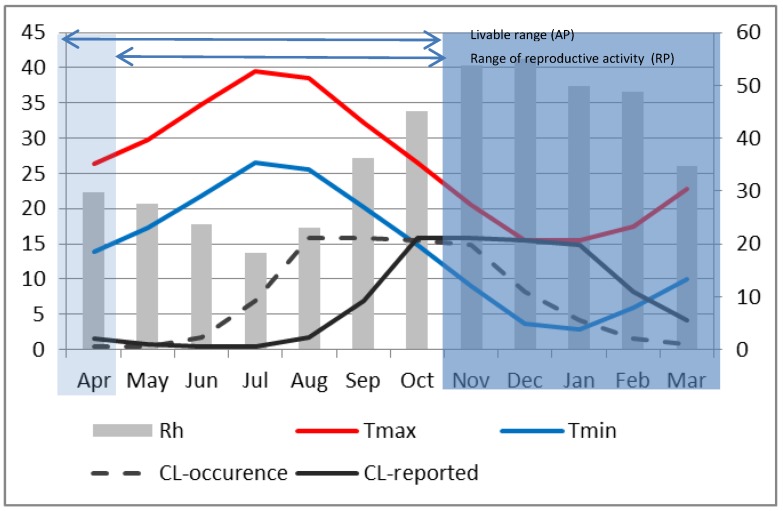
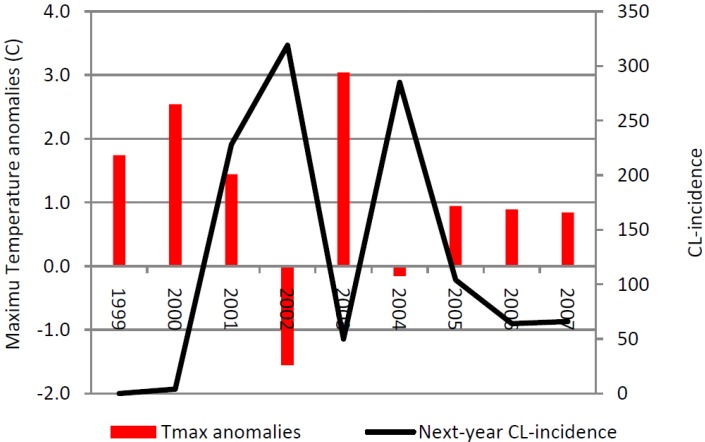
Shifts in surface climate may have changed the dynamic of zoonotic cutaneous leishmaniasis (ZCL) in the pre-Saharan zones of North Africa. Caused by Leishmania major, this form multiplies in the body of rodents serving as reservoirs of the disease. The parasite is then transmitted to human hosts by the bite of a Phlebotomine sand fly (Diptera: Psychodidae) that was previously fed by biting an infected reservoir. We examine the seasonal and interannual dynamics of the incidence of this ZCL as a function of surface climate indicators in two regions covering a large area of the semi-arid Pre-Saharan North Africa. Results suggest that in this area, changes in climate may have initiated a trophic cascade that resulted in an increase in ZCL incidence. We find the correlation between the rainy season precipitation and the same year Normalized Difference Vegetation Index (NDVI) to be strong for both regions while the number of cases of ZCL incidence lags the precipitation and NDVI by 2 years. The zoonotic cutaneous leishmaniasis seasonal dynamic appears to be controlled by minimum temperatures and presents a 2-month lag between the reported infection date and the presumed date when the infection actually occurred. The decadal increase in the number of ZCL occurrence in the region suggests that changes in climate increased minimum temperatures sufficiently and created conditions suitable for endemicity that did not previously exist. We also find that temperatures above a critical range suppress ZCL incidence by limiting the vector's reproductive activity.
Figures
References
-
- World Health Organization (WHO) Control of the Leishmaniasis: Report of a Meeting of the WHO Expert Committee on the Control of Leishmaniases. WHO; Geneva, Switzerland: 2010.
-
- Report of the Consultative Meeting on Cutaneous Leishmaniasis. [(accessed on 9 January 2012)]. Available online: www.who.int/ leishmaniasis/resources/Cutaneous_leish_cm_2008.pdf.
-
- World Health Organization (WHO) Urbanization: An increasing risk factor for Leishmaniasis. Wkly. Epidemiol. Record. 2002;77:365–372. - PubMed
Publication types
MeSH terms
LinkOut - more resources
Full Text Sources
Other Literature Sources
Medical
