. 2013 Sep;20(9):1098-105.
doi: 10.1038/nsmb.2636. Epub 2013 Aug 4.

Molecular basis for N-terminal acetylation by the heterodimeric NatA complex

Affiliations

Molecular basis for N-terminal acetylation by the heterodimeric NatA complex

Glen Liszczak et al. Nat Struct Mol Biol. 2013 Sep.

Abstract

N-terminal acetylation is ubiquitous among eukaryotic proteins and controls a myriad of biological processes. Of the N-terminal acetyltransferases (NATs) that facilitate this cotranslational modification, the heterodimeric NatA complex has the most diversity for substrate selection and modifies the majority of all N-terminally acetylated proteins. Here, we report the X-ray crystal structure of the 100-kDa holo-NatA complex from Schizosaccharomyces pombe, in the absence and presence of a bisubstrate peptide-CoA-conjugate inhibitor, as well as the structure of the uncomplexed Naa10p catalytic subunit. The NatA-Naa15p auxiliary subunit contains 13 tetratricopeptide motifs and adopts a ring-like topology that wraps around the NatA-Naa10p subunit, an interaction that alters the Naa10p active site for substrate-specific acetylation. These studies have implications for understanding the mechanistic details of other NAT complexes and how regulatory subunits modulate the activity of the broader family of protein acetyltransferases.


Conflict of interest statement

The authors declare no conflict of interest.

Figures

Figure 1
Figure 1
Overall structure of the NatA complex bound to AcCoA. (a) The Naa10p (teal) and Naa15p (brown) subunits are shown in cartoon bound to AcCoA (CPK coloring and stick format). Only Naa15p helices that contact Naa10p are labeled. The dotted brown line represents a disordered loop region in Naa15p. The dimensions of the complex are 107 Å × 85 Å × 70 Å. (b) A 90° rotation of the view in (a). (c) A zoom view highlighting key residues that composes the predominantly hydrophobic interface between Naa10p-α1-α2 and Naa15p-α29-α30. (d) A zoom view of the intersubunit interface at the C-terminal region of Naa10p-α1 and the Naa15p-α25-α27-α28 helices.
Figure 2
Figure 2
Structure of the Naa10p monomer bound to AcCoA. (a) A structural alignment of the uncomplexed Naa10p monomer (silver cartoon) bound to AcCoA (gray stick format) with the active Naa10p from the NatA structure (teal cartoon). (b) A zoom view of the surface exposed Naa10p-α1-α2 region from the alignment shown in (a) that highlights residues in these two helices that undergo a conformational shift upon Naa15p association. (c) The alignment from (a) docked into the Naa15p subunit. The stretch of the α1- α2 loop in the Naa10p monomer that clashes with Naa15p is highlighted with a dashed box and a zoom view of this region is also shown. Secondary structural elements in the zoom view are shown in cartoon format and have been labeled. Key residue side chains are shown in stick format and have been labeled. (d) A 70° clockwise rotation of (b). The repositioning of the Naa10p-α1-loop-α2 upon complex formation and accompanying altered active site landscape are shown. Key repositioned residues are shown in stick format. (e) A structural alignment of the complexed and uncomplexed forms of Naa10p with hNAA50 (pink) bound to CoA (gray stick format).
Figure 3
Figure 3
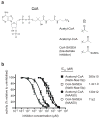
Inhibitor structures and IC50 curves. (a) A ChemDraw representation of CoA is shown along with R-groups that correspond to the structure of AcCoA, acetonyl-CoA and the bisubstrate inhibitor (CoA-SASEA). (b) The dose response curves corresponding to the titration of CoA-SASEA and acetonyl-CoA into wild type Naa10p·Naa15p and hNAA50 acetyltransferase reactions. IC50 values for each inhibitor against each NAT are also indicated. Reactions were performed in triplicate and error bars represent the standard deviation of each measurement.
Figure 4
Figure 4
Structure of the NatA complex bound to a bisubstrate inhibitor. (a) The structure of the bisubstrate inhibitor (orange) as it appears when bound to Naa10p in the context of the NatA complex. A simulated annealing omit map contoured to 1.5σ is shown in blue. Peptide residues are numbered relative to their position in the sequence. (b) A zoom view of the active site of the complexed Naa10p enzyme bound to the inhibitor. Residues that interact with the substrate peptide regions are shown in stick format and hydrogen bonds are shown as black dotted lines. (c) A bar graph showing the catalytic efficiencies of mutants. N.A. = This mutant has a Km greater than 2,000 μM and catalytic efficiency cannot be calculated. (d) A model of the inhibitor docked into the uncomplexed form of Naa10p. Corresponding residues of the uncomplexed Naa10p structure that mediate substrate interactions in the complexed form of the enzyme are shown in stick format. (e) A model of the human NAA50 substrate and CoA (yellow stick format) docked into the active site of the complexed Naa10p. Glutamate (silver), valine (green) and threonine (blue) substrate amino-terminal side chains have also been docked into the peptide-binding pocket. Residues from each enzyme that have been shown to interact with their corresponding substrate peptides are shown in stick format.
Figure 5
Figure 5
The active site of the NatA complex. (a) The active site of the inhibitor-bound Naa10p subunit. The inhibitor (orange) and residues found to be important for catalysis (teal) are shown in stick format. The general bases of the hNAA50 enzyme (pink) and corresponding residues in Naa10p are also shown in stick format. (b) Sequence alignment of key features from Naa10 catalytic subunits from Schizosaccharomyces pombe (Sp), Arabidopsis thaliana (At), Caenorhabditis elegans (Ce), Candida albicans (Ca), Drosophila melanogaster (Dm), and Homo sapiens (Hs). Black circles (●) have been placed above proposed key catalytic residues and crosses (+) have been placed above proposed substrate binding residues. (c) Alignment of the NatA active site with the corresponding active sites of other protein and small molecule GNAT enzymes. Key catalytic residues for each enzyme are highlighted. (d) Sequence alignment of catalytic subunits of NAT complexes from NatA, NatB and NatC from Schizosaccharomyces pombe (Sp) and Homo sapiens (Hs). Black circles (●) have been placed above proposed key catalytic residues and crosses (+) have been placed above proposed substrate binding residues.

References

    1. Arnesen T, et al. Proteomics analyses reveal the evolutionary conservation and divergence of N-terminal acetyltransferases from yeast and humans. Proc Natl Acad Sci U S A. 2009;106:8157–62. - PMC - PubMed
    1. Forte GM, Pool MR, Stirling CJ. N-terminal acetylation inhibits protein targeting to the endoplasmic reticulum. PLoS Biol. 2011;9:e1001073. - PMC - PubMed
    1. Hwang CS, Shemorry A, Varshavsky A. N-terminal acetylation of cellular proteins creates specific degradation signals. Science. 2010;327:973–7. - PMC - PubMed
    1. Scott DC, Monda JK, Bennett EJ, Harper JW, Schulman BA. N-terminal acetylation acts as an avidity enhancer within an interconnected multiprotein complex. Science. 2011;334:674–8. - PMC - PubMed
    1. Starheim KK, Gevaert K, Arnesen T. Protein N-terminal acetyltransferases: when the start matters. Trends Biochem Sci. 2012;37:152–61. - PubMed

Publication types

MeSH terms