

Short-term exposure to particulate matter constituents and mortality in a national study of U.S. urban communities
- PMID: 23912641
- PMCID: PMC3801200
- DOI: 10.1289/ehp.1206185
Short-term exposure to particulate matter constituents and mortality in a national study of U.S. urban communities
Abstract
Background: Although the association between PM2.5 mass and mortality has been extensively studied, few national-level analyses have estimated mortality effects of PM2.5 chemical constituents. Epidemiologic studies have reported that estimated effects of PM2.5 on mortality vary spatially and seasonally. We hypothesized that associations between PM2.5 constituents and mortality would not vary spatially or seasonally if variation in chemical composition contributes to variation in estimated PM2.5 mortality effects.
Objectives: We aimed to provide the first national, season-specific, and region-specific associations between mortality and PM2.5 constituents.
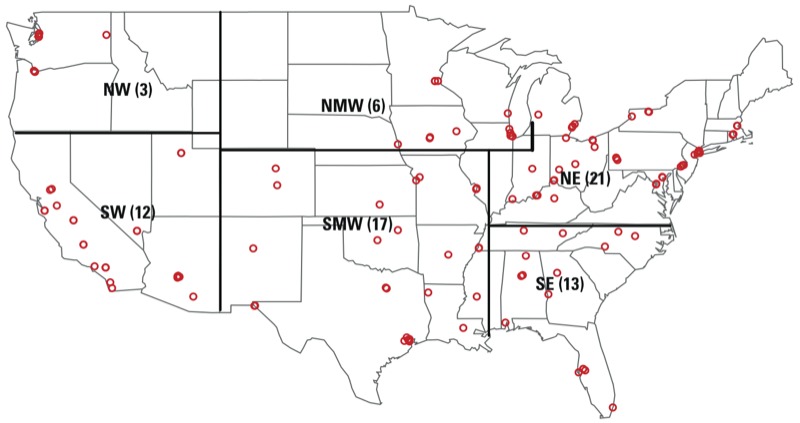
Methods: We estimated short-term associations between nonaccidental mortality and PM2.5 constituents across 72 urban U.S. communities from 2000 to 2005. Using U.S. Environmental Protection Agency (EPA) Chemical Speciation Network data, we analyzed seven constituents that together compose 79-85% of PM2.5 mass: organic carbon matter (OCM), elemental carbon (EC), silicon, sodium ion, nitrate, ammonium, and sulfate. We applied Poisson time-series regression models, controlling for time and weather, to estimate mortality effects.
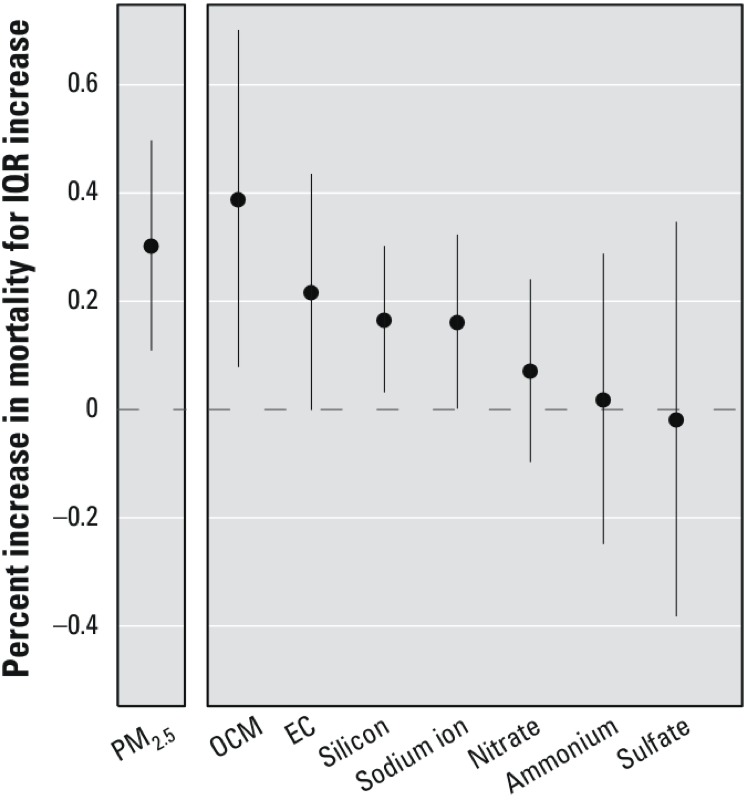
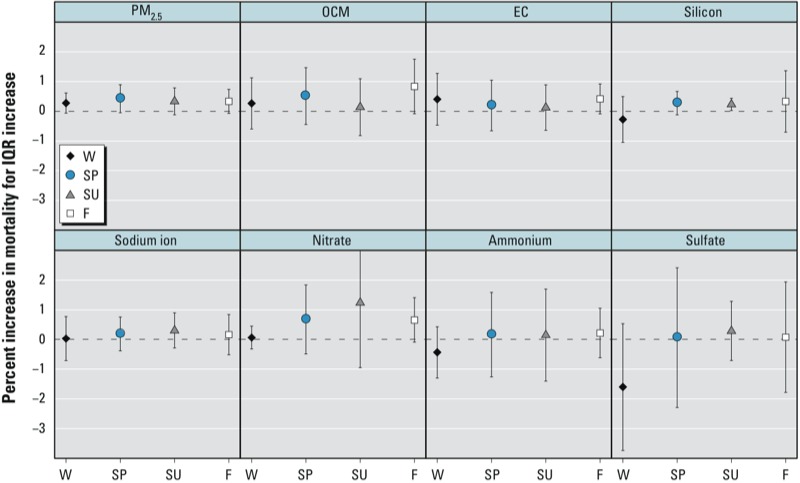
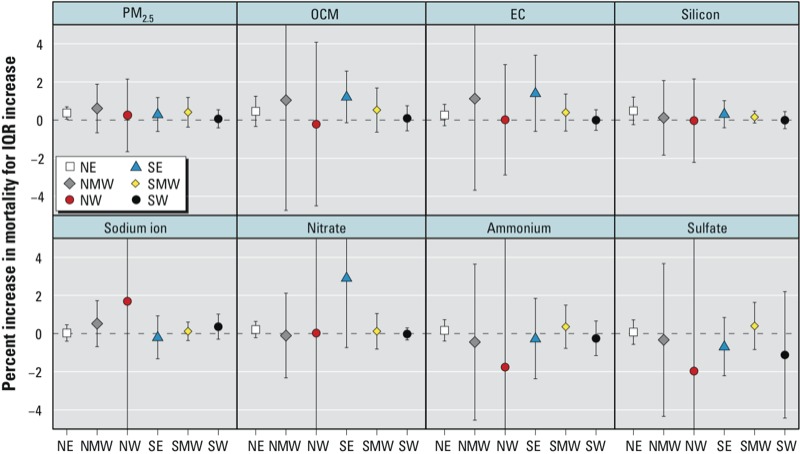
Results: Interquartile range increases in OCM, EC, silicon, and sodium ion were associated with estimated increases in mortality of 0.39% [95% posterior interval (PI): 0.08, 0.70%], 0.22% (95% PI: 0.00, 0.44), 0.17% (95% PI: 0.03, 0.30), and 0.16% (95% PI: 0.00, 0.32), respectively, based on single-pollutant models. We did not find evidence that associations between mortality and PM2.5 or PM2.5 constituents differed by season or region.
Conclusions: Our findings indicate that some constituents of PM2.5 may be more toxic than others and, therefore, regulating PM total mass alone may not be sufficient to protect human health.
Conflict of interest statement
Although the research described in this study has been funded in part by the U.S. EPA through grant agreements RD-83241701 and RD-83479801, it has not been subjected to the agency’s required peer and policy review and therefore does not necessarily reflect the views of the agency, and no official endorsement should be inferred. The content also does not reflect the official views of the NIEHS or the National Institutes of Health.
The authors declare they have no actual or potential competing financial interests.
Figures
References
Publication types
MeSH terms
Substances
Grants and funding
- R21 ES022585/ES/NIEHS NIH HHS/United States
- ES012054/ES/NIEHS NIH HHS/United States
- R01 ES015028/ES/NIEHS NIH HHS/United States
- R21 ES020152/ES/NIEHS NIH HHS/United States
- R01 ES019560/ES/NIEHS NIH HHS/United States
- ES03819/ES/NIEHS NIH HHS/United States
- R01 ES019587/ES/NIEHS NIH HHS/United States
- ES020152/ES/NIEHS NIH HHS/United States
- R01 ES012054/ES/NIEHS NIH HHS/United States
- ES019587/ES/NIEHS NIH HHS/United States
- ES015028/ES/NIEHS NIH HHS/United States
- T32 AG000247/AG/NIA NIH HHS/United States
- T32AG000247/AG/NIA NIH HHS/United States
- ES019560/ES/NIEHS NIH HHS/United States
- P30 ES003819/ES/NIEHS NIH HHS/United States
LinkOut - more resources
Full Text Sources
Other Literature Sources
Research Materials
Miscellaneous