. 2013 Oct;20(10):1415-24.
doi: 10.1038/cdd.2013.104. Epub 2013 Aug 2.

p73 regulates autophagy and hepatocellular lipid metabolism through a transcriptional activation of the ATG5 gene

Affiliations

p73 regulates autophagy and hepatocellular lipid metabolism through a transcriptional activation of the ATG5 gene

Z He et al. Cell Death Differ. 2013 Oct.

Abstract

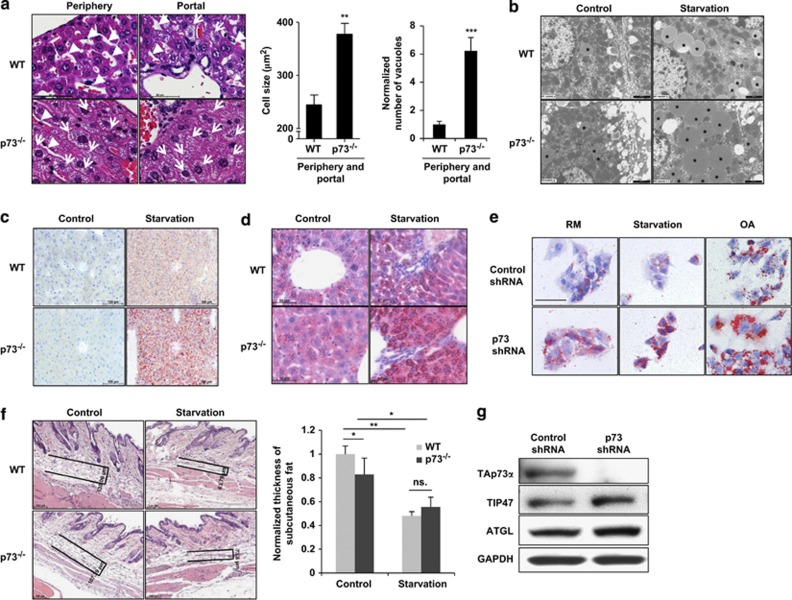
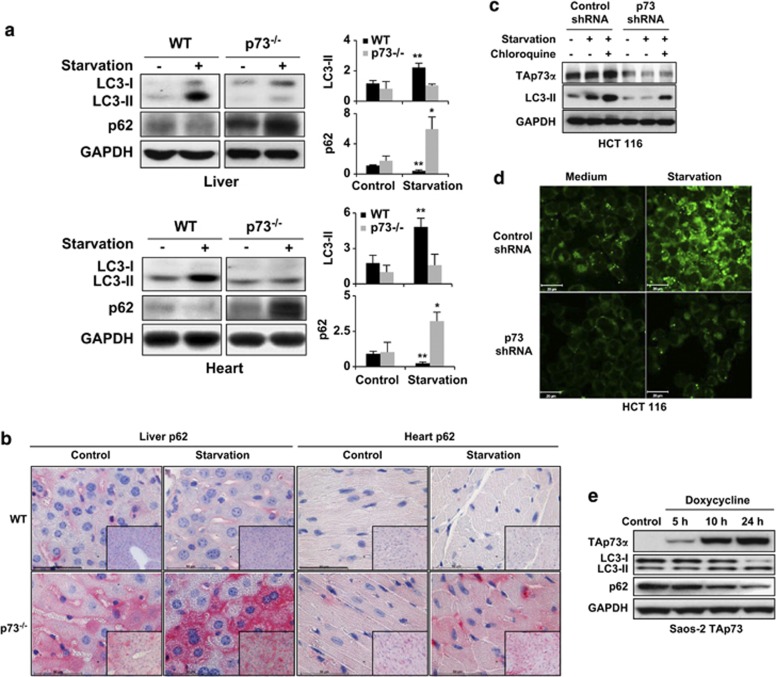
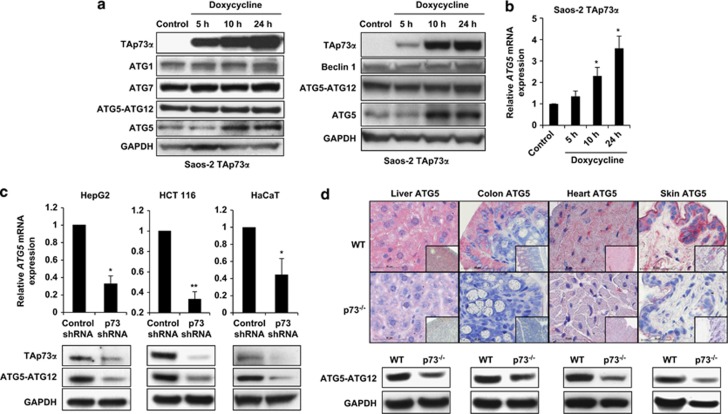
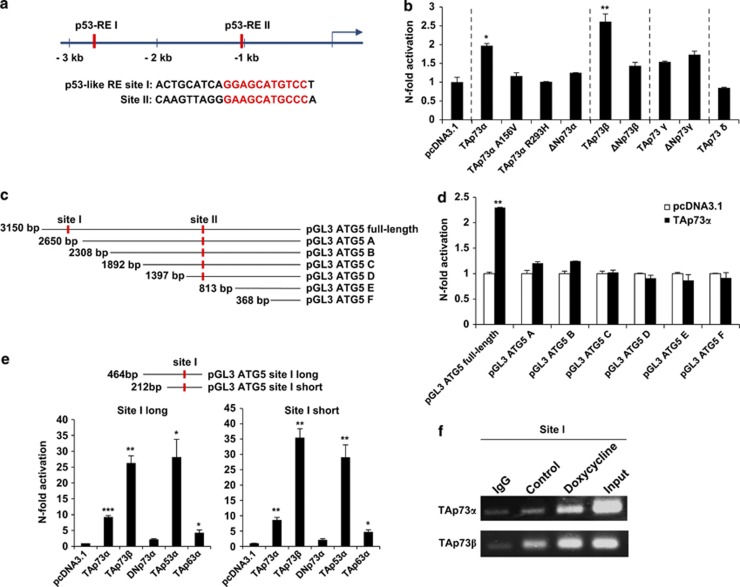
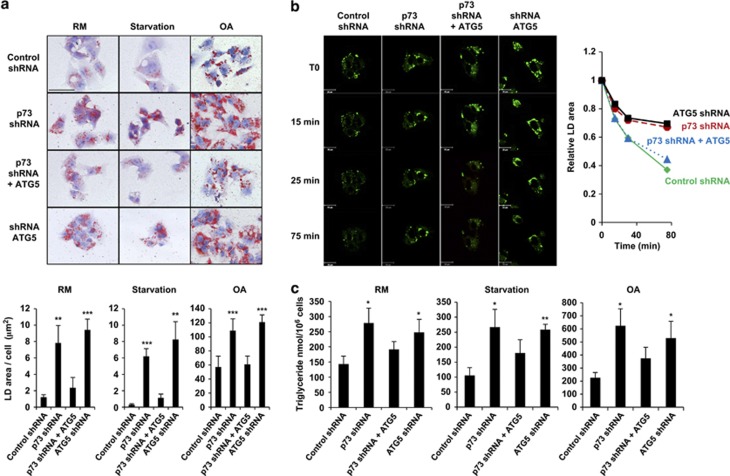
p73, a member of the p53 tumor suppressor family, is involved in neurogenesis, sensory pathways, immunity, inflammation, and tumorigenesis. How p73 is able to participate in such a broad spectrum of different biological processes is still largely unknown. Here, we report a novel role of p73 in regulating lipid metabolism by direct transactivation of the promoter of autophagy-related protein 5 (ATG5), a gene whose product is required for autophagosome formation. Following nutrient deprivation, the livers of p73-deficient mice demonstrate a massive accumulation of lipid droplets, together with a low level of autophagy, suggesting that triglyceride hydrolysis into fatty acids is blocked owing to deficient autophagy (macrolipophagy). Compared with wild-type mice, mice functionally deficient in all the p73 isoforms exhibit decreased ATG5 expression and lower levels of autophagy in multiple organs. We further show that the TAp73α is the critical p73 isoform responsible for inducing ATG5 expression in a p53-independent manner and demonstrate that ATG5 gene transfer can correct autophagy and macrolipophagy defects in p73-deficient hepatocytes. These data strongly suggest that the p73-ATG5 axis represents a novel, key pathway for regulating lipid metabolism through autophagy. The identification of p73 as a major regulator of autophagy suggests that it may have an important role in preventing or delaying disease and aging by maintaining a homeostatic control.


Figures

Figure 1
Figure 1
p73 deficiency leads to accumulation of LDs in hepatocytes after starvation both in vivo and in vitro. (a) Histology. Liver tissues after starvation were stained using H&E. p73-deficient mice show pathological vacuoles in virtually all hepatocytes (portal region and periphery; white arrows) after starvation. In WT mice, a few vacuoles were detected in the region near to the portal vein only. In addition, the hepatocytes of p73-deficient mice were larger and sinusoids (white arrow heads) were significantly smaller compared with those of WT mice. (Right) The size of the hepatocytes and the numbers of the vacuoles were analyzed in more than 100 cells and presented as the means±S.D.s of three different mice in each group. **P<0.01; ***P<0.001. Bar, 50 μm. Original magnification, × 630. Enlarged images are shown in Supplementary Figure S1. Vacuolization was even more pronounced in aged mice (Supplementary Figure S2). (b) Transmission electron microscopy. Liver sections from WT and p73-deficient mice with and without starvation (24 h) are shown. Vacuoles are homogeneous, lack any membrane, and have a round shape, suggesting that they represent LDs. LDs were indicated with black stars. Bar, 10 μm. Enlarged images are shown in Supplementary Figure S3. (c) Histology. Liver sections from WT and p73-deficient mice in the presence and absence of starvation (24 h) were stained using Sudan IV to detect lipids. Liver cells of p73-deficient mice were strongly Sudan IV-positive after starvation. Bars, 100 μm. (d) Immunohistochemistry. TIP47, a protein associated with LDs, was much more strongly expressed in hepatocytes of p73-deficient mice compared with WT mice after starvation (24 h). Bar, 50 μm. (e) Oil red O staining of HepG2 cells. Cells were infected with lentiviral control shRNA or p73 shRNA. HepG2 cells with normal and reduced p73 levels (g) were kept in a RM, starved or exposed to OA for 24 h before staining. p73-deficient HepG2 cells accumulate more LDs than do control cells under all conditions. Bar, 50 μm. Original magnification, × 630. (f) Histology. Skin sections from the indicated mice were stained using H&E. (Right) The thickness of subcutaneous fat was measured using the AxioVision software and normalized to that of WT mice (n=3 in each group). Bar, 100 μm. (g) Immunoblotting. HepG2 with p73 deficiency exhibit slightly increased levels of TIP47 and ATGL. Results are representative of three independent experiments
Figure 2
Figure 2
p73 regulates autophagy both in vivo and in vitro. (a) Immunoblotting. Livers and hearts were taken from WT and p73-deficient mice under normal feeding conditions and after food deprivation for 24 h (starvation). p73-deficient mice are unable to increase LC3-II levels and accumulate p62 upon starvation. Results are representative of three independent experiments. (Right) The fold changes in expression levels, compared with WT control, are presented. *P<0.05; **P<0.01, n=3. (b) Immunohistochemistry. The same tissues as in panel a were stained with anti-p62 antibody. The p73-deficient mice show slightly increased p62 levels compared with WT mice under normal conditions and a strong p62 accumulation after starvation. Bar, 50 μm. Original magnifications, × 630 and × 200 (lower right corners). Results are representative of three independent experiments. (c) Immunoblotting. HCT 116 cells were infected with lentiviral control shRNA or p73 shRNA. 48 h after infection, cells were starved in an EBSS medium for 1 h. Control (unspecific) shRNA-treated cells had higher LC3-II levels than did p73 shRNA-treated cells. Moreover, whereas the control shRNA-treated cells increased their LC3-II levels upon starvation, p73 shRNA-treated cells exhibited no response. LC3-I was not detectable in this experiment. (d) Autodot staining. Significantly increased staining after starvation was seen in control but not in p73-deficient HCT 116 cells. Bar, 20 μm. Similar results were obtained in HaCaT cells, including using other methods for inducing autophagy (see Supplementary Figure S8). (e) Immunoblotting. Saos-2 cells inducible for TAp73α were treated with doxycycline (2.5 μg/ml) for the indicated time periods. Increased levels of TAp73α resulted in increased LC3-II and reduced p62 levels. Other p73 and p63 isoforms, as well as p53, were without effect in this system (see Supplementary Figure S9)
Figure 3
Figure 3
p73 regulates ATG5 expression. (a) Immunoblotting. Saos-2 cells inducible for TAp73α were treated with doxycycline (2.5 μg/ml) for the indicated time periods. Expression levels of ATG1, ATG7, Beclin 1, monomeric ATG5, and the conjugated form of ATG5 (ATG5-ATG12) were investigated in two independent experiments. Increased levels of TAp73α resulted in increased monomeric ATG5 levels. TAp73β induction was associated with a slight increases of monomeric ATG5, whereas other members of the p53 family had no effect (see Supplementary Figure S10). (b) Quantitative real-time PCR. Saos-2 cells inducible for TAp73α were treated with doxycycline for the indicated time periods and ATG5 mRNA was measured. Values are means±S.D.s of three independent experiments. *P<0.05. (c) Quantitative real-time PCR (upper panel) and immunoblotting (lower panel). The indicated cells were treated with control shRNA and p73 shRNA. Values in the upper panel are means±S.D.s of three independent experiments. Reduced p73 expression was associated with reduced ATG5 expression at both mRNA and protein levels. p73 shRNA experiments were additionally controlled by real-time PCR (data not shown). (d) Immunohistochemistry (upper panel) and immunoblotting (lower panel). p73-deficient mice show significantly reduced ATG5 expression compared with WT mice. Bar, 50 μm. Original magnifications, × 630 and × 200 (lower right corners). Results are representative of three independent experiments
Figure 4
Figure 4
p73 transactivates the ATG5 gene promoter. (a) Two p53 response elements (red bars) were found in the ATG5 promoter. The core sequence of p53 response elements are indicated in red below. The blue arrow indicates the transcriptional start site. (b) The effect of different isoforms or mutant forms of p73 on the ATG5 promoter was assessed using a dual-luciferase assay in H1299 cells. Values are means±S.D.s of three independent experiments. (c) and (d) Full-length and truncated forms of the ATG5 promoter were generated (c) and dual-luciferase assays were performed in H1299 cells (d). Values are means±S.D.s of three independent experiments. (e) Dual-luciferase assays of p73 isoforms were performed in H1299 cell using a plasmid containing only the p53-RE I (site I). Values are means±S.D.s of three independent experiments. (f) ChIP assay. Saos-2 cells inducible for TAp73α and TAp73β were treated with doxycycline for 24 h. The eluted DNA was assessed by PCR using primers specific to the site I of the ATG5 promoter sequence
Figure 5
Figure 5
Downregulation of p73 results in the accumulation of LDs, which disappear following the ATG5 gene transfer. (a) Oil red O staining. HepG2 cells with modulated p73 and/or ATG5 levels (see immunoblots in Supplementary Figure S12) were kept in a RM, starved or exposed to OA for 24 h, and stained with oil red O to visualize LDs. LDs were further quantified using the Image Pro Plus software and data are presented below. p73- and ATG5-deficient cells were virtually unable to degrade LDs, whereas an ATG5 gene transfer corrected the defect in p73-deficient cells. Bar, 50 μm. Original magnification, x630. Values are means±S.D.s of three independent experiments **P<0.01; ***P<0.001. (b) BODIPY staining. The degradation of LDs in HepG2 cells was followed within 75 min upon starvation and quantified using the Imaris software and is presented on the right. ATG5 gene transfer helps to degrade LDs in p73-deficient cells with similar kinetics as is seen in control cells. Bar, 20 μm. (c) TG measurements. HepG2 cells with reduced p73 and/or ATG5 levels were kept in a RM, and starved or exposed to OA for 24 h before analysis. Cells with reduced p73 or ATG5 levels exhibited significantly increased TG contents. The increased TG content in p73-deficient cells was reversible following the ATG5 gene transfer. Values are means±S.D.s of three independent experiments *P<0.05; **P<0.01

References

    1. Li Y, Prives C. Are interactions with p63 and p73 involved in mutant p53 gain of oncogenic function. Oncogene. 2007;26:2220–2225. - PubMed
    1. Belyi VA, Levine AJ. One billion years of p53/p63/p73 evolution. Proc Natl Acad Sci USA. 2009;106:17609–17610. - PMC - PubMed
    1. Levine AJ, Tomasini R, McKeon FD, Mak TW, Melino G. The p53 family: guardians of maternal reproduction. Nat Rev Mol Cell Biol. 2011;12:259–265. - PubMed
    1. Tomasini R, Mak TW, Melino G. The impact of p53 and p73 on aneuploidy and cancer. Trends Cell Biol. 2008;18:244–252. - PubMed
    1. Tomasini R, Tsuchihara K, Tsuda C, Lau SK, Wilhelm M, Ruffini A, et al. TAp73 regulates the spindle assembly checkpoint by modulating BubR1 activity. Proc Natl Acad Sci USA. 2009;106:797–802. - PMC - PubMed

Publication types

MeSH terms