. 2014 Jan;59(1):202-15.
doi: 10.1002/hep.26662. Epub 2013 Nov 22.

MicroRNA-494 within an oncogenic microRNA megacluster regulates G1/S transition in liver tumorigenesis through suppression of mutated in colorectal cancer

Affiliations
Free PMC article

MicroRNA-494 within an oncogenic microRNA megacluster regulates G1/S transition in liver tumorigenesis through suppression of mutated in colorectal cancer

Lionel Lim et al. Hepatology. 2014 Jan.
Free PMC article

Abstract

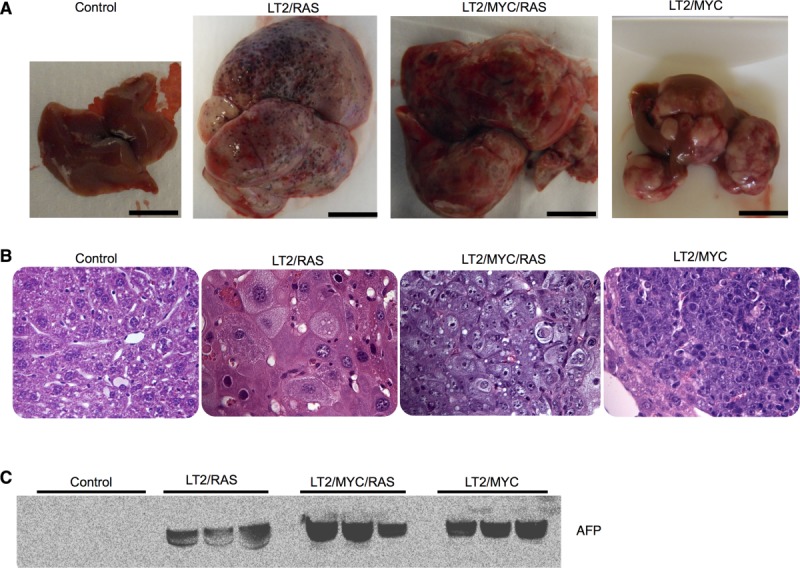
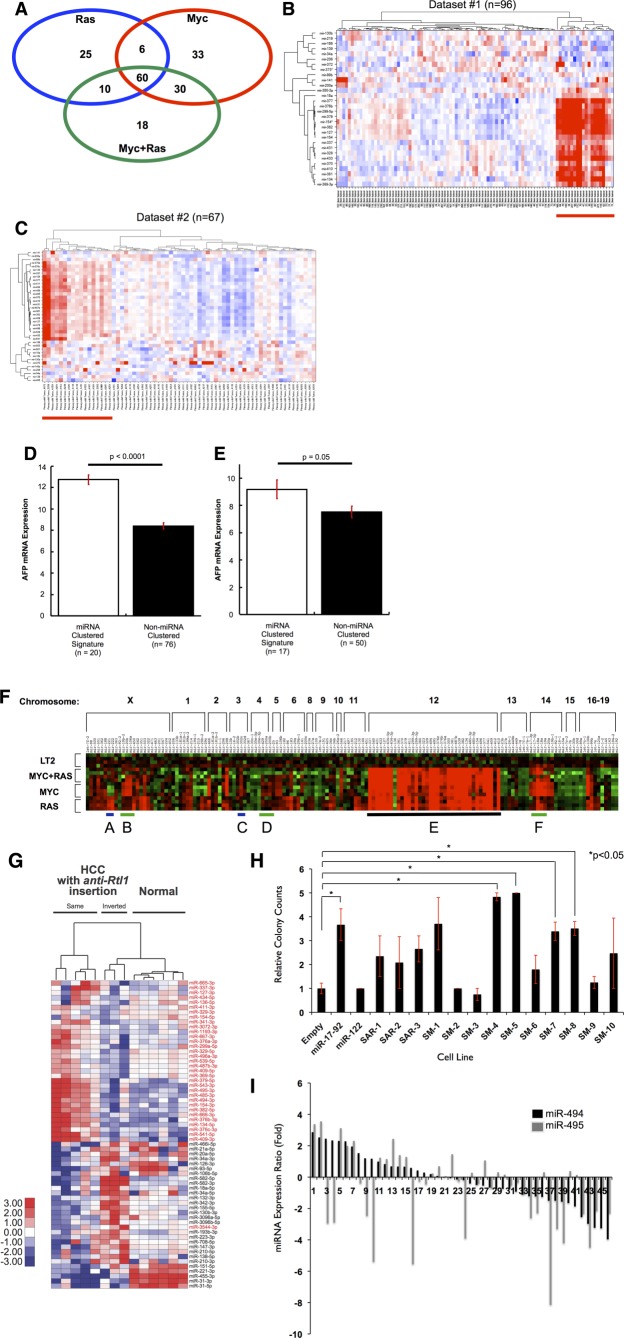
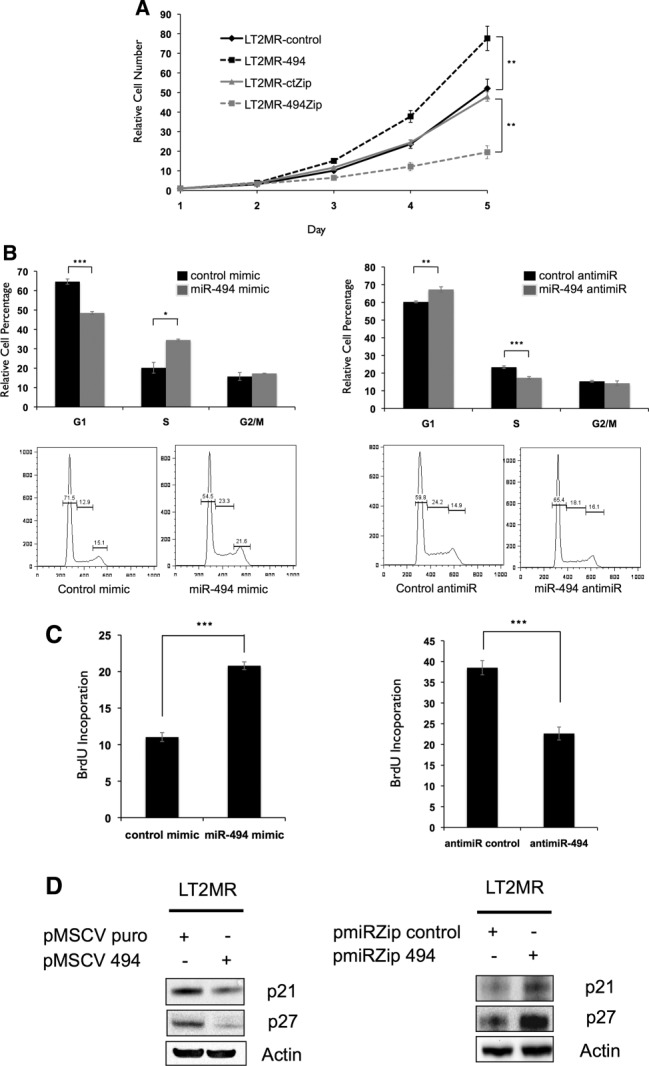
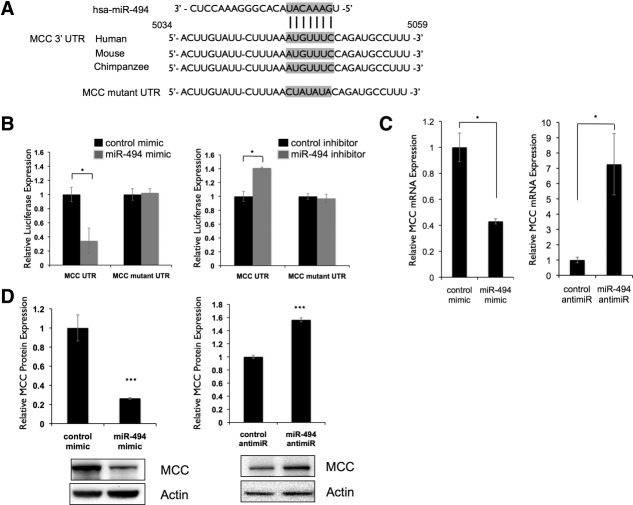
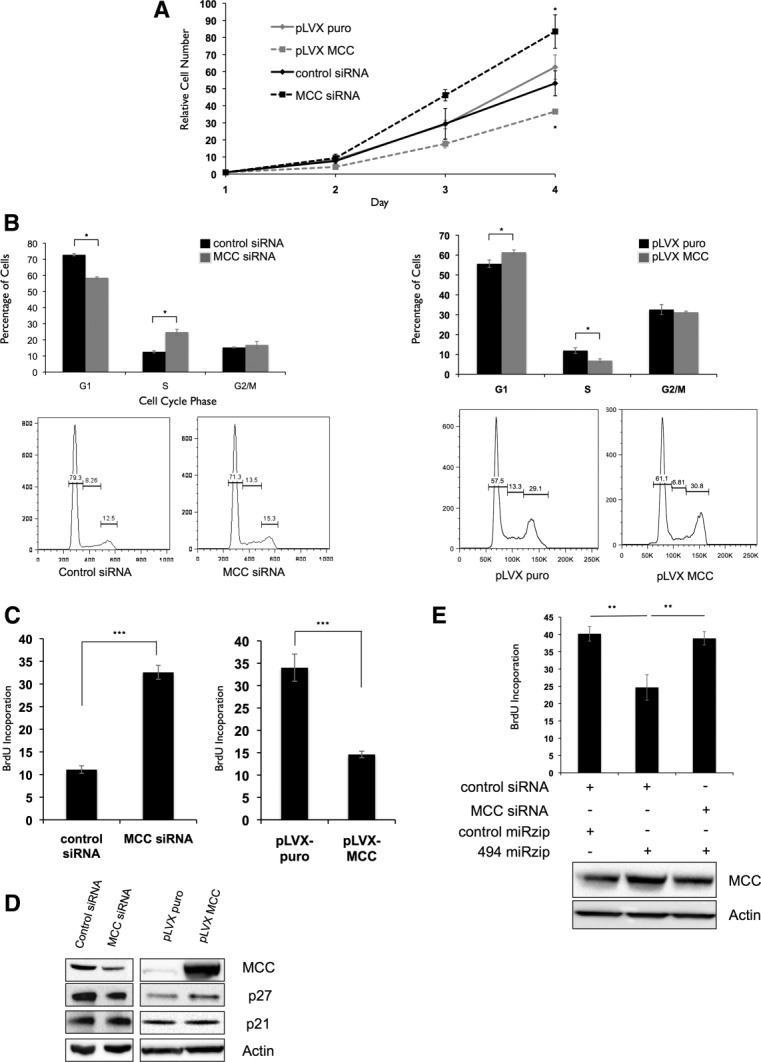
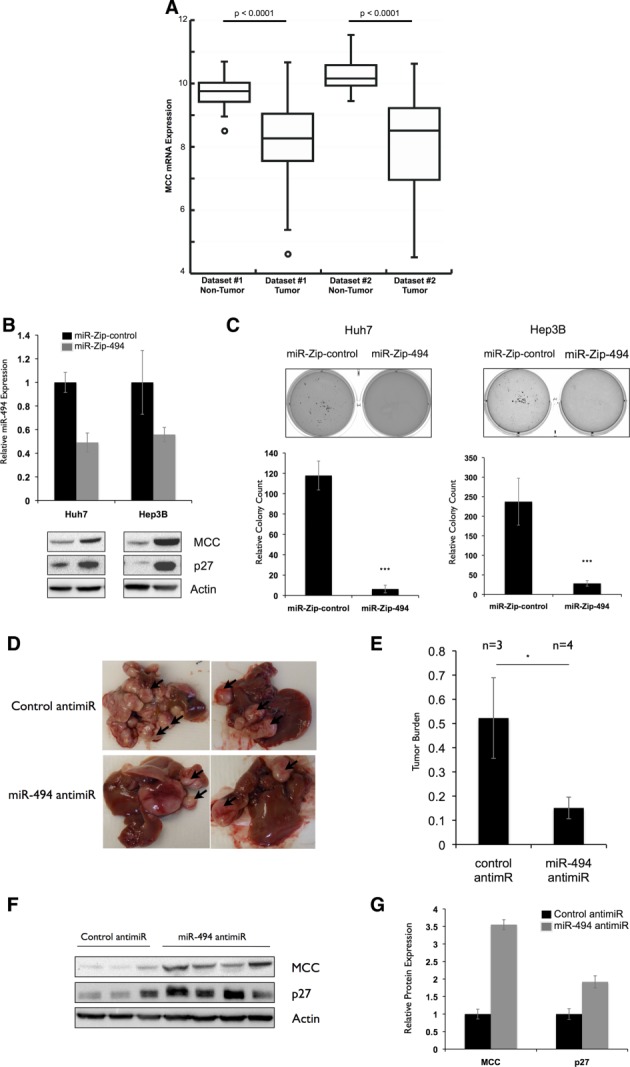
Hepatocellular carcinoma (HCC) is associated with poor survival for patients and few effective treatment options, raising the need for novel therapeutic strategies. MicroRNAs (miRNAs) play important roles in tumor development and show deregulated patterns of expression in HCC. Because of the liver's unique affinity for small nucleic acids, miRNA-based therapy has been proposed in the treatment of liver disease. Thus, there is an urgent need to identify and characterize aberrantly expressed miRNAs in HCC. In our study, we profiled miRNA expression changes in de novo liver tumors driven by MYC and/or RAS, two canonical oncogenes activated in a majority of human HCCs. We identified an up-regulated miRNA megacluster comprised of 53 miRNAs on mouse chromosome 12qF1 (human homolog 14q32). This miRNA megacluster is up-regulated in all three transgenic liver models and in a subset of human HCCs. An unbiased functional analysis of all miRNAs within this cluster was performed. We found that miR-494 is overexpressed in human HCC and aids in transformation by regulating the G1 /S cell cycle transition through targeting of the Mutated in Colorectal Cancer tumor suppressor. miR-494 inhibition in human HCC cell lines decreases cellular transformation, and anti-miR-494 treatment of primary MYC-driven liver tumor formation significantly diminishes tumor size.

Conclusion: Our findings identify a new therapeutic target (miR-494) for the treatment of HCC.


Figures

Figure 1
Figure 1
Dox-regulated expression of MYC or/and RAS oncogenes give rise to distinct liver tumors. (A) Gross morphology of representative control liver and tumors from each genotype are shown. Scale bar = 1 cm. (B) Hematoxylin and eosin histology from representative samples for control (LT2) liver and tumors from each genotype. Original magnification = 40×. (C) Western blotting for AFP, a liver cancer marker, which is expressed at high levels in all three liver tumor models and is absent in control livers (controls). Equal amounts of total protein for each sample were loaded and verified by Ponceau-S staining.
Figure 2
Figure 2
An miRNA megacluster containing multiple transforming miRNAs is up-regulated in mouse tumor models (A) Venn analysis of differentially expressed miRNAs in MYC, RAS, and MYC+RAS Tg mice indicate substantial overlap. MicroRNA signatures from each mouse line were analyzed using one-way ANOVA comparisons with a minimum fold change log2 >1 or <−1 at a P value <0.05. The intersection of the three signatures indicated that 60 miRNAs were commonly shared among these mice. Orthologs of these miRNAs were used for subsequent analysis in human HCC cohorts. (B and C) Distinct subsets of human HCC tumors with up-regulated miRNA orthologs of the 60-miRNA murine signature. Two-dimensional unsupervised hierarchical clustering of orthologous miRNAs was performed based on miRNAs from the murine signature. (B) Thirty for Dataset#1. (C) Thirty-eight for Dataset#2, TCGA LIHC. Red indicates miRNA up-regulation, blue indicates down-regulation on the heat maps. (D and E) AFP expression is elevated in human HCC tumors that exhibit high miRNA signature. Mean AFP mRNA expression is depicted, and error bars represent standard error of the mean. (D) Dataset#1; (E) Dataset#2. (F) Hierarchical clustering of all miRNAs located within 1 kilobase of each other in the mouse genome reveals an up-regulated megacluster on Chr12qF1 in mouse tumors (heat-map region E, underlined in black). miR-17-92 oncomiR cluster and its homologs are indicated with green lines (heat-map regions B, D, and F). RAS-regulated miR-221-222 cluster shows RAS specific expression (heat-map region A), whereas MYC regulated miR-302b-d cluster shows MYC specific expression (heat-map region C). (G) SB transposon integration in the same transcriptional orientation as the anti-Rtl1 cluster causes HCCs in mice, accompanied by an up-regulation of Dlk1-Dio3 miRNAs (indicated in red). This is compared to HCCs with inverted SB insertions in the anti-Rtl1 cluster and normal livers that have no Dlk1-Dio3 miRNA up-regulation. (H) Quantification of soft agar colonies formed by each LT2MR stable cell line. miR-17-92 and miR-122 were used as positive and negative controls, respectively. Values are average of three independent experiments. SM-4, -5, -7, and -8 subclusters significantly increased transformation, when compared to LT2MR cells stably expressing a control pMSCV vector (*P < 0.05). (I) Relative expression of miR-494 and miR-495 from 47 human HCC tumor and matched normal samples were analyzed by qRT-PCR. miRNA abundance was normalized to RNU48. Differences in expression are shown as fold change over matched normal tissue.
Figure 3
Figure 3
miR-494 increases proliferation through accelerated G1/S transition. (A) LT2MR cells undergo increased proliferation with enforced miR-494 expression and decreased proliferation with miR-494 inhibition. Fifty thousand cells were plated in triplicate and counted at days 1, 2, 3, 4, and 5 after transfection of pMSCV puro, pMSCV 494, pmiR-ZIP-control, or pmiR-ZIP-494. Cell numbers were normalized to day 1. Experiment was repeated three times, and values are from one representative experiment. **P = 0.01. (B) LT2MR cells exhibit accelerated G1/S transition with enforced miR-494 expression and G1/S delay with miR-494 inhibition. LT2MR cells transfected with miR-494 or control mimic and miR-494 or control inhibitor for 48 hours were stained with propidium iodide for fluorescence-activated cell sorting analysis. Cell-cycle profiles were analyzed using FlowJo analysis software (Tree Star, Inc., Ashland, OR). Experiment was done with three replicates per sample, and values were averaged to generate graphs (top panels). *P = 0.01; **P = 0.003; ***P = 0.001. Figure is representative of three experiments. (C) BrdU incorporation in miR-494 overexpressing cells. LT2MR cells were transfected with either miRNA mimics (left panel) or miRNA inhibitors (right panel) for 48 hours and exposed to BrdU for 40 minutes. Flow cytometry was used to measure BrdU incorporation. Experiment was repeated three times with three replicates per sample, and values are from one representative experiment. ***P = 0.008. (D) Expression of cell-cycle inhibitors corresponds to proliferation. Stable cell lines with either increased (left panel) or decreased miR-494 (right panel) expression were generated and tested for expression of p27 and p21 by western blotting.
Figure 4
Figure 4
MCC is a direct target of miR-494. (A) Putative binding site of miR-494 in MCC 3′ UTR is conserved across multiple species. Alignment of human, mouse, and chimpanzee MCC 3′ UTRs shows a highly conserved region predicted to bind to miR-494. Predicted 7-mer binding seed of miR-494 to MCC 3′ UTR indicated with vertical lines. Putative binding site was mutated as indicated. (B) MCC 3′ UTR is a direct target of miR-494. A 300-bp region of the MCC 3′ UTR containing the predicted miR-494-binding site was cloned into a pMIR-REPORT luciferase vector. Activity of the reporter was decreased when cotransfected into LT2MR cells with miR-494 mimic and increased when cotransfected with miR-494 antimiR, compared to control cotransfections. *P < 0.05. In both cases, site-directed mutagenesis of the predicted miR-494-binding site resulted in loss of reporter response. (C) MCC mRNA expression is responsive to miR-494. LT2MR cells were transfected with miR-494 mimic or hairpin inhibitor and tested for MCC mRNA expression after 24 hours by qRT-PCR. Values normalized to sno202 and expressed relative to control transfected cells. *P < 0.05. (D) MCC protein expression is responsive to miR-494. LT2MR cells were transfected with miR-494 mimic or inhibitor and tested for MCC protein expression after 48 hours by western blotting. Graph is an average of three independent transfections, and values were quantified using a Bio-Rad ChemiDoc (Bio-Rad, Hercules, CA). ***P < 0.001.
Figure 5
Figure 5
miR-494 modulates G1/S transition through suppression of MCC expression. (A) LT2MR cells undergo increased proliferation with MCC inhibition and decreased proliferation with enforced MCC expression. Experiments were repeated three times, and values are from one representative experiment. (B) LT2MR cells exhibit accelerated G1/S transition with MCC inhibition and G1/S delay with MCC overexpression. LT2MR cells transfected with control or MCC siRNA (top panel), and pLVX puro or pLVX MCC for 48 hours were stained with propidium iodide for fluorescence-activated cell sorting analysis. Cell-cycle profiles were analyzed using FlowJo analysis software (Tree Star, Inc., Ashland, OR). Experiment was done with three replicates per sample, and the figure is representative of three experiments. (C) Increased proliferation is the result of accelerated G1/S transition in MCC siRNA-transfected cells. LT2MR cells were transfected with either control or MCC siRNA (left panel) or pLVX puro or pLVX MCC (right panel) for 48 hours and exposed to BrdU for 40 minutes. Flow cytometry was used to measure BrdU incorporation. Experiment was repeated three times with three replicates per sample, and values are from one representative experiment. ***P < 0.001. (D) Expression of cell-cycle inhibitors corresponds to proliferation rate. LT2MR cells were transfected with either control or MCC siRNA (left panel) or pLVX puro or pLVX MCC (right panel) for 48 hours and tested for expression of p27 and p21 by western blotting. (E) Down-regulation of MCC attenuates the effects of miR-494 inhibition on cell proliferaion. LT2MR cells were transfected with pmiRZip control or pmiRZip 494 and control or MCC siRNA as indicated and tested for MCC expression after 48 hours by western blotting. Cell proliferation was assessed in these cells by measuring BrdU uptake over a period of 40 minutes. **P < 0.01.
Figure 6
Figure 6
miR-494 inhibition decreases transformation in human and mouse HCC models. (A) Decreased MCC mRNA expression in two human HCC data sets. MCC mRNA expression in tumor versus nontumor tissues is shown for the Burchard (Dataset#1) and TCGA LIHC (Dataset#2). The bottom and top of the boxes indicate the first and third quartiles; the band inside the box is the median value. Whiskers represent the minimum and maximum values; points indicate outliers. (B) miR-494 knockdown increases MCC expression in Huh7 and Hep3B cells. miR-494 was stably knocked down in Huh7 and Hep3B cell lines with p-miR-ZIP-494. miR-494 expression was tested by qRT-PCR and calculated relative to p-miR-ZIP-control cell lines. MCC and p27 expression was tested by western blotting. (C) miR-494 inhibition decreases colony formation in Huh7 and Hep3B cells. Stable p-miR-ZIP control or 494 Huh7 and Hep3B cells were plated in soft agar for 2 weeks. Experiment was repeated three times in triplicate. ***P < 0.001. (D and E) miR-494 inhibition decreases liver tumor growth in vivo. (D) Representative pictures of livers of LT2/MYC mice (35) injected with control (n = 3) or miR-494 (n = 4) anti-miRs over a period of 3 weeks (total 8 weeks off Dox) twice a week. (E) Relative tumor burden in mice as quantified by ImageJ software (National Institutes of Health, Bethesda, MD). *P < 0.05. (F and G) miR-494 inhibition increases MCC and p27 expression in vivo. (F) Protein expression of MCC and p27 in liver tumors of control and miR-494 anti-miR-injected mice. (G) Anti-miR-494-treated tumors show increased MCC and p27 protein expression. Protein expression values were quantified using Bio-Rad ChemiDoc software (Bio-Rad, Hercules, CA). MCC and p27 expression was normalized to actin, and the average expression of each protein was calculated in each treatment group to generate the graph.

References

    1. Bosch FX, Ribes J, Díaz M, Cléries R. Primary liver cancer: worldwide incidence and trends. Gastroenterology. 2004;127:S5–S16. - PubMed
    1. Schlaeger C, Longerich T, Schiller C, Bewerunge P, Mehrabi A, Toedt G, et al. Etiology-dependent molecular mechanisms in human hepatocarcinogenesis. Hepatology. 2008;47:511–520. - PubMed
    1. Gan FY, Gesell MS, Alousi M, Luk GD. Analysis of ODC and c-myc gene expression in hepatocellular carcinoma by in situ hybridization and immunohistochemistry. J Histochem Cytochem. 1993;41:1185–1196. - PubMed
    1. Newell P, Toffanin S, Villanueva A, Chiang DY, Minguez B, Cabellos L, et al. Ras pathway activation in hepatocellular carcinoma and anti-tumoral effect of combined sorafenib and rapamycin in vivo. J Hepatol. 2009;51:725–733. - PMC - PubMed
    1. Calvisi DF, Ladu S, Gorden A, Farina M, Conner EA, Lee JS, et al. Ubiquitous activation of Ras and Jak/Stat pathways in human HCC. Gastroenterology. 2006;130:1117–1128. - PubMed

Publication types