. 2013 Aug;2(4):295-306.
doi: 10.1089/biores.2013.0012.

Transplantated mesenchymal stem cells derived from embryonic stem cells promote muscle regeneration and accelerate functional recovery of injured skeletal muscle

Affiliations

Transplantated mesenchymal stem cells derived from embryonic stem cells promote muscle regeneration and accelerate functional recovery of injured skeletal muscle

Nana Takenaka Ninagawa et al. Biores Open Access. 2013 Aug.

Abstract

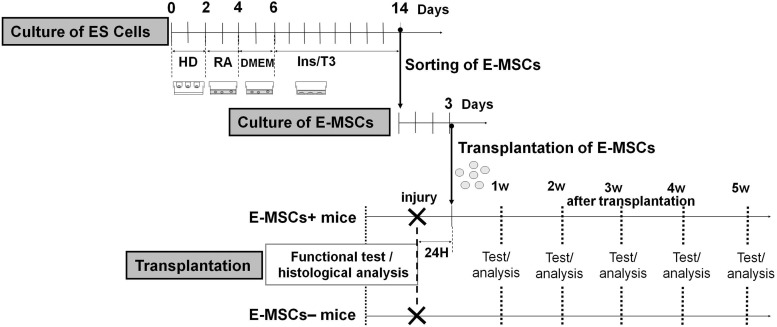
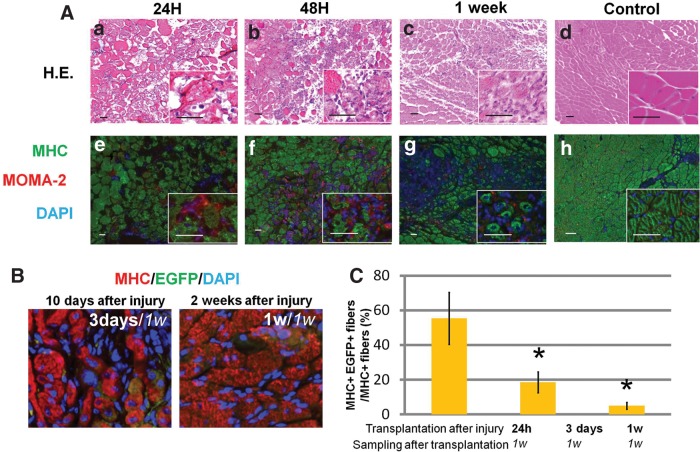
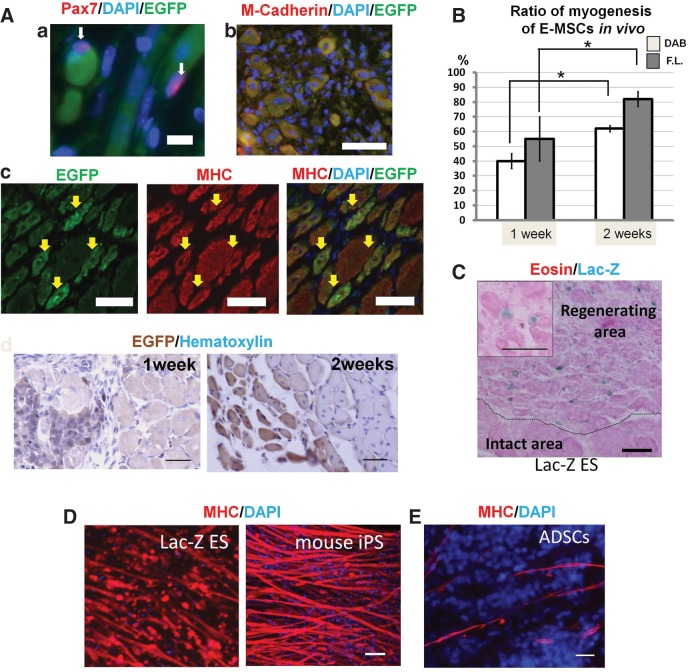
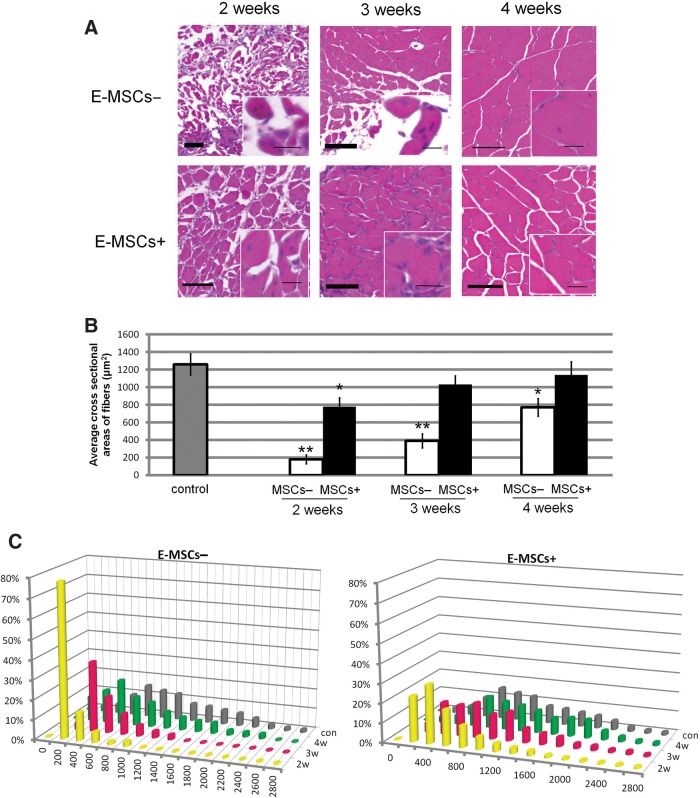
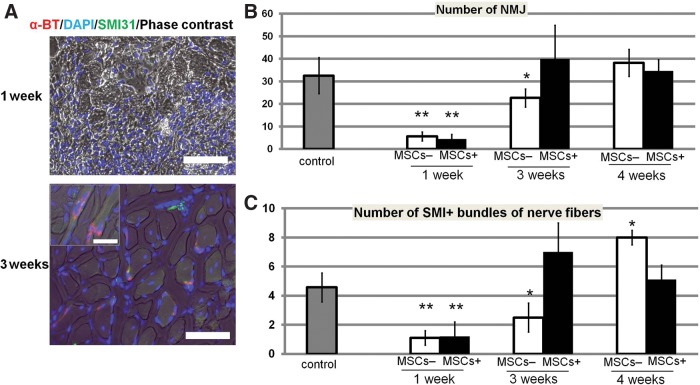
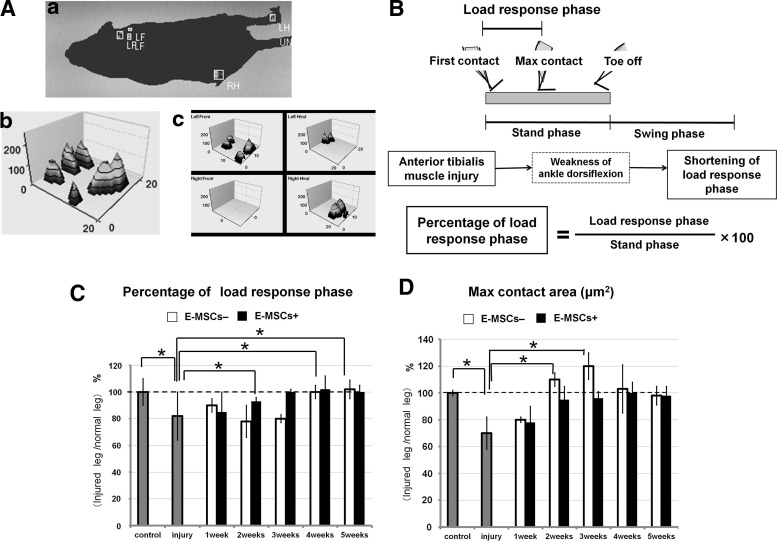
We previously established that mesenchymal stem cells originating from mouse embryonic stem (ES) cells (E-MSCs) showed markedly higher potential for differentiation into skeletal muscles in vitro than common mesenchymal stem cells (MSCs). Further, the E-MSCs exhibited a low risk for teratoma formation. Here we evaluate the potential of E-MSCs for differentiation into skeletal muscles in vivo and reveal the regeneration and functional recovery of injured muscle by transplantation. E-MSCs were transplanted into the tibialis anterior (TA) muscle 24 h following direct clamping. After transplantation, the myogenic differentiation of E-MSCs, TA muscle regeneration, and re-innervation were morphologically analyzed. In addition, footprints and gaits of each leg under spontaneous walking were measured by CatWalk XT, and motor functions of injured TA muscles were precisely analyzed. Results indicate that >60% of transplanted E-MSCs differentiated into skeletal muscles. The cross-sectional area of the injured TA muscles of E-MSC-transplanted animals increased earlier than that of control animals. E-MSCs also promotes re-innervation of the peripheral nerves of injured muscles. Concerning function of the TA muscles, we reveal that transplantation of E-MSCs promotes the recovery of muscles. This is the first report to demonstrate by analysis of spontaneous walking that transplanted cells can accelerate the functional recovery of injured muscles. Taken together, the results show that E-MSCs have a high potential for differentiation into skeletal muscles in vivo as well as in vitro. The transplantation of E-MSCs facilitated the functional recovery of injured muscles. Therefore, E-MSCs are an efficient cell source in transplantation.

Keywords: CD105; MSC; embryonic stem cells; functional recovery; regeneration of skeletal muscle.


Figures

FIG. 1.
FIG. 1.
Scheme of experimental processes and time schedule using E-MSCs. The experiment was composed of three main processes. The first process was induction of E-MSCs and their sorting. The second was expansion of the population of E-MSCs. The final process was the transplantation of E-MSCs and the analysis of the effects. When CD105+ cells increased and reached the maximum population (day 14), they were isolated and sorted by MACS separation system and termed E-MSCs. After that, they were cultured in MSC culture medium for 3 days. Finally, E-MSCs (1×10⁵ cells) were transplanted into injured TA muscles, 24 h after crushing. E-MSCs, mesenchymal stem cells originating from mouse embryonic stem cells; TA, tibialis anterior; ES, embryonic stem (cell); HD, hanging drop; RA, retinoic acid treatment; DMEM, Dulbecco's modified Eagle's medium (normal ES culture medium); Ins/T3, adipogenic medium; T3, triiodothyronine.
FIG. 2.
FIG. 2.
Crush injury models. (A) Alteration of skeletal muscles after crush injury. At 24 h after crush injury, muscle fibers were significantly impaired, but their contours in cross sections were still recognizable (a, e). After 48 h, many macrophages (red) had infiltrated injured muscle tissues dynamically (b, f). After 1 week, injured muscle fibers almost degenerated, and a small number of regenerating muscle fibers with nuclei at the center of each fiber appeared (c, g). Control (noninjured) muscle fibers are shown for comparison (d, h). (a–d) Hematoxylin and eosin (H-E) staining; (e–h) fluorescent immunostaining. MHC (green), MOMA-2 (red), 4′,6-diamidino-2-phenylindole (DAPI; blue). Insets: Higher magnifications of each image. Scale bars=50 μm. (B) Cross sections of SCID mice 1 week after the transplantation. Some MHC+ cells (red), a marker of mature skeletal muscle fiber, were colocalized with enhanced green fluorescent protein–positive (EGFP+) cells (green) derived from E-MSCs. E-MSCs were transplanted 3 days (10 days after injury; left image) and 1 week (2 weeks after injury; right image) after the crush injury. (C) The sum of all MHC+ muscle fibers in the transplanted area was taken as 100%, and the percentages of EGFP and MHC double-positive muscle fibers were calculated. A high ratio of myogenesis from E-MSCs transplanted 24 h post-injury is shown. With transplantation 1 week after crush injury, EGFP and MHC double-positive skeletal muscles decreased significantly. Twenty random visual fields in each group were measured; (*p<0.05).
FIG. 3.
FIG. 3.
Confirmation of potential for differentiation into skeletal muscles of MSCs derived from several ES cell and iPS cell lines. (A) Regeneration of injured muscles and myogenesis of transplanted E-MSCs are demonstrated after 1 and 2 weeks of transplantation. (a) A major muscle satellite cell marker, Pax7 (red), was expressed (white arrows) in a nucleus (blue). Pax7-positive nucleus indicated by arrow is attached to EGFP-positive muscle cells (green) originating from E-MSCs. Scale bar=10 μm. (b) M-cadherin (red), a marker of myoblasts, was co-localized with EGFP+ cells (green) derived from E-MSCs. Scale bar=50 μm. (c) After transplantation, EGFP+ cells were identified among injured muscles of SCID mice. Yellow arrows indicate transplanted cells that express EGFP. Regenerating muscle fibers with nuclei located at the center of the cells and occasionally appearing as multinuclear cells in the cross section showed MHC immunoreactivity. Yellow arrows indicate MHC+ cells (shown in green). Some EGFP+ cells expressed MHC immunoreactivity. Scale bar=50 μm. (d) EGFP+ cells indicating transplanted cells were revealed by horseradish peroxidase (HRP) histochemistry and turned brown, and nuclei were stained by hematoxylin at 1 week and 2 weeks after transplantation. Scale bar=50 μm. (B) High ratio of myogenesis among transplanted E-MSCs. The sum of all EGFP+ cells in the transplanted area was taken as 100% and the percentages of EGFP and MHC double-positive muscle fibers were calculated at 1 week and 2 weeks after transplantation (gray bars indicated as calculation by fluorescent staining [F.L.]). At 2 weeks post-transplantation, EGFP and MHC double-positive skeletal muscles increased significantly. EGFP+ muscle fibers were also calculated by HRP immunohistochemistry (white bars indicated as 3,3′-diaminobenzidine [DAB]) and in the serial section stained with eosin. High ratio of myogenesis from transplanted E-MSCs is shown. *p<0.05. (C) Histology of the regenerative process 1 week after transplantation. MSCs derived from Lac-Z ES cells were stained with X-gal staining (nuclei in blue). Myofibers were stained with eosin. Transplanted cells expressing X-gal were detected at the regenerating area of the transplanted muscle, but not at the intact area. Inset: Higher magnification shows muscle fibers derived from Lac-Z ES cells including nuclei stained with X-gal (blue). Scale bar=50 μm. (D) MHC was expressed with high efficiency in the skeletal muscle fibers derived from Lac-Z ES cells (left) and mouse iPS cells (right). Scale bar=50 μm. (E) Potentials for differentiation into skeletal muscles of ADSCs in vitro was limited. We incubated MSCs from adipose tissue (regular MSCs; ADSCs) under the same conditions that induced myogenesis with high potential in E-MSCs (∼40%),13 but ADSCs showed very low myogenic potential (∼2%). Scale bars=50 μm.
FIG. 4.
FIG. 4.
Acceleration of recovery by transplanted E-MSCs. (A) Histology of the recovery process 2, 3, and 4 weeks after transplantation (E-MHCs+, bottom) were colored with H-E staining and the cross-sectional area was compared to that of animals without transplantation (E-MHC, top). The newly formed muscle fibers were stained with eosin (red), gradually expanded in cross-sectional area, and became mature muscle fibers in turn. Insets: Higher magnifications, representing injured muscle histology and regeneration by position of nuclei stained with hematoxylin (blue) in muscle fibers. The centronucleated fiber is a hallmark of muscle regeneration, indicating newly formed muscle fibers. In mature muscle fibers, the nucleus exists in a marginal part. Scale bars=20 μm for insets; 100 μm for main image. (B) Average cross-sectional areas of MSC+ and MSC injured TA muscle fibers (*p<0.05; **p<0.01). MSC+ muscles had increased cross-sectional areas earlier than MSC muscles. (C) Frequency histograms showing the distribution of cross-sectional areas of myofibers in muscles of control animals that were injured but not E-MSC–transplanted (gray bar), injured muscles after E-MSC transplantation (yellow bar), injured muscles 3 weeks after transplantation (red bar), and injured muscles 4 weeks after transplantation (green bars), respectively. Percentile histograms of cross-sectional area of TA muscle fibers in MSC+ and MSC muscles are compared in these graphs. Twenty random sections in three animals in both groups were measured.
FIG. 5.
FIG. 5.
Earlier regeneration of neuromuscular junctions (NMJs) by transplantation of E-MSCs. (A) NMJs in regenerating TA muscle with transplantation of MSCs are demonstrated by Alexa Fluor 594–conjugated α-bungarotoxin (α-BT) and indicated in red. Neurofilaments stained with SMI-31 are in green and nuclei are in blue with DAPI. Although α-BT and SMI-31 immunoreactivity almost disappeared 1 week after transplantation, NMJs indicated by α-BT and SMI-31 immunoreactivities were clearly recognized after 3 weeks. Scale bars=50 μm, 10 μm for insets. (B) NMJs per each cross section of injured MSC+ and MSC TA muscles. Twenty random sections in three animals in both groups were measured (*p<0.05, **p<0.01). (C) SMI-31+ bundles of nerve fibers in each cross section of injured MSC+ and MSC TA muscles. Twenty random sections in three animals in both groups were measured (*p<0.05, **p<0.01).
FIG. 6.
FIG. 6.
Functional recovery of injured muscles with or without transplantation of E-MSCs. (A) Animals were placed at one end of a runway (150 cm long, 20 cm wide, with opaque walls 20 cm in height), and usually crossed the distance spontaneously. Video recording was conducted from below through a transparent glass floor (see Supplementary Video). Using frame-by-frame playback, the individual footprints (a) and a number of “single-paw” (b, c) and interlimb coordination parameters were obtained as follows: 1. Stance Phase Duration, time of paw contact with the glass floor; 2. Load Response Phase Duration, time of first heel contact with maximum foot contact; and 3. Maximum Contact Area, total surface area of the glass floor contacted by the paw during the complete stance phase, which would decrease if the animal was attempting to avoid placing a certain part of the plantar hind paw on the floor. (B) Measurement of functional recovery of injured skeletal muscles. A step cycle is made up of two phases: the swing phase, and stand phase that involves a load-response phase. The percentage of the load-response phase was used for the evaluation index of functional recovery of injured TA muscles. (C) Percentage of load-response phase. Two weeks after injury, animals with transplantation (MSC+) significantly increased the percentage of the load-response phase, and their legs began to recover functionally. After 3 weeks, the percentage of the load-response phase almost reached a normal level. Meanwhile, legs of sham animals (MSC) began to recover at 3 weeks and the response phase reached the normal level at 4 weeks. Broken lines indicate normal levels (*p<0.05). (D) Maximum contact area. One week after injury, both groups (MSC+, MSC) showed reduction of maximum contact area because of the escape behavior from lameness. After 2 weeks, sham-operated animals (MSC) showed excess abnormal contact area. Animals with transplantation (MSC+) did not exhibit such abnormal expansion of maximum contact area, although the sham group (MSC) still showed it at 4 weeks. After 5 weeks, the sham group (MSC) showed the normal level (*p<0.05).

References

    1. Cossu G. Mavilio F. Myogenic stem cells for the therapy of primary myopathies: wishful thinking or therapeutic perspective? J Clin Invest. 2000;105:1669–1674. - PMC - PubMed
    1. Hardy K. Carthew P. Handyside AH, et al. Extragonadal teratocarcinoma derived from embryonal stem cells in chimaeric mice. J Pathol. 1990;160:71–76. - PubMed
    1. Barberi T. Bradbury M. Dincer Z, et al. Derivation of engraftable skeletal myoblasts from human embryonic stem cells. Nat Med. 2007;13:642–648. - PubMed
    1. Sakurai H. Okawa Y. Inami Y, et al. Paraxial mesodermal progenitors derived from mouse embryonic stem cells contribute to muscle regeneration via differentiation into muscle satellite cells. Stem Cells. 2008;26:1865–1873. - PubMed
    1. Mizuno Y. Chang H. Umeda K, et al. Generation of skeletal muscle stem/progenitor cells from murine induced pluripotent stem cells. FASEB J. 2010;24:2245–2253. - PubMed

LinkOut - more resources