

Global analysis of anthropogenic debris ingestion by sea turtles
- PMID: 23914794
- PMCID: PMC4204513
- DOI: 10.1111/cobi.12126
Global analysis of anthropogenic debris ingestion by sea turtles
Abstract
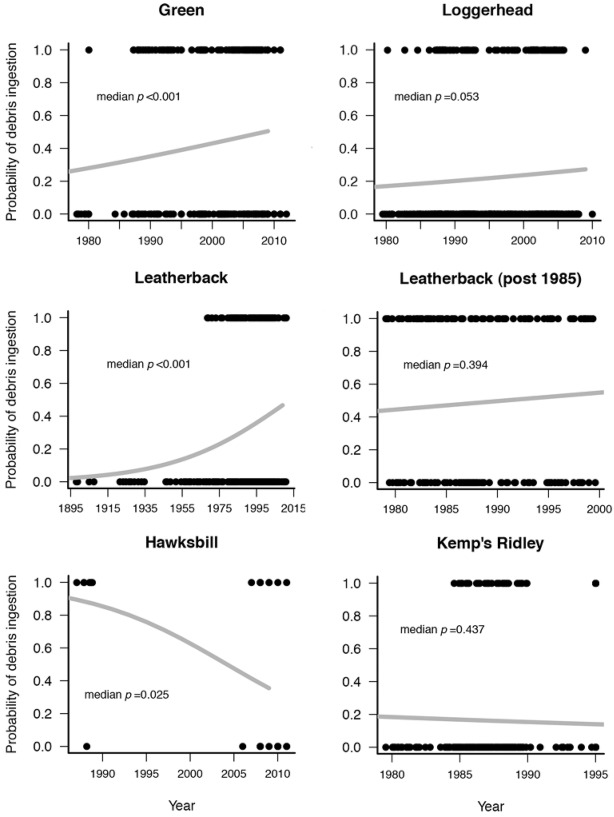
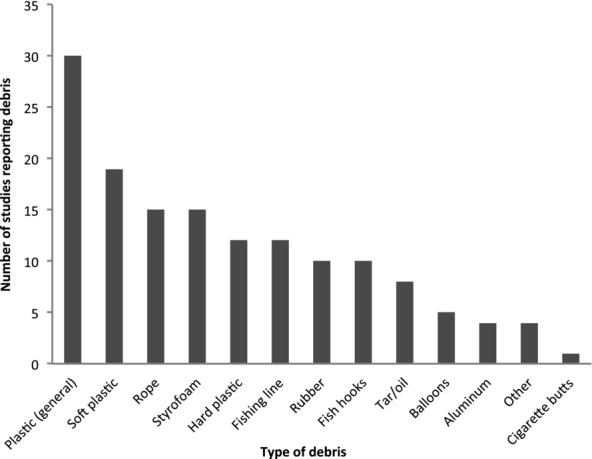
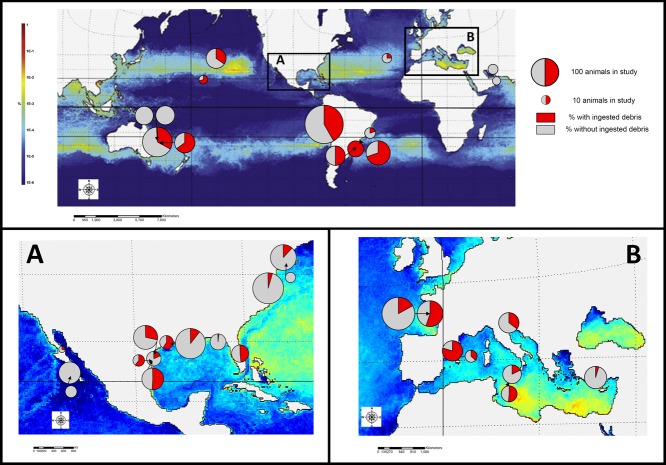
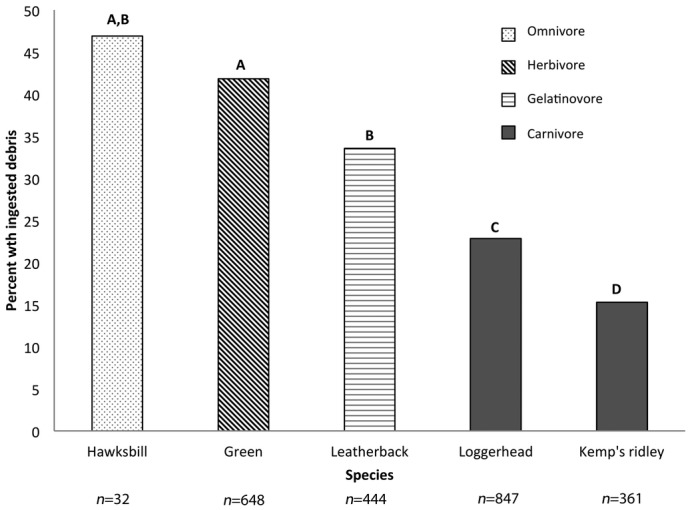
Ingestion of marine debris can have lethal and sublethal effects on sea turtles and other wildlife. Although researchers have reported on ingestion of anthropogenic debris by marine turtles and implied incidences of debris ingestion have increased over time, there has not been a global synthesis of the phenomenon since 1985. Thus, we analyzed 37 studies published from 1985 to 2012 that report on data collected from before 1900 through 2011. Specifically, we investigated whether ingestion prevalence has changed over time, what types of debris are most commonly ingested, the geographic distribution of debris ingestion by marine turtles relative to global debris distribution, and which species and life-history stages are most likely to ingest debris. The probability of green (Chelonia mydas) and leatherback turtles (Dermochelys coriacea) ingesting debris increased significantly over time, and plastic was the most commonly ingested debris. Turtles in nearly all regions studied ingest debris, but the probability of ingestion was not related to modeled debris densities. Furthermore, smaller, oceanic-stage turtles were more likely to ingest debris than coastal foragers, whereas carnivorous species were less likely to ingest debris than herbivores or gelatinovores. Our results indicate oceanic leatherback turtles and green turtles are at the greatest risk of both lethal and sublethal effects from ingested marine debris. To reduce this risk, anthropogenic debris must be managed at a global level.
Keywords: Caretta caretta; Dermochelys coriacea; Eretmochelys imbricata; Lepidochelys kempii; basura; escombros; garbage; litter; residuos; rubbish; trash.
© 2013 The Authors. Conservation Biology published by Wiley Periodicals, Inc., on behalf of the Society for Conservation Biology.
Figures
References
-
- Ashmole NP, Ashmole MJ. Comparative feeding ecology of sea birds of a tropical oceanic island. New Haven, Connecticut: Peabody Museum of Natural History, Yale University; 1967.
-
- Balazs G. Impact of ocean debris on marine turtles: entanglement and ingestion. In: Shomura RS, Yoshido HO, editors. Proceedings of the workshop on the fate and impact of marine debris. U.S. National Oceanic and Atmospheric Administration (NOAA) Technical memorandum 54. Honolulu: National Marine Fisheries Service; 1985. pp. 387–429.
-
- Ballance A, Ryan PG, Turpie JK. How much is a clean beach worth? The impact of litter on beach users in the Cape Peninsula, South Africa. South African Journal of Science. 2000;96:210–213.
-
- Bell I. Algivory in hawksbill turtles: Eretmochelys imbricata food selection within a foraging area on the Northern Great Barrier Reef. Marine Ecology. 2012;34:43–55.
-
- Bjorndal K. Foraging ecology and nutrition of sea turtles. In: Lutz PL, Musick JA, editors. The biology of sea turtles. Boca Raton, Florida: CRC Press; 1997. pp. 199–232.
Publication types
MeSH terms
Substances
LinkOut - more resources
Full Text Sources
Other Literature Sources
