. 2013 Aug 2:14:530.
doi: 10.1186/1471-2164-14-530.

A comprehensive metatranscriptome analysis pipeline and its validation using human small intestine microbiota datasets

Affiliations

A comprehensive metatranscriptome analysis pipeline and its validation using human small intestine microbiota datasets

Milkha M Leimena et al. BMC Genomics. .

Abstract

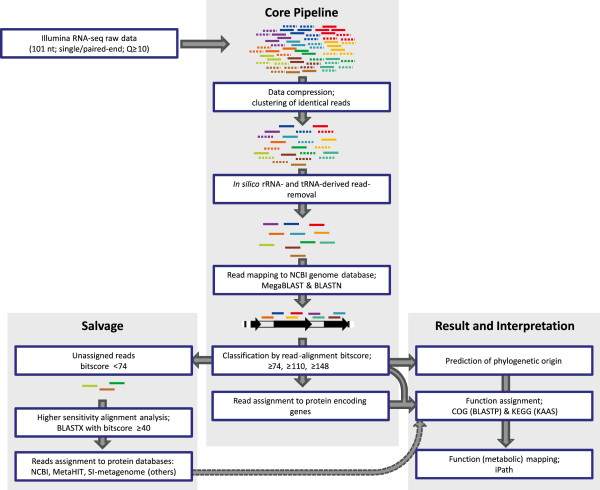
Background: Next generation sequencing (NGS) technologies can be applied in complex microbial ecosystems for metatranscriptome analysis by employing direct cDNA sequencing, which is known as RNA sequencing (RNA-seq). RNA-seq generates large datasets of great complexity, the comprehensive interpretation of which requires a reliable bioinformatic pipeline. In this study, we focus on the development of such a metatranscriptome pipeline, which we validate using Illumina RNA-seq datasets derived from the small intestine microbiota of two individuals with an ileostomy.

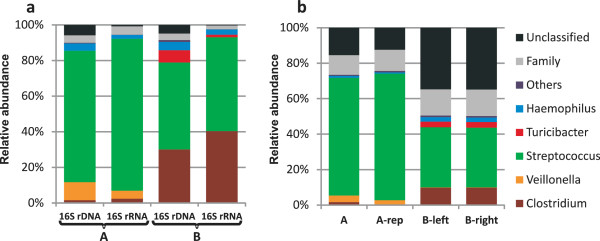
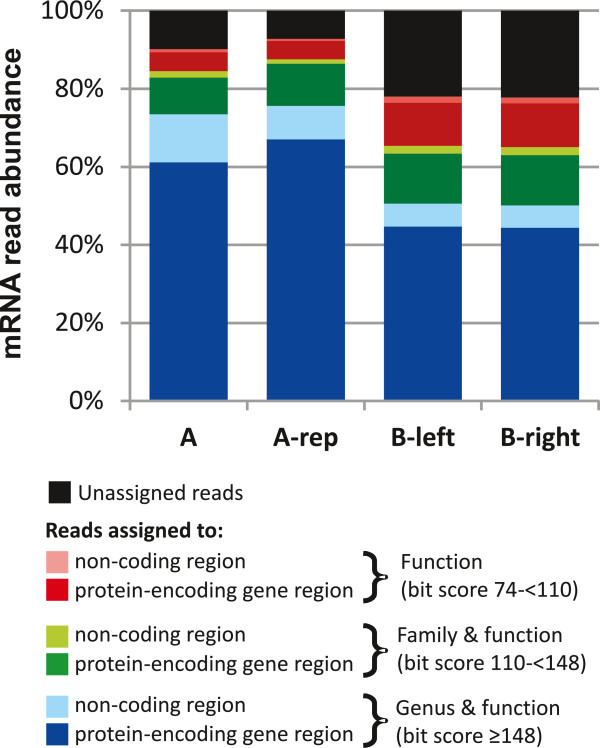
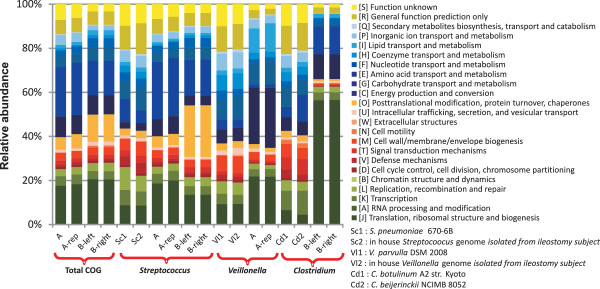
Results: The metatranscriptome pipeline developed here enabled effective removal of rRNA derived sequences, followed by confident assignment of the predicted function and taxonomic origin of the mRNA reads. Phylogenetic analysis of the small intestine metatranscriptome datasets revealed a strong similarity with the community composition profiles obtained from 16S rDNA and rRNA pyrosequencing, indicating considerable congruency between community composition (rDNA), and the taxonomic distribution of overall (rRNA) and specific (mRNA) activity among its microbial members. Reproducibility of the metatranscriptome sequencing approach was established by independent duplicate experiments. In addition, comparison of metatranscriptome analysis employing single- or paired-end sequencing methods indicated that the latter approach does not provide improved functional or phylogenetic insights. Metatranscriptome functional-mapping allowed the analysis of global, and genus specific activity of the microbiota, and illustrated the potential of these approaches to unravel syntrophic interactions in microbial ecosystems.

Conclusions: A reliable pipeline for metatransciptome data analysis was developed and evaluated using RNA-seq datasets obtained for the human small intestine microbiota. The set-up of the pipeline is very generic and can be applied for (bacterial) metatranscriptome analysis in any chosen niche.


Figures

Figure 1
Figure 1
Flow diagram of the bioinformatics analysis pipeline. The rRNA/tRNA reads were removed from the unique Illumina reads using SortMeRNA software followed by BLASTN alignment to NCBI and SILVA ribosomal databases. The mRNA reads are assigned to the prokaryote genomes of NCBI using MegaBLAST followed by BLASTN, followed by classification according to alignment bit scores using a minimum bit score of 148 and 110 for prediction of phylogenetic origin at genus and family level, respectively. The genome assigned reads were classified into protein encoding or non-coding reads, followed by COG and KEGG functional annotation and metabolic mapping. Additional functional assignment was performed for evaluation purposes by assigning 10% of randomly selected unassigned reads (bit score ≤74) to the NCBI protein database followed by MetaHIT and SI metagenome databases using BLASTX (see methods for details).
Figure 2
Figure 2
Phylogenetic profiling of datasets A and B. Phylogenetic profiling of detected bacterial taxa for 16S rDNA and rRNA sequences obtained from pyrosequencing (a) and for mRNA reads obtained from Illumina sequencing (b). Both 16S and mRNA reads were classified into genus (colour key), or family (light grey), classified reads and the remaining unclassified reads (dark grey), based on the applied cut off (see methods). Only genera that contribute at least 2% to one of the profiles were represented. Separate phylogenetic profiling at genus level using 16S and mRNA reads of both datasets is presented in figure S4.
Figure 3
Figure 3
Distribution of mRNA reads assignment. The mRNA reads were assigned to the reference genome database and classified based on their alignment to protein-encoding genes (dark bars) or non-coding (light bars) regions. Based on alignment bit score of mRNA reads to the genome, the reads can obtain phylogenetic and functional identification at genus (blue) and family (green) levels with a minimum bit score of 148 and between 110 and 148, respectively; while the reads with an alignment bit score between 74 and 110 only obtained functional assignments (red). The unassigned reads were represented in black. The specific read numbers that belong to each classification are presented in table S4.
Figure 4
Figure 4
Distribution of COG functional categories for datasets A and B. Total COG distribution profiles were analyzed using reads with a minimum alignment bit score of 74. Genus specific COG distributions of the two most dominant genera were obtained using a minimum alignment bit score of 148. The COG distribution of the genes annotated in the complete genomes of representative (intestinal and non-intestinal) genomes of strains belonging to the three genera displayed here were included for comparison purposes.
Figure 5
Figure 5
Metabolic pathways mapping of dataset A and B. Metabolic pathways belonging to lipid, carbohydrate, energy, nucleotide, and amino acid metabolism were dominantly expressed in both datasets. The majority of the metabolic pathways overlapped between datasets A and B (red lines), while unique pathways for dataset A or B were indicated as green and blue lines, respectively. The line width indicates gene expression levels. Metabolic pathways were generated using iPath v2 based on KEGG annotation of the detected genes.

References

    1. van den Bogert B, Leimena MM, de Vos WM, Zoetendal EG, Kleerebezem M. In: Handbook of Molecular Microbial Ecology. Volume 2. de Bruin FJ, editor. Hoboken, New Jersey: Wiley-Blackwell; 2011. Functional Intestinal Metagenomics; pp. 170–190.
    1. Maccaferri S, Biagi E, Brigidi P. Metagenomics: key to human gut microbiota. Dig Dis. 2011;29:525–530. doi: 10.1159/000332966. - DOI - PubMed
    1. Booijink CC, Zoetendal EG, Kleerebezem M, de Vos WM. Microbial communities in the human small intestine: coupling diversity to metagenomics. Future Microbiol. 2007;2:285–295. doi: 10.2217/17460913.2.3.285. - DOI - PubMed
    1. Zoetendal EG, Raes J, van den Bogert B, Arumugam M, Booijink CC, Troost FJ, Bork P, Wels M, de Vos WM, Kleerebezem M. The human small intestinal microbiota is driven by rapid uptake and conversion of simple carbohydrates. Isme J. 2012;6:1415–1426. doi: 10.1038/ismej.2011.212. - DOI - PMC - PubMed
    1. Gilbert JA, Hughes M. Gene expression profiling: metatranscriptomics. Methods Mol Biol. 2011;733:195–205. doi: 10.1007/978-1-61779-089-8_14. - DOI - PubMed

Publication types

LinkOut - more resources