Review
. 2013 Nov;29(11):659-68.
doi: 10.1016/j.tig.2013.07.001. Epub 2013 Aug 1.

How old is my gene?

Affiliations
Review

How old is my gene?

John A Capra et al. Trends Genet. 2013 Nov.

Abstract

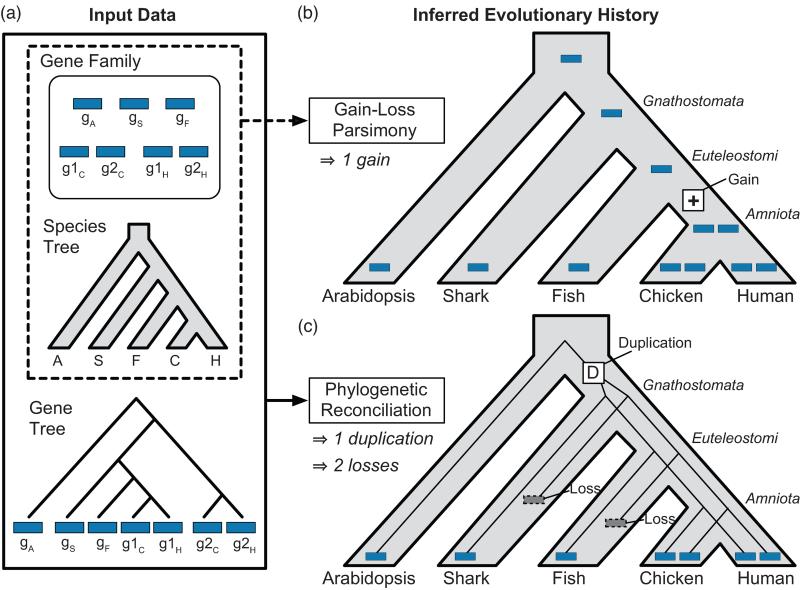
Gene functions, interactions, disease associations, and ecological distributions are all correlated with gene age. However, it is challenging to estimate the intricate series of evolutionary events leading to a modern-day gene and then to reduce this history to a single age estimate. Focusing on eukaryotic gene families, we introduce a framework that can be used to compare current strategies for quantifying gene age, discuss key differences between these methods, and highlight several common problems. We argue that genes with complex evolutionary histories do not have a single well-defined age. As a result, care must be taken to articulate the goals and assumptions of any analysis that uses gene age estimates. Recent algorithmic advances offer the promise of gene age estimates that are fast, accurate, and consistent across gene families. This will enable a shift to integrated genome-wide analyses of all events in gene evolutionary histories in the near future.

Keywords: eukaryotes; gene age; molecular clock; phylogenetics.


Figures

Figure 1
Figure 1. A typical error made by gain-loss methods is avoided with reconciliation
A gene family with a history of parallel losses illustrates the increased accuracy associated with explicit use of a gene tree by phylogenetic reconciliation. (a) A hypothetical gene family, based on the real enzyme family in Figure 2, possesses one gene in arabidopsis, shark, amphibians, and fish, and two genes in each amniote species. (b) A gain-loss method, Wagner parsimony, incorrectly infers a single gene family member in the common ancestral species and a recent gain on the lineage leading to chicken and human. This scenario implies that all chicken and human genes are equally related to gS and gF, an inference that is not supported by the true tree. (c) Gene tree-species tree reconciliation correctly infers an earlier duplication, followed by parallel losses in the shark and fish lineages, and shows that g1H and g1C are more closely related to gS in shark and gF in fish, than to g2H and g2C.
Figure 2
Figure 2. Phylogeny of the HMGCS gene family
Human, mouse, rat, and chicken have two copies of this enzyme: one that acts in the cytosol (HMGCS1) and one that acts in the mitochondria (HMGCS2) [31]. In contrast, fish, frogs, and sharks have a single copy of the enzyme. Based on this phylogenetic distribution, gain-loss parsimony infers a recent gain on the branch leading to amniotes. The HMGCS gene tree tells a different story: the two HMGCS subfamilies arose via an early duplication at the base of the vertebrate lineage followed by three parallel losses in shark, fish and amphibians. The branching order of the gene tree, with branch support values > 0.9, strongly supports these conclusions and rejects the seemingly more parsimonious history with a single, more recent gain. Gene tree inferred using PhyML [52] from sequences aligned with MAFFT [53] and rooted using three invertebrate outgroup sequences. Branch support was assessed using aLRT scores [52]. Abbreviations: Human = Homo sapiens; Rat = Rattus norvegicus; Mouse = Mus musculus; Chicken = Gallus gallus; Frog = Xenopus tropicalis; Pufferfish = Takifugu rubripes; Zebrafish = Danio rerio; Shark = Callorhinchus milii; Fly = Drosophila melanogaster; Yeast=Saccharomyces cerevisiae; Arabidopsis = Arabidopsis thaliana.
Figure 3
Figure 3. Gene origin and age are not uniquely defined in the human MaGuK superfamily
The membrane-associated guanylate kinase (MaGuK) superfamily is a multigene family with complex substructure and domain architecture. There are many potential choices for the MaGuK progenitor, which span a broad range of times. (a) MaGuK gene tree inferred from the guanylate kinase domain. Nodes 1–3 show three possible origins for MPP1: (1) the origin of the entire MaGuK family (pre-Opisthokonts), (2) the duplication that gave rise to separate CASK and MPP1 genes (pre-Metazoan), (3) the common ancestor of MPP1 and its orthologs (pre-Craniata). Domain architectures are shown on the leaves. Clades of genes with identical domain architectures are collapsed (e.g., MAGI1–3). (b) Species tree showing lineages when domains and specific MaGuKs first appeared. Leaves are decorated with the domains that are present in that species. Arrows indicate when the progenitor of a subfamily first arose, with the subfamily listed below that arrow. Red arrows indicate duplication events that either expanded a subfamily or gave rise to a new one. Branches 1, 2, and 3 represent three possible ages for MPP1, and correspond to nodes 1, 2, and 3, respectively, in the gene tree. Domain origins were inferred using Dollo parsimony with Count [36]. Gene origins are based on phylogenetic analysis [41] and Dollo parsimony.
Figure 4
Figure 4. Reconciliation reveals the dynamic history of fungal oxidoreductase genes
Analysis of fungal oxidoreductase gene families shows that a gain-loss approach can obscure the dynamics of gene family expansion and contraction, whereas reconciliation identifies a richer set of events. Internal nodes are labeled with the number of inferred ancestral oxidoreductase genes. Branch labels show inferred gains and losses that changed dramatically between the two analyses. Brown rot fungi are indicated by brown text in a tan box; white rot by white text in a gray box. (a) The original, reconciliation-based analysis of seven oxidoreductase gene families in 10 fungal species, adapted from Figure 1B in [43]. This analysis infers a moderate oxidoreductase complement in the white rot MRCA (starred node), with substantial independent expansions in the Ascomycota and the Basidiomycota. The oxidoreductase gene complement in the ancestral white rot species (red circle) has the most oxidoreductase genes among ancestral nodes. Independent, lineage-specific gene duplications and losses in white and brown rots, respectively, gave rise to present day oxidoreductase counts. (b) Our analysis of the same data set using a gain-loss analysis predicts smaller gene family sizes in the white rot ancestor and lineage-specific expansions, rather than contractions, in Serpula and the lineages leading to Coprinopsis and Laccaria and to Postia and Phanerochaete. The expansions in Heterobasidion and Schizophyllum are substantially over-estimated compared with (a). Ancestral gene family sizes were inferred using Wagner parsimony with equal weights implemented in Count [36].
Figure 5
Figure 5. Estimates of species divergence times vary greatly
Metazoan species tree annotated with estimates of ancestral divergence times, obtained from the TimeTree database (timetree.org) using the species tree obtained from the NCBI taxonomy [54]. Nodes are plotted at the mean age estimate across all surveyed literature that contained that divergence [55]. The relative timing of these mean estimates violates the branching order of the commonly accepted tree (inset box), as can be seen from the distorted layout in which several branches appear to be traveling backwards in time. In the accepted tree, the Opisthokonta, Metazoa, and Bilateria nodes all pre-date Ecdysozoa and its sister node Chordata. This uncertainty is further reflected in the fact that minimum and maximum age estimates for each node (red bars) differ by hundreds of millions of years. To attempt to resolve these issues, an “expert result” (starred) was selected for each node from a single article that was deemed to have the “best” estimate for that divergence [45]. Across the tree, this expert result is consistently much older than the mean age estimate for the same node, indicating that there may be systematic underestimation of node ages in the literature. The expert results are more consistent with the branching order of the accepted tree, although they do not correctly place Opisthokonta earlier than Metazoa.

References

    1. Kaessmann H. Origins, Evolution, and Phenotypic Impact of New Genes. Genome Res. 2010;20:1313–26. - PMC - PubMed
    1. Domazet-Loso T, Tautz D. A Phylogenetically Based Transcriptome Age Index Mirrors Ontogenetic Divergence Patterns. Nature. 2010;468:815–8. - PubMed
    1. Alba MM, Castresana J. Inverse Relationship between Evolutionary Rate and Age of Mammalian Genes. Mol. Biol. Evol. 2005;22:598–606. - PubMed
    1. Cai JJ, et al. Accelerated Evolutionary Rate May Be Responsible for the Emergence of Lineage-Specific Genes in Ascomycota. J. Mol. Evol. 2006;63:1–11. - PubMed
    1. Wolf YI, et al. The Universal Distribution of Evolutionary Rates of Genes and Distinct Characteristics of Eukaryotic Genes of Different Apparent Ages. Proc. Natl. Acad. Sci. U.S.A. 2009;106:7273–80. - PMC - PubMed

Publication types