. 2013 Aug 6:3:61.
doi: 10.1186/2191-219X-3-61. eCollection 2013.

FDG kinetic modeling in small rodent brain PET: optimization of data acquisition and analysis

Affiliations

FDG kinetic modeling in small rodent brain PET: optimization of data acquisition and analysis

Malte F Alf et al. EJNMMI Res. .

Abstract

Background: Kinetic modeling of brain glucose metabolism in small rodents from positron emission tomography (PET) data using 2-deoxy-2-[(18) F]fluoro-d-glucose (FDG) has been highly inconsistent, due to different modeling parameter settings and underestimation of the impact of methodological flaws in experimentation. This article aims to contribute toward improved experimental standards. As solutions for arterial input function (IF) acquisition of satisfactory quality are becoming available for small rodents, reliable two-tissue compartment modeling and the determination of transport and phosphorylation rate constants of FDG in rodent brain are within reach.

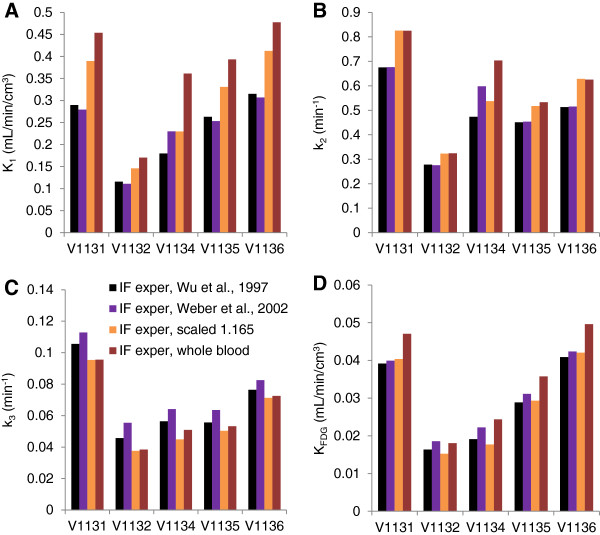
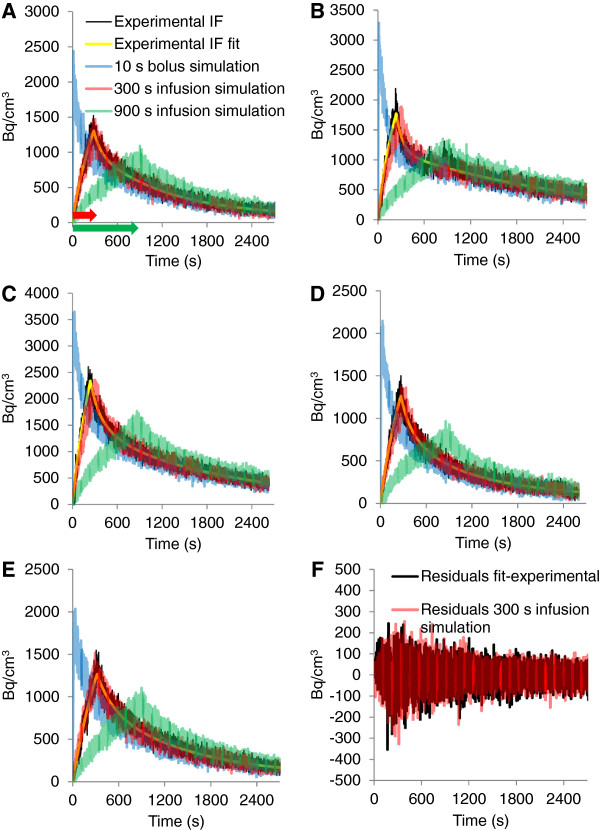
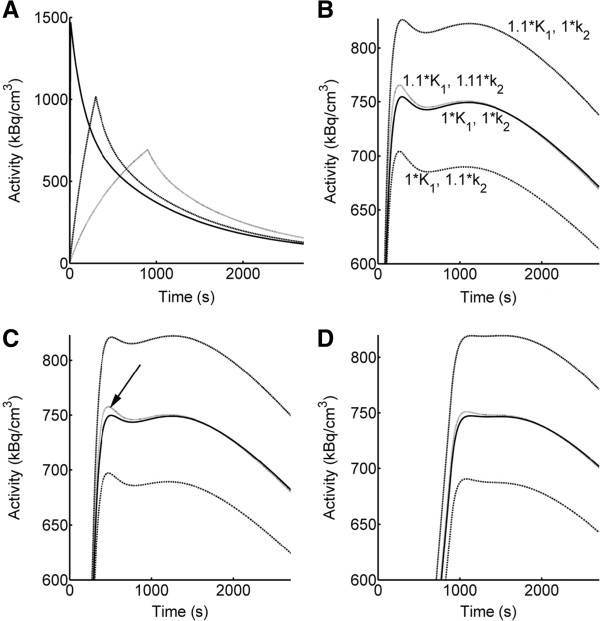
Methods: Data from mouse brain FDG PET with IFs determined with a coincidence counter on an arterio-venous shunt were analyzed with the two-tissue compartment model. We assessed the influence of several factors on the modeling results: the value for the fractional blood volume in tissue, precision of timing and calibration, smoothing of data, correction for blood cell uptake of FDG, and protocol for FDG administration. Kinetic modeling with experimental and simulated data was performed under systematic variation of these parameters.

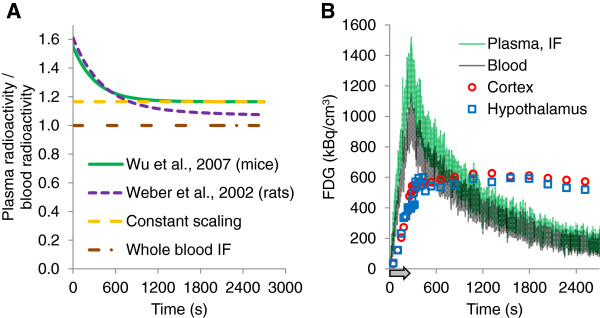
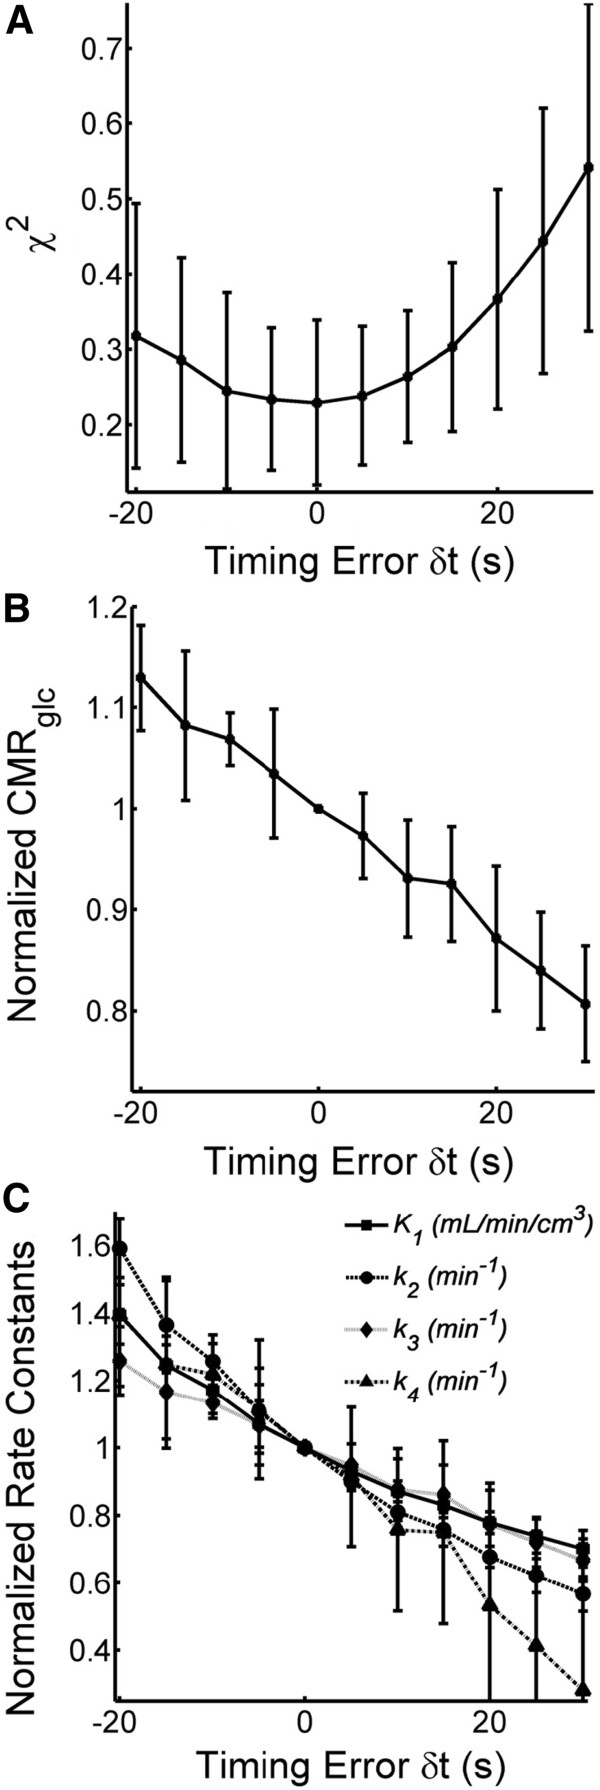
Results: Blood volume fitting was unreliable and affected the estimation of rate constants. Even small sample timing errors of a few seconds lead to significant deviations of the fit parameters. Data smoothing did not increase model fit precision. Accurate correction for the kinetics of blood cell uptake of FDG rather than constant scaling of the blood time-activity curve is mandatory for kinetic modeling. FDG infusion over 4 to 5 min instead of bolus injection revealed well-defined experimental input functions and allowed for longer blood sampling intervals at similar fit precisions in simulations.

Conclusions: FDG infusion over a few minutes instead of bolus injection allows for longer blood sampling intervals in kinetic modeling with the two-tissue compartment model at a similar precision of fit parameters. The fractional blood volume in the tissue of interest should be entered as a fixed value and kinetics of blood cell uptake of FDG should be included in the model. Data smoothing does not improve the results, and timing errors should be avoided by precise temporal matching of blood and tissue time-activity curves and by replacing manual with automated blood sampling.

Keywords: CMRglc; FDG; Fractional blood volume; Infusion; Kinetic modeling; Positron emission tomography; Reliability.


Figures

Figure 1
Figure 1
Functions to generate IFs from blood radioactivity and data of a representative experiment. (A) Exponential functions and scaling factor to calculate plasma form blood radioactivity. If not stated otherwise, the exponential function described in Equation 3 (Wu et al. [14], solid green line) was used in this study. For comparison, IFs were calculated with the bi-exponential function described for rats (Weber et al. [8]; dashed magenta line) and with a constant scaling factor corresponding to the equilibrium partition coefficient of plasma to blood (Wu et al. [14]; dashed orange line). Finally, whole blood was used as IF for comparison (constant factor 1; dashed-dotted brown line). (B) Representative data of an experiment (scan number V1131). Blood time-activity curve (grey), IF as calculated with the function in green in (A) (Wu et al. [14]; Equation 3), TAC of the cortex (red circles), and the hypothalamus (blue squares). Arrow indicates infusion duration.
Figure 2
Figure 2
Effect of fractional blood volume on modeling with data from the cortex. (A) Effect on goodness of fit (χ2). Original data were more sensitive to unrealistically high vb in the model. (B) Averaged CMRglc was increased by about 10% when vb was assumed to be zero. Thin lines are drawn one average standard deviation of the experimental data (n = 5 animals) above and below the average data curve.
Figure 3
Figure 3
Effect of fractional blood volume on the single rate constants.K1(A) and k2(B) showed an almost linear relationship in the cortex, while the pattern for k3(C) and k4(D) was more complex. Effects were independent of the brain region. Single asterisk (*) denotes the results from model fits using smoothed data deviated significantly (P < 0.05) from those achieved with the full TAC. Error bars are omitted for better readability.
Figure 4
Figure 4
Effect of blood sample timing errors. (A) Goodness of fit was best at no delay between IF and TAC but significantly decreased within the investigated range of time delay. (B) CMRglc was sensitive to timing errors. A delay of as little as 5 s in either direction resulted in significant changes. (C) Timing errors led to large deviations in all single rate constants. Average values with standard deviations from five animals each.
Figure 5
Figure 5
Influence of the correction for blood cell uptake on FDG kinetic modeling in mouse brain cortex. (A) K1, (B) k2, (C) k3, (D) KFDG. V1131 to V1136 are scan numbers. IFs were calculated according to Equation 3 (black bars; IF exper, Wu et al. [14]; for mice), Equation 4 (magenta; IF exper, Weber et al. [8]; for rats), with a constant scaling factor (light brown; IF exper, scaled 1.165) or blood radioactivity was used as IF (dark brown).
Figure 6
Figure 6
Experimental, fit, and simulated IFs. (A to E) Experimental IF (black), tri-exponential fit according to Equations 6 and 7 (yellow), simulation 10-s bolus injection (blue), simulation 300-s constant infusion (red), simulation 900-s constant infusion (green) for scans V1131 (A), V1132 (B), V1134 (C), V1135 (D), and V1136 (E). (F) Residuals between experimental IF and fit function in black and between simulated IF (300-s infusion) with and without noise in red (scan V1131). Arrows in (A) indicate the duration of the infusions.
Figure 7
Figure 7
Fit parameters generated with experimental and simulated IFs and TACs. (A)K1, (B)k2, (C)k3, (D)KFDG. IF exper as in Figure 5 (black bars). Experimental IFs were reduced to data points every 30 s (dark grey) and 60 s (light grey), respectively, and experimental TACs were fitted with the reduced IFs. Data were in addition calculated with the fitted IF and experimental TACs (yellow). Bolus injection over 10 s simulated with 1-s (dark blue) and 30-s (light blue) sampling intervals. Simulated infusion protocols over 300 s with 1-s (red), 30-s (medium red), and 60-s (light red) sampling intervals. Simulated infusion over 900 s with 1-s (dark green) and 30-s (light green) sampling intervals. Simulated data are averages of fits with ten simulated TACs each, error bars indicate the standard deviations of the ten fits. All simulated IFs and TACs contained Gaussian noise, except of the fit IF (yellow). Single and double asterisk (* and **) denote some significant differences to the respective rate constants of the 300-s infusion protocol, 1-s sampling interval at P < 0.05 and P < 0.01, respectively. Note that most rate constants of the 900-s infusion protocol, 30-s sampling interval, were significantly (P < 0.01) lower than the corresponding rate constants at 300-s infusion, 1-s sampling. Not all single asterisk (*) and double asterisk (**) are indicated for clarity.
Figure 8
Figure 8
Loss of information by prolonging the infusion duration. (A) Simulated IFs, bolus 10 s (dark line) and infusions 300 (dotted line) and 900 s (grey line). (B) Zoom into TAC generated with a typical set of rate constants K1 0.328 mL/min/cm3,k2 0.550 min−1, k3 0.079 min−1, k4 0 (dark line). An additional TAC was generated by increasing K1 by 10% (1.1 × K1). At the same time, k2 was also increased to match the original TAC as close as possible. The respective factor for k2 was 1.11 (1.11 × k2). TACs with either increased K1 or k2 are shown in addition. The newly generated TAC with 1.1 × K1 and 1.11 × k2 deviates from the original TAC around the infusion stop, i.e., around the peak of the IF. This difference is indispensable to distinguish between the effects of K1 and k2 on the TAC and thus for kinetic modeling. (C) TACs generated with the same rate constants as in (B) for the 300-s infusion and (D) for the 900-s infusion. The difference between the two TACs (indicated by an arrow in C) reduces as infusion duration increases, explaining the improper fit parameters with the simulated 900-s infusion protocol at longer sampling intervals. Note that (B) to (D) zoom into the TAC region of interest and the activity scale, therefore starts at 600 Bq/cm3.

References

    1. Martic-Kehl MI, Ametamey SM, Alf MF, Schubiger PA, Honer M. Impact of inherent variability and experimental parameters on the reliability of small animal PET data. EJNMMI Res. 2012;3:26. doi: 10.1186/2191-219X-2-26. - DOI - PMC - PubMed
    1. Keyes JW Jr. SUV: standard uptake or silly useless value? J Nucl Med. 1995;3:1836–1839. - PubMed
    1. Sokoloff L, Reivich M, Kennedy C, Des Rosiers MH, Patlak CS, Pettigrew KD, Sakurada O, Shinohara M. The [14C]Deoxyglucose method for the measurement of local cerebral glucose utilization: theory, procedure, and normal values in the conscious and anesthetized albino rat. J Neurochem. 1977;3:897–916. doi: 10.1111/j.1471-4159.1977.tb10649.x. - DOI - PubMed
    1. Brooks RA. Alternative formula for glucose utilization using labeled deoxyglucose. J Nucl Med. 1982;3:538–539. - PubMed
    1. Krohn KA, Muzi M, Spence AM. What is in a number? The FDG lumped constant in the rat brain. J Nucl Med. 2007;3:5–7. - PubMed

LinkOut - more resources