. 2013:4:2240.
doi: 10.1038/ncomms3240.

A systematic analysis of the PARP protein family identifies new functions critical for cell physiology

Affiliations

A systematic analysis of the PARP protein family identifies new functions critical for cell physiology

Sejal Vyas et al. Nat Commun. 2013.

Abstract

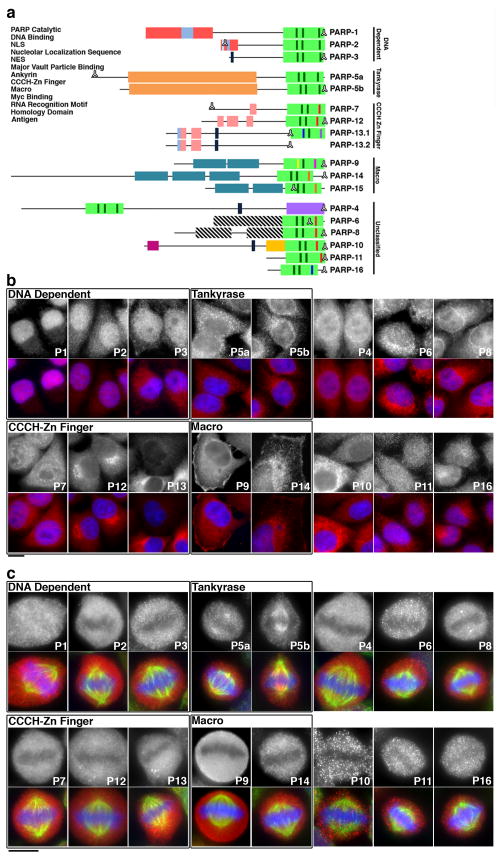
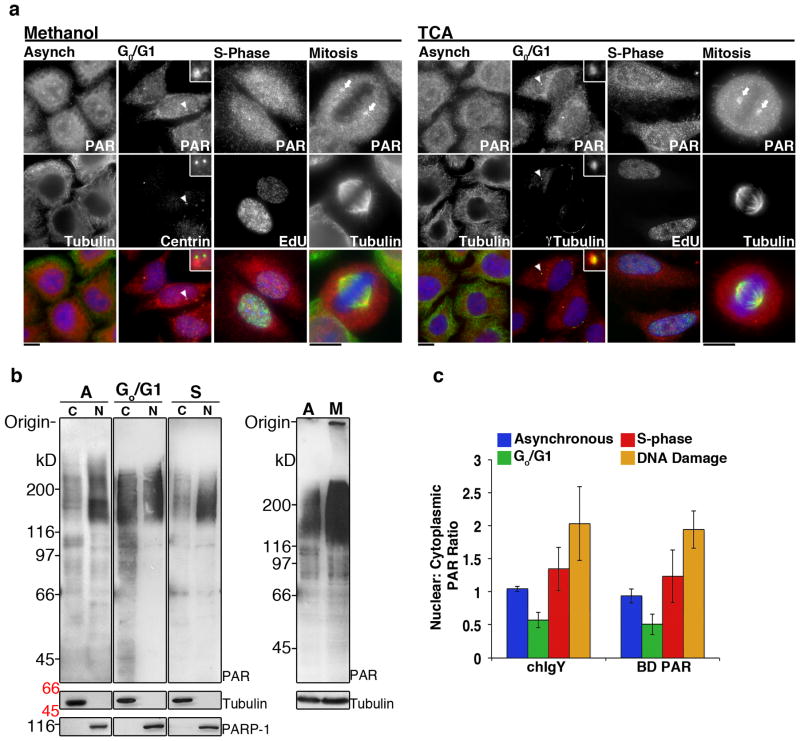
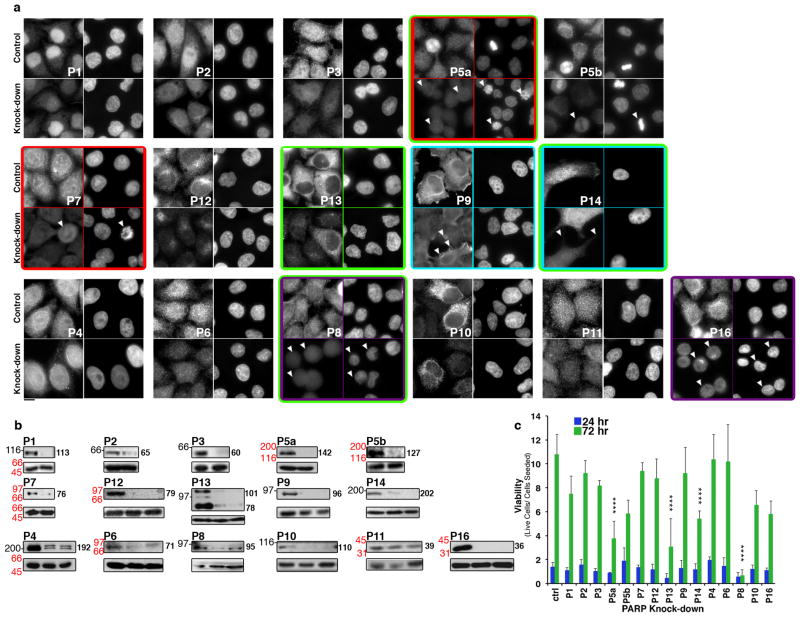
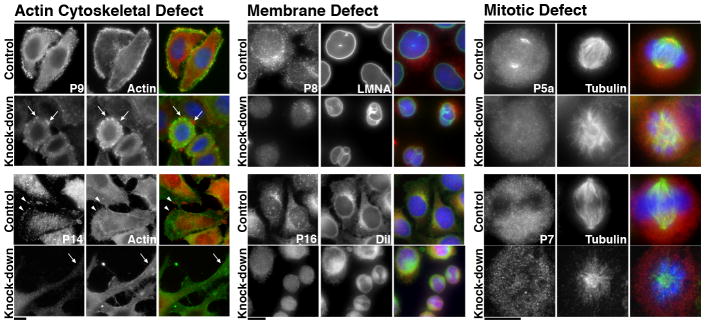
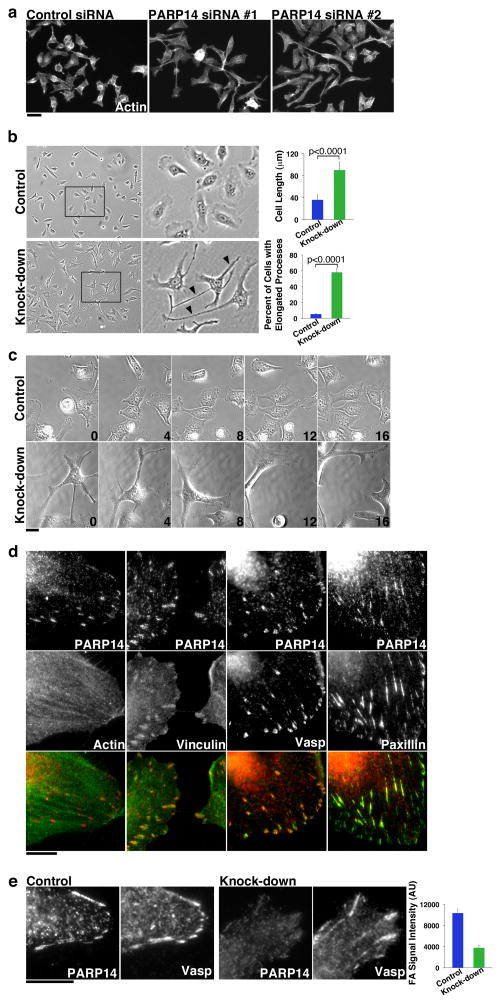
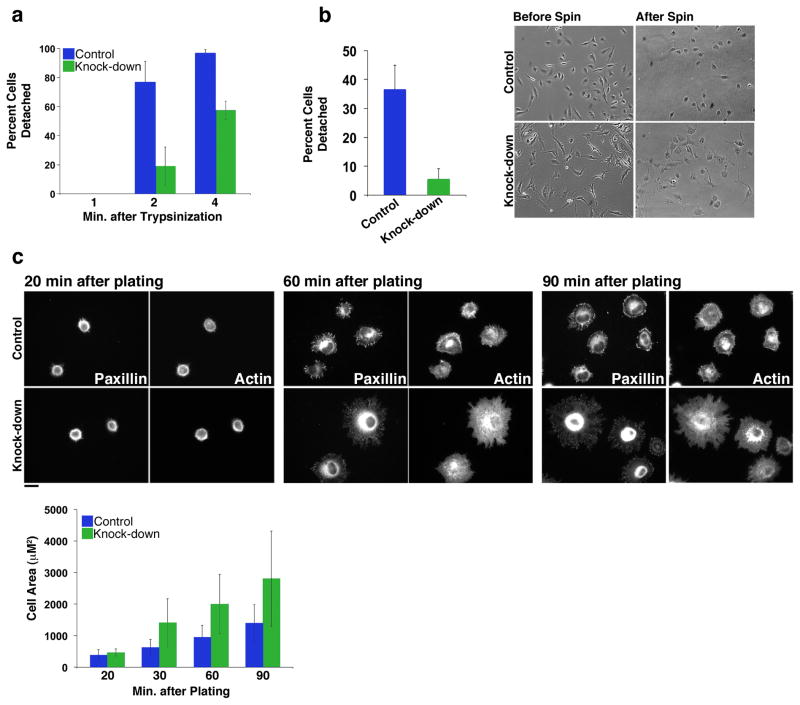
The poly(ADP-ribose) polymerase (PARP) family of proteins use NAD(+) as their substrate to modify acceptor proteins with ADP-ribose modifications. The function of most PARPs under physiological conditions is unknown. Here, to better understand this protein family, we systematically analyse the cell cycle localization of each PARP and of poly(ADP-ribose), a product of PARP activity, then identify the knockdown phenotype of each protein and perform secondary assays to elucidate function. We show that most PARPs are cytoplasmic, identify cell cycle differences in the ratio of nuclear to cytoplasmic poly(ADP-ribose) and identify four phenotypic classes of PARP function. These include the regulation of membrane structures, cell viability, cell division and the actin cytoskeleton. Further analysis of PARP14 shows that it is a component of focal adhesion complexes required for proper cell motility and focal adhesion function. In total, we show that PARP proteins are critical regulators of eukaryotic physiology.


Conflict of interest statement

Competing financial interests

The authors declare no competing financial interests.

Figures

Figure 1
Figure 1. PARPs localize throughout the cell
A) Domain structure of PARP proteins. Functional domains are indicated and green dashes within the catalytic domain indicate H-Y-E amino acids thought to be required for PAR synthesis activity. Dashes with different colors indicate the replacement of these amino acids with the following residues: I (red), Y (blue), V (purple), Q (yellow), T (pink), L (orange). B-C) HeLa cells were fixed then stained with affinity-purified antibodies generated against each PARP. Data is presented in PARP subfamily groupings, labeled in boxes, with each PARP labeled as P(x). A summary of localization patterns is provided in Table 1. B) Interphase localization of PARP proteins. Most PARPs are cytoplasmic (top). Merge (below) shows PARP (red) and Hoechst 33342 staining (blue). C) PARP localization in mitotic cells (top). A subset of PARPs localize to the mitotic spindle (P5a, 5b, 8,11). Merge (below) shows PARP (red), tubulin (green) and Hoechst 33342 (blue) staining. Scale bars, 10 μm. See also Supplementary Figures S1–S3 and Tables 1–2.
Figure 2
Figure 2. Poly(ADP-ribose) is localized to the cytoplasm and nucleus throughout the cell cycle
A) Asynchronous populations of HeLa cells (Asynch) or cells arrested in G0/G1, S-phase or Mitosis were fixed with Methanol or TCA, then stained for PAR (Tulip chIgY), and Centrin or γ-Tubulin, to identify single centriole pairs found during Go/G1, EdU, incorporated during S-phase, and Tubulin, to stain mitotic spindles. In asynchronous cells and during Go/G1, S-phase, and Mitosis, PAR staining was punctate with strong staining at the centrosome (arrowhead) and poles of the mitotic spindle (arrows). S-phase cells exhibited increased punctate staining in the nucleus relative to Go/G1 cells. Merge shows PAR (red), cell cycle markers (green) and Hoechst 33342 (blue). Scale bars, 10 μm. B) Cytoplasmic (C) and nuclear (N) extracts prepared from identical cell pellets, then normalized to cell volume, were generated from asynchronous, Go/G1 and S-phase arrested cells. Extracts were immunoblotted with Tulip chIgY anti-PAR antibody. Cytoplasmic and nuclear extracts were further examined for the presence of tubulin, a cytoplasmic protein, or PARP1, a nuclear protein, to assay for contamination between the fractions. Total cell extracts were also prepared from asynchronous (A) and mitotic (M) cells and immunoblotted with Tulip chIgY anti-PAR antibody. Positions of molecular weight markers are indicated on the right in black, molecular weights shown in italics identify the closest markers above and below the cropped region. C) Quantitation of signal intensity of PAR immunoblots using chIgY and BD PAR antibodies. The ratio of nuclear to cytoplasmic PAR increases during S-phase and DNA damage. The integrated intensity over the entire lane was determined and the ratio of nuclear:cytoplasmic signal calculated, error bars represent standard deviation, n=3. See also Supplementary Figure S5.
Figure 3
Figure 3. Knock-down phenotypes of the PARP family
PARP knock-down results in cell viability, membrane, actin cytoskeleton, and mitosis phenotypes. PARP expression was knocked-down via siRNA transfection in HeLa cells. Cells were then stained for each PARP (A) and immunoblot analysis performed to confirm knock-down (B). A) Cells were transfected with control siRNAs (Control) or siRNAs specific for each PARP (Knock-down) then stained for PARP (left) and Hoechst 33342 (right). Knockdown identified 4 phenotypes: defects in membranes (purple boxes), actin cytoskeleton (cyan boxes), mitosis (red boxes), and cell viability (green boxes, Supplementary Figure S5A). Arrowheads indicate cells exhibiting knock-down. Scale bar, 10 μm. B) Lysates from HeLa cells transfected with control (left lane) or PARP-specific siRNA (right lane(s)) were immunoblotted with corresponding anti-PARP antibody. Positions of molecular weight markers are indicated on the right in black, molecular weights shown in italics identify the closest markers above and below the cropped region and the approximate molecular weight (kDa) of the relevant PARP in each knock-down is indicated to the left of each PARP blot. The corresponding tubulin blot is included as a loading control (lower panels). C) Cell number was analyzed 24h and 72h after knock-down of each PARP and presented as fold change relative to the initial number of cells seeded. PARP knock-downs that resulted in a decrease in viability of ≥ 2 standard deviations relative to control knock-downs where identified as defective in cell viability. Error bars represent standard deviation, n=3, ****p<0.00001, Student’s T test. See also Supplementary Figure S6 and Table 1.
Figure 4
Figure 4. Analysis of knock-down phenotypes identifies new PARP functions
Morphological phenotypes identified upon PARP knock-down were grouped into actin cytoskeletal, membrane or mitotic defects then analyzed to determine biological function. Control and Knock-down cells stained with Hoechst 33342 (blue) and antibodies against the knocked-down PARP (red). Cells exhibiting Actin Cytoskeletal Defects were co-stained with phalloidin (P9) or an actin antibody (P14) to stain filamentous Actin (green), Membrane Defects for Lamin A/C (LMNA) or DiI (green) and mitotic defects for Tubulin (green). PARP9 (P9) co-localized with actin in control cells. Knock-down resulted in actin rich blebs shown by Arrows. PARP14 (P14) localized to cell protrusions in control cells (Arrowheads), identified in Figure 5 as focal adhesions. P14 knockdowns exhibited severe morphological defects with assembly of extended cellular protrusions (Arrowheads). PARP8 (P8) co-localized with LMNA in control cells, but not knockdown cells. PARP8 knockdown resulted in abnormal, bilobed nuclei. PARP16 (P16) co-localized with the membrane dye DiI in control cells. Knock-down resulted in pairs of round cells. PARP5a (P5a), but not PARP7 (P7) localized to the mitotic spindle. Knockdown of P5a resulted in multipolar spindles, while P7 knockdown resulted in an increase in pre-metaphase spindles. Actin cytoskeletal defects are further examined in Figure 5–6, and mitotic defects in Supplementary Figure S6. Scale bars, 10 μm.
Figure 5
Figure 5. PARP14 is a focal adhesion protein whose knock-down results in abnormal cell morphology and cell migration defects
A) HeLa cells were transfected with control siRNA or siRNA 1 or 2 directed against distinct PARP14 sequences, then stained with Phalloidin. Both PARP14 siRNAs result in similar cell phenotypes containing extended cellular protrusions. Scale Bar, 50 μm. B) Bright field images of representative fields of control and PARP14 siRNA treated cells. Extended cellular protrusions in PARP14 siRNA treated cells are marked with Arrowheads. Quantitation of maximum cell length (n=20 cells) and percent cells displaying extended cellular protrusions (n=3, 200 cells counted per condition) shown at left. Error bars represent standard deviation. Significance determined by student’s t-test. C) Still images of the indicated time points of movies taken of control and PARP14 siRNA treated cells undergoing random migration on the substrate fibronectin. See also Supplementary Movie 1 (Control cells) and Supplementary Movie 2 (PARP14 depleted cells). Scale bar, 25 μm D) HeLa cells plated on fibronectin fixed with TCA and stained for PARP14 (red), and the indicated focal adhesion proteins (green). Scale bar, 10 μm. E) Control and PARP14 knock-down cells fixed with TCA and co-stained for PARP14 and Vasp. PARP14 knock-down results in loss of signal at focal adhesions demonstrating the specificity of focal adhesion staining (arrows). The intensity of PARP14 signal at focal adhesions was quantified in both control and PARP14 knock-down cells. Scale bar, 10 μm.
Figure 6
Figure 6. PARP14 depletion from focal adhesions results in increased adhesive strength
A) Control or PARP14 siRNA treated cells plated on fibronectin were treated with trypsin for the indicated times and percent cells detached quantified at each time point. Error bars represent standard deviation. B) Control or PARP14 siRNA treated cells plated on fibronectin were subjected to a constant centrifugal force (2,000 g) for 30 min and the number of cells detached during centrifugation quantified. Representative images of control and PARP14 knock-down cells before and after centrifugation shown at right. Error bars represent standard deviation. C) Control or PARP14 siRNA treated cells were allowed to adhere to a fibronectin coated plate for the indicated times, fixed and stained with anti-paxillin and phalloidin, and the area of individual cells quantified at each timepoint. Error bars represent standard deviation. Representative images of control or PARP14 knock-down cells at each time point are shown. Scale bar, 25 μm.

References

    1. Mann M, Jensen ON. Proteomic analysis of post-translational modifications. Nat Biotechnol. 2003;21:255–261. - PubMed
    1. Bürkle A. Poly(ADP-ribose): The most elaborate metabolite of NAD+ FEBS J. 2005;272:4576–4589. - PubMed
    1. Malanga M, Althaus FR. The role of poly(ADP-ribose) in the DNA damage signaling network. Biochem Cell Biol. 2005;83:354–364. - PubMed
    1. Koh DW, Dawson TM, Dawson VL. Mediation of cell death by poly(ADP-ribose) polymerase-1. Pharmacol Res. 2005;52:5–14. - PubMed
    1. Petesch SJ, Lis JT. Rapid, transcription-independent loss of nucleosomes over a large chromatin domain at Hsp70 loci. Cell. 2008;11:74–84. - PMC - PubMed

Publication types

Substances