. 2013:4:2274.
doi: 10.1038/ncomms3274.

Genome sequence of the date palm Phoenix dactylifera L

Affiliations
Free PMC article

Genome sequence of the date palm Phoenix dactylifera L

Ibrahim S Al-Mssallem et al. Nat Commun. 2013.
Free PMC article

Abstract

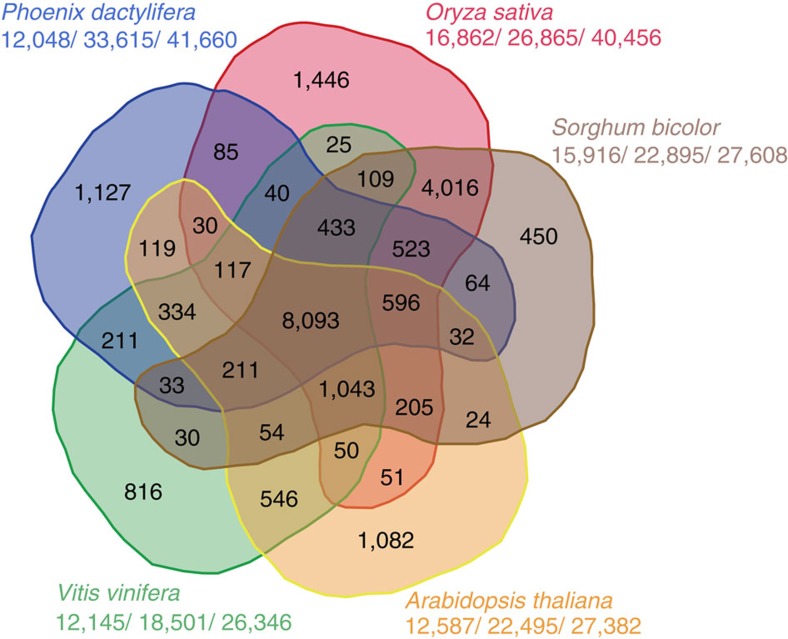
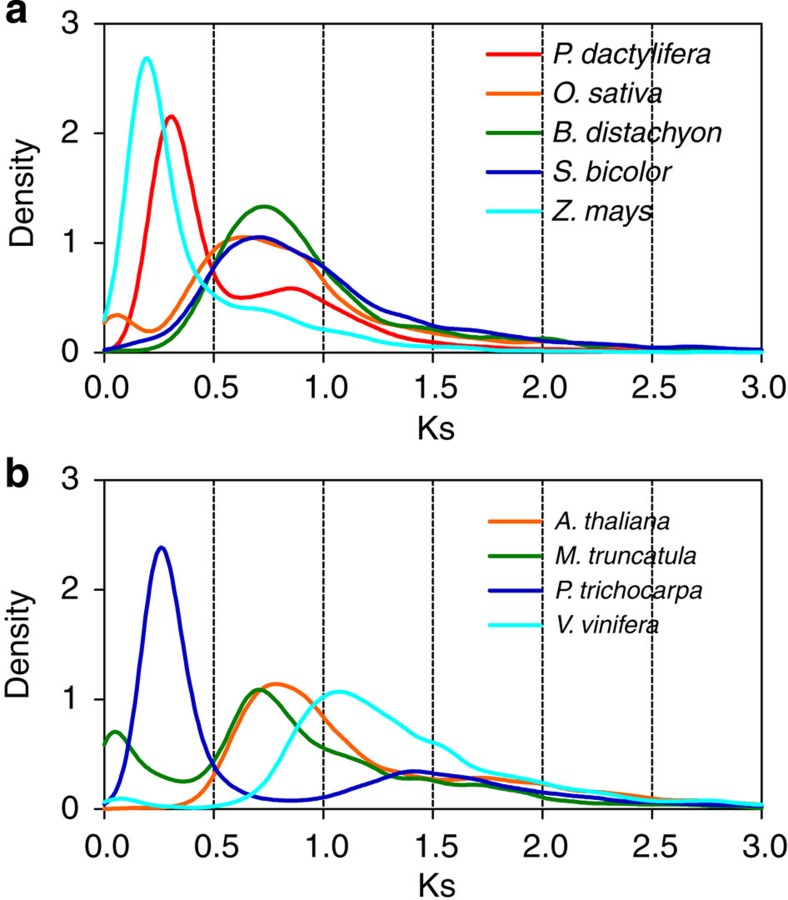
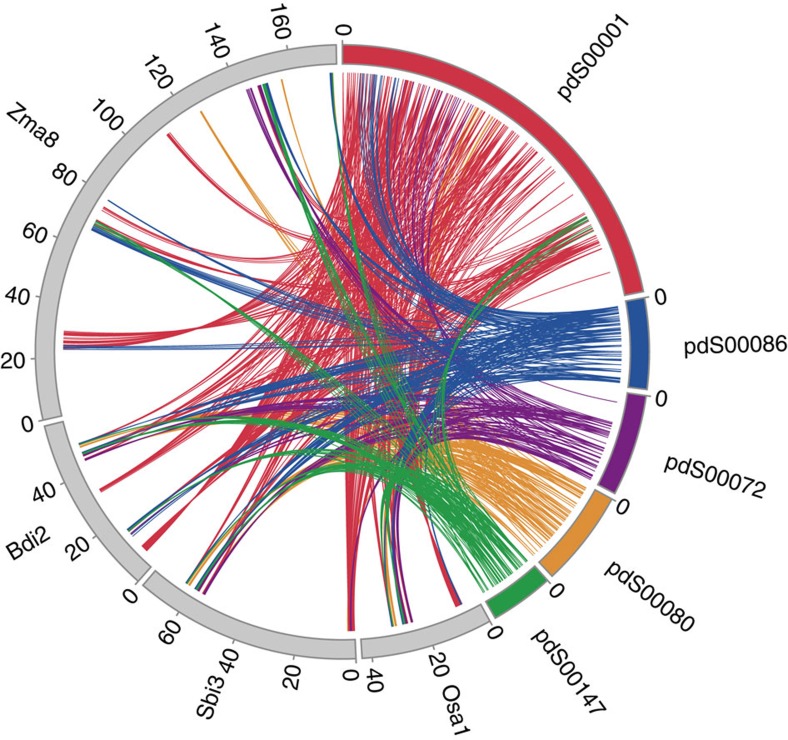
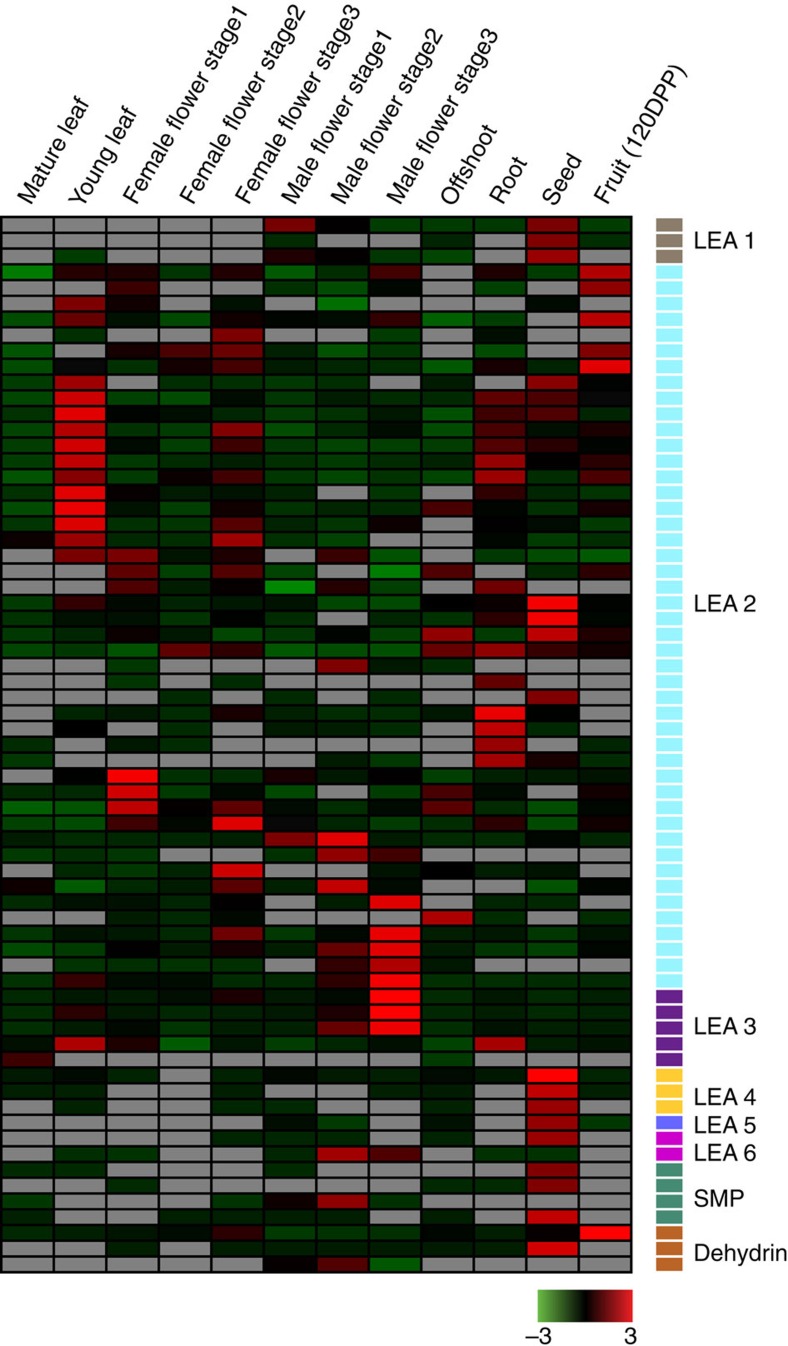
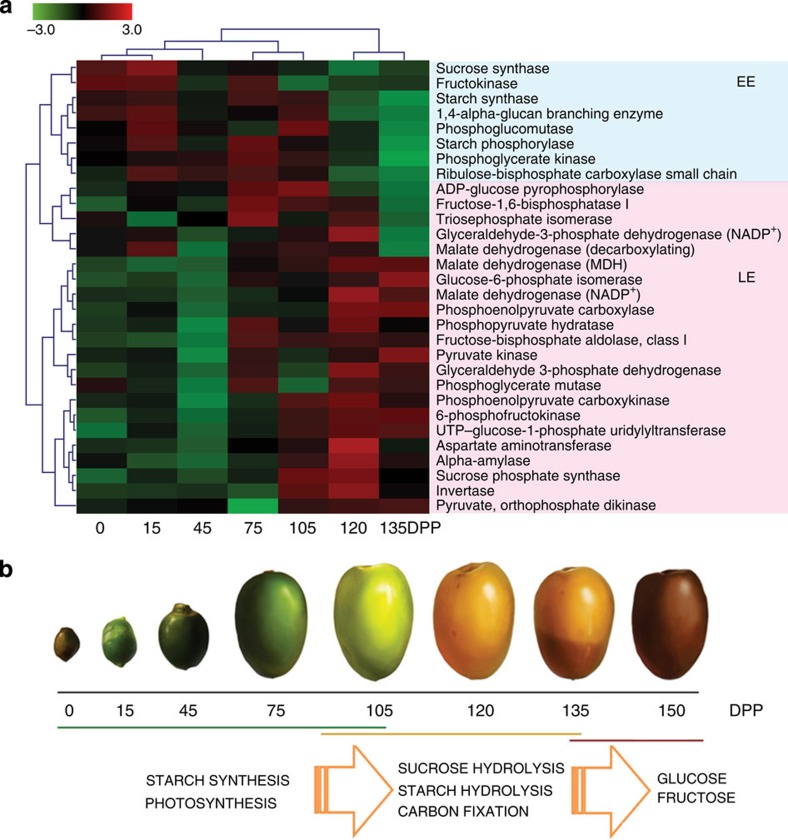
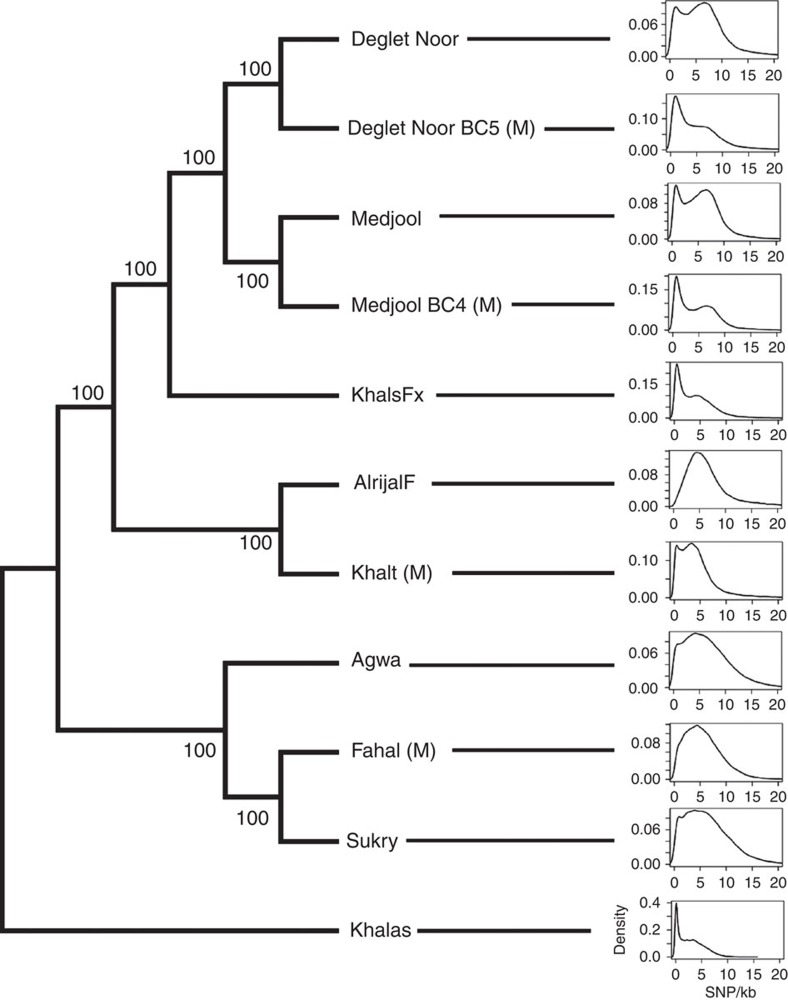
Date palm (Phoenix dactylifera L.) is a cultivated woody plant species with agricultural and economic importance. Here we report a genome assembly for an elite variety (Khalas), which is 605.4 Mb in size and covers >90% of the genome (~671 Mb) and >96% of its genes (~41,660 genes). Genomic sequence analysis demonstrates that P. dactylifera experienced a clear genome-wide duplication after either ancient whole genome duplications or massive segmental duplications. Genetic diversity analysis indicates that its stress resistance and sugar metabolism-related genes tend to be enriched in the chromosomal regions where the density of single-nucleotide polymorphisms is relatively low. Using transcriptomic data, we also illustrate the date palm's unique sugar metabolism that underlies fruit development and ripening. Our large-scale genomic and transcriptomic data pave the way for further genomic studies not only on P. dactylifera but also other Arecaceae plants.


Figures

Figure 1
Figure 1. A Venn diagram showing the distribution of shared gene families among representative angiosperms.
Phoenix dactylifera, Arabidopsis thaliana, Oryza sativa, Sorghum bicolor and Vitis vinifera (OrthoMCL 2.0.2, E<1e-5). The number of gene families, the number of genes in the families and the total number of genes are indicated under species names, which are separated by slashes. A total of 12,624 sequences in 1,127 gene families are unique to P. dactylifera, and these unique gene families are mostly related to DNA/RNA metabolic process and ion binding (Supplementary Table S15).
Figure 2
Figure 2. Ks distribution of GWD in selected monocotyledons and dicotyledons.
The density distribution of each monocotyledon (a) or dicotyledon (b) was calculated based on kernel density estimation with a bin size of 0.001. The evolutionary rate is relative slow in trees, such as those of P. trichocarpa and V. vinifera. We suppose that the P. dactylifera genome also has this character similar to oil palm. The minor peak of O. sativa (Ks ~0.06) was recently suggested to be a GWD event happened ~70 Mya and the genome underwent an illegitimate recombination followed by fast evolution. Z. mays had a recent GWD event (Ks~0.2, ~5–12 Mya) as compared with other Gramineae species. In M. truncatula, a peak near 0 (Ks~0.05) is due to local duplication and faster evolution rate as compared with other vascular plants.
Figure 3
Figure 3. Macro-synteny among P. dactylifera scaffolds and other monocotyledon chromosomes.
Scaffolds pdS00001 (4.5 M), pdS00072 (1.1 M), pdS00080 (1 M) pdS00086 (1 M) and pdS00147 (0.7 M) have the same syntenic pattern with other monocotyledons. In addition, the latter four scaffolds have syntenic regions with pdS00001 and are inferred to be duplicated at monocotyledon ancestry (Supplementary Fig. S5). The unit of scale is million base pairs or Mb for other monocotyledon chromosomes. All P. dactylifera scaffolds are enlarged 30 × for illustration.
Figure 4
Figure 4. Expression patterns of the LEA genes among 12 tissues of P. dactylifera.
The LEA subfamilies are colour-coded (on the right side). The expression levels are normalized based on the Z-score method (scale bar) over all libraries (on the top).
Figure 5
Figure 5. Expression profiling of sugar metabolism-related genes at different fruiting stages.
(a) Gene expression profiling of 30 key enzymes related to sugar metabolism. The hierarchical clustering shows that these genes can be classified into two patterns: genes expressed at the early developmental stages (EE, blue, 0–75 DPP) and at the late developmental stages (LE, red, 105–135 DPP). (b) Summary of sugar metabolisms during fruit development and ripening. Fruits at 150 DPP are completely ripe and we were unable to extract enough RNA for RNA-seq.
Figure 6
Figure 6. Phylogenetic analysis of 11 P. dactylifera varieties based on SNPs and their SNPs frequency distributions.
The phylogenetic tree was constructed by using all SNP sites of the varieties (NJ method with 1,000 bootstrap, MEGA 5.0). The series of plots show SNP density (SNP per kb, the horizontal axis) and frequencies (the vertical axis). SNP frequency was calculated based on a 10-kb sliding window in 1-kb steps. The modes of SNP distribution are compounding, where the minor mode is contributed by SNP deserts.

References

    1. Balick M. J. & Beck H. T. Useful Palms of the World: a Synoptic Bibliography Columbia University Press (1990).
    1. Mahmoudi H., Hosseininia G., Azadi H. & Fatemi M. Enhancing date palm processing, marketing and pest control through organic culture. J. Org. Sys. 3, 29–39 (2008).
    1. Munier P. Le palmier-dattier Vol. 24, G P Maisonneuve and Larose (1973).
    1. El-Juhany L Degradation of date palm trees and date production in arab countries: causes and potential rehabilitation. Aust. J. Basic. Appl. Sci. 4, 3998–4010 (2010).
    1. Al-Maasllem I. S. Date Palm (Phoenix dactylifera L.) Vol. 7, Encyclopedia Works Publishing & Distribution (1996).

Publication types

LinkOut - more resources