. 2013 Oct;45(10):1141-9.
doi: 10.1038/ng.2734. Epub 2013 Aug 5.

The integrated landscape of driver genomic alterations in glioblastoma

Affiliations

The integrated landscape of driver genomic alterations in glioblastoma

Veronique Frattini et al. Nat Genet. 2013 Oct.

Abstract

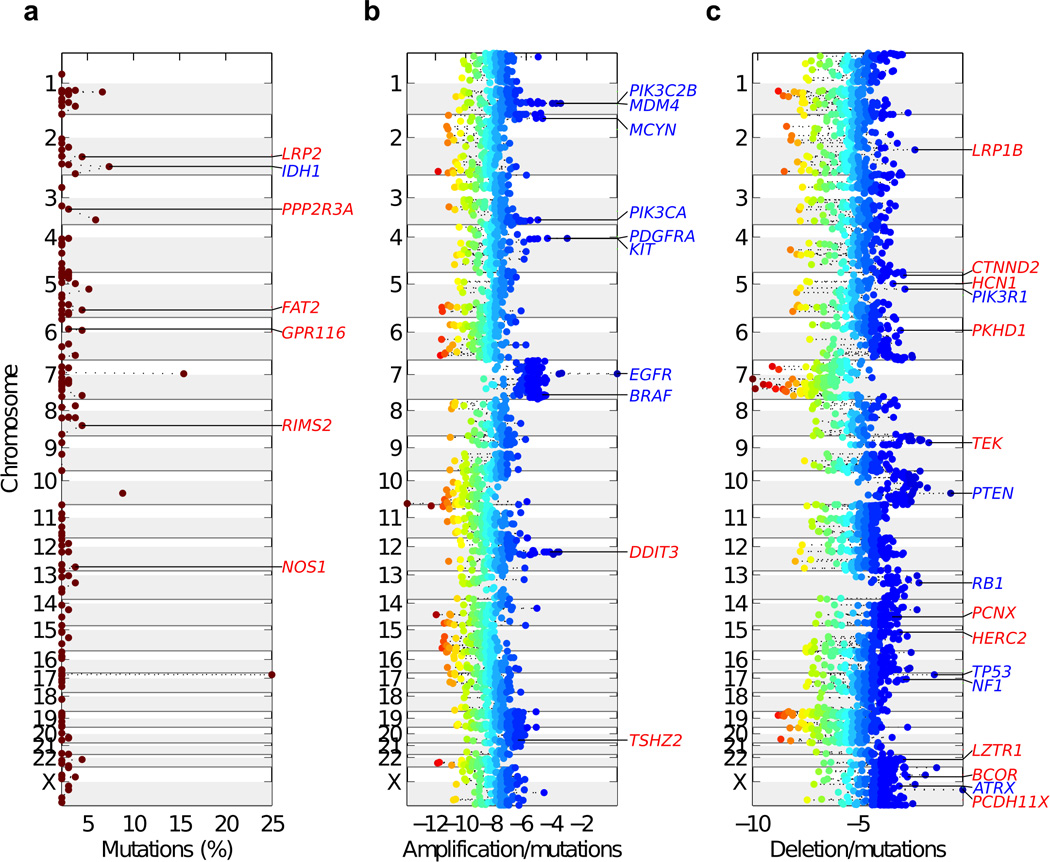
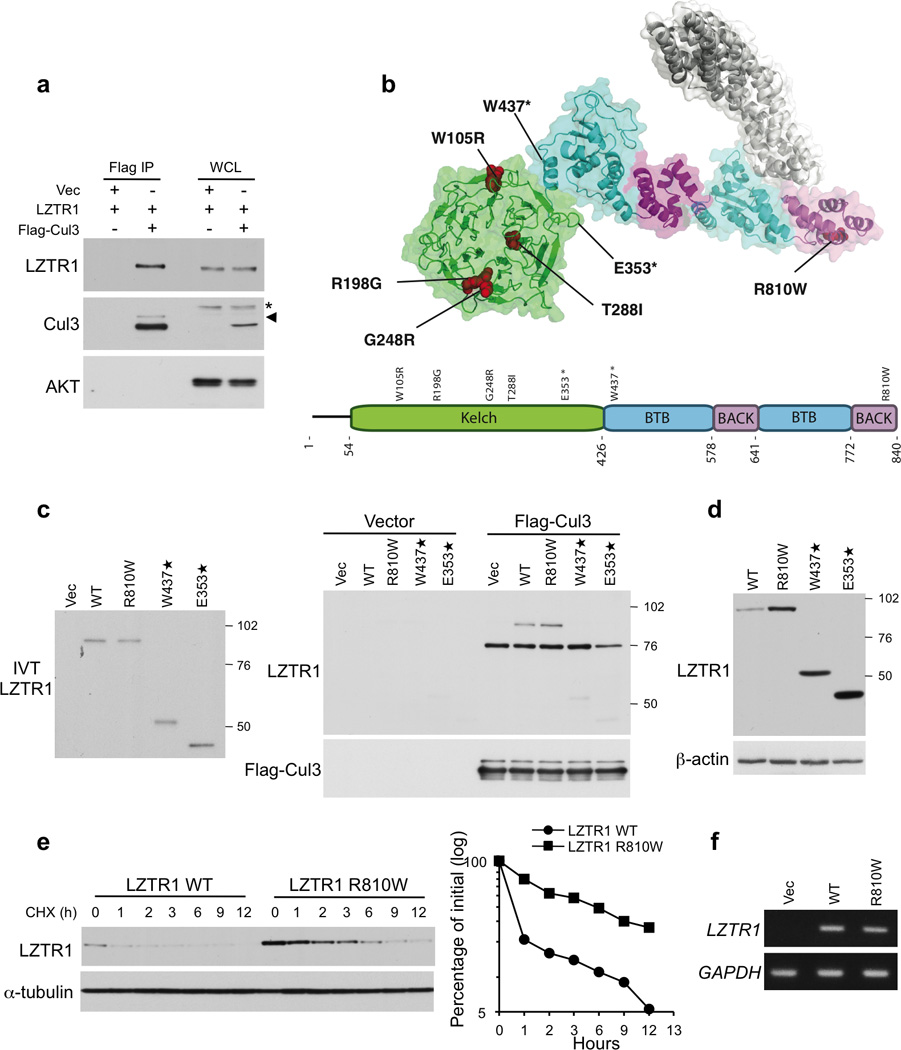
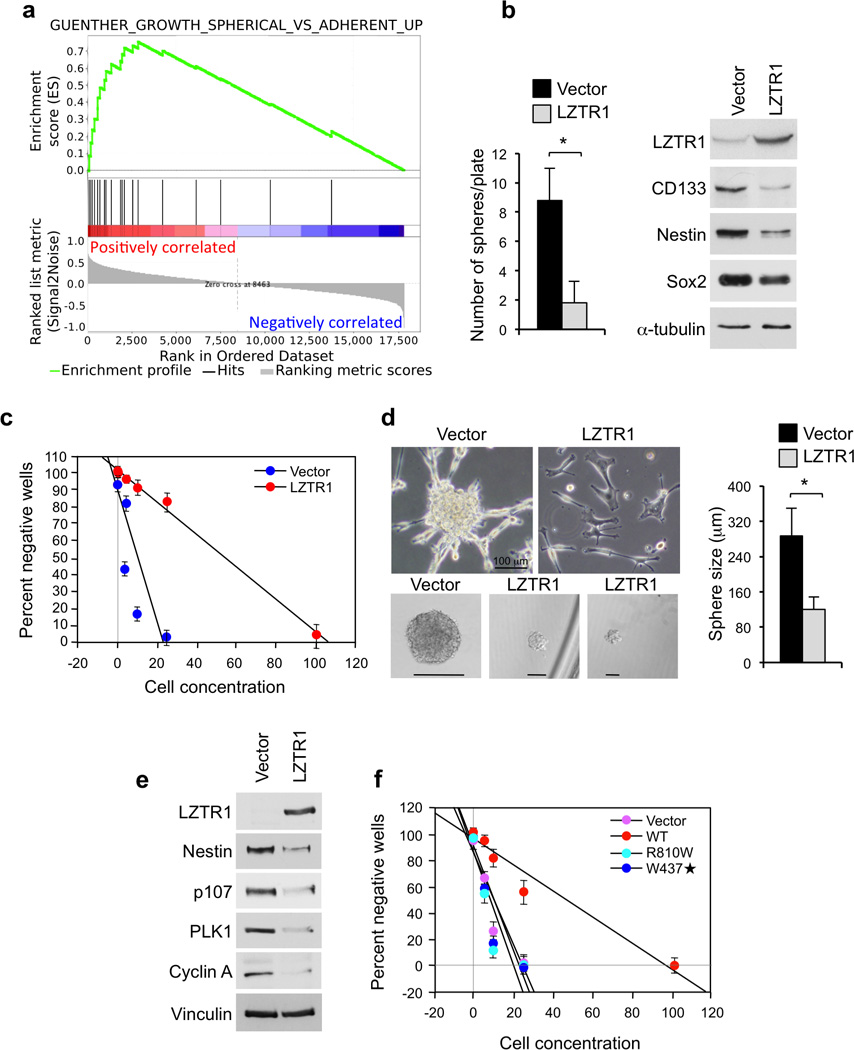
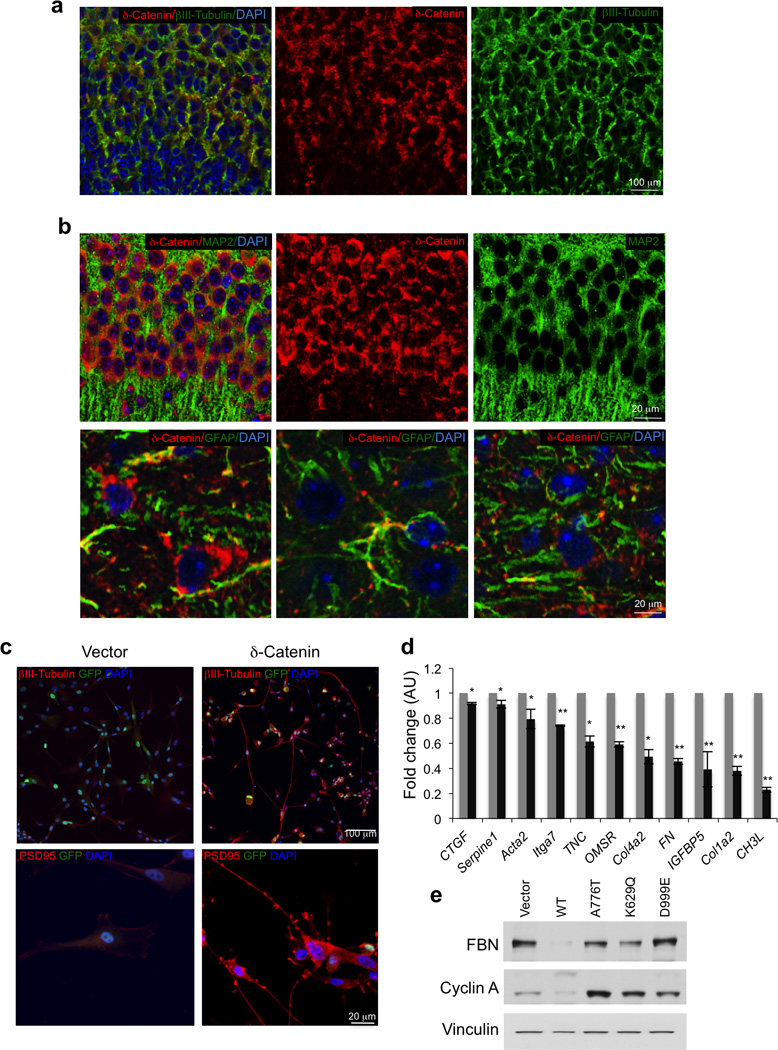
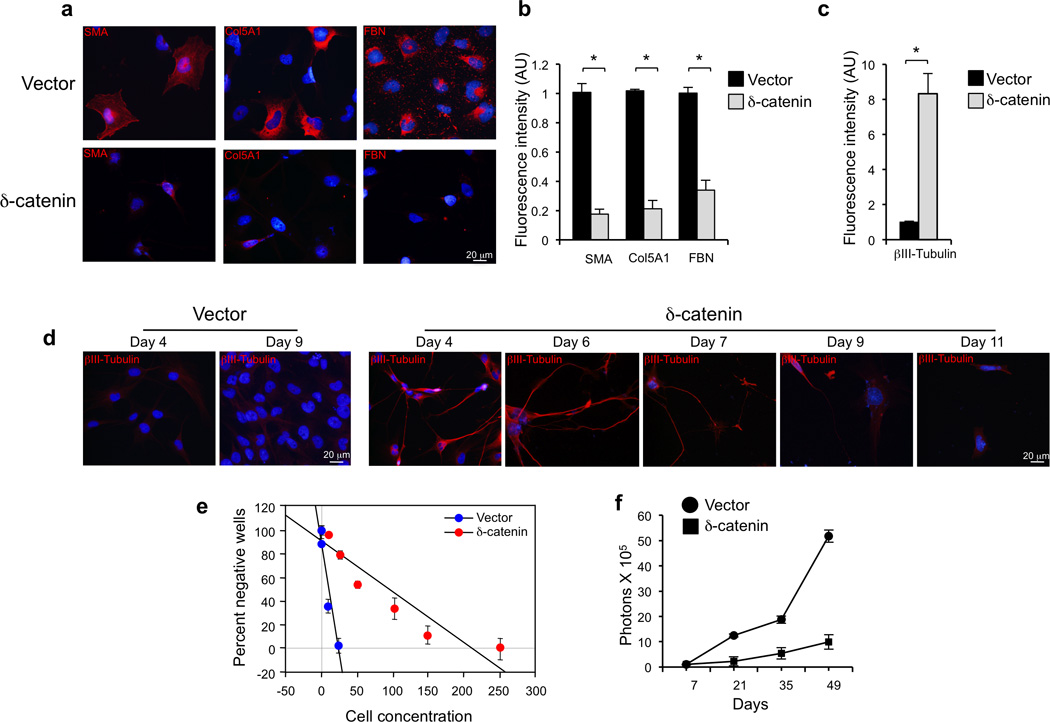
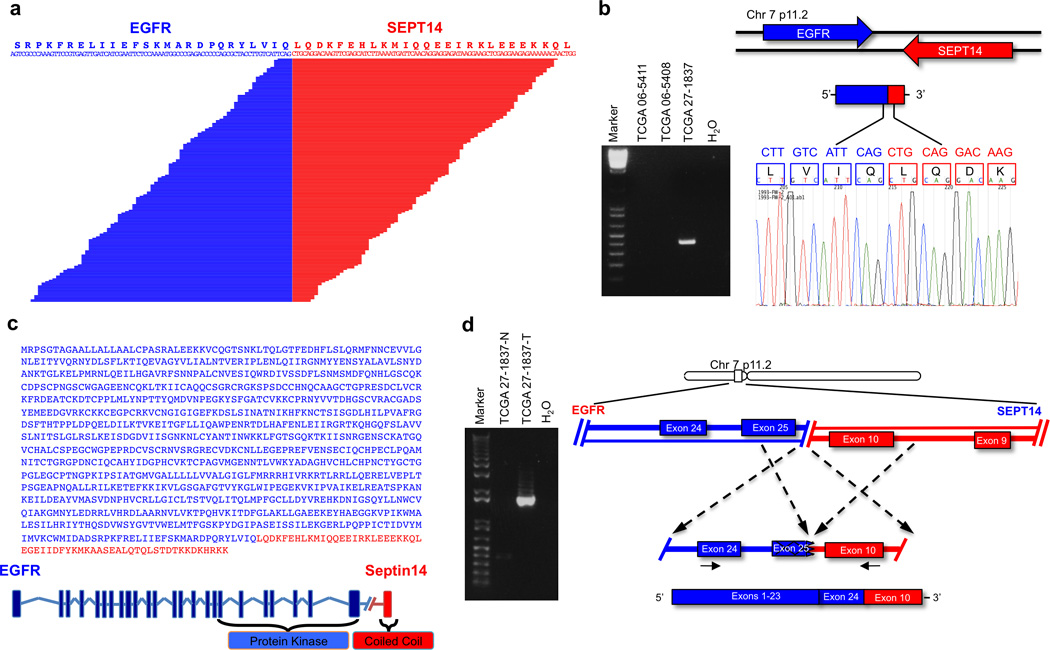
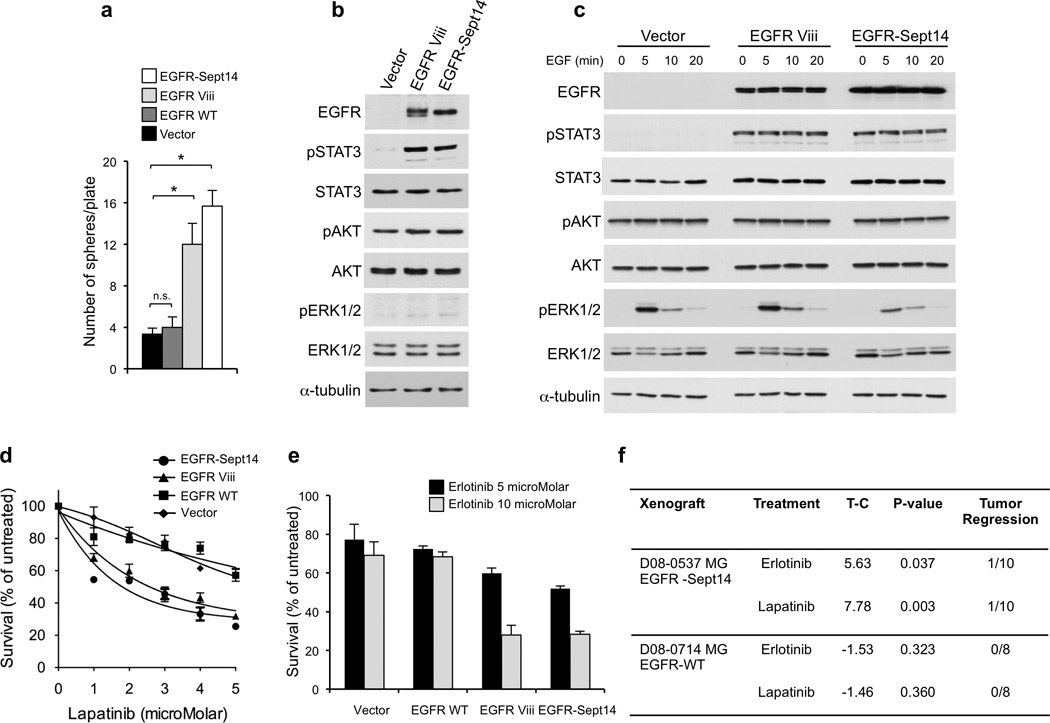
Glioblastoma is one of the most challenging forms of cancer to treat. Here we describe a computational platform that integrates the analysis of copy number variations and somatic mutations and unravels the landscape of in-frame gene fusions in glioblastoma. We found mutations with loss of heterozygosity in LZTR1, encoding an adaptor of CUL3-containing E3 ligase complexes. Mutations and deletions disrupt LZTR1 function, which restrains the self renewal and growth of glioma spheres that retain stem cell features. Loss-of-function mutations in CTNND2 target a neural-specific gene and are associated with the transformation of glioma cells along the very aggressive mesenchymal phenotype. We also report recurrent translocations that fuse the coding sequence of EGFR to several partners, with EGFR-SEPT14 being the most frequent functional gene fusion in human glioblastoma. EGFR-SEPT14 fusions activate STAT3 signaling and confer mitogen independence and sensitivity to EGFR inhibition. These results provide insights into the pathogenesis of glioblastoma and highlight new targets for therapeutic intervention.


Figures

Figure 1
Figure 1
Chromosome view of validated GBM genes scoring at the top of each of the three categories by MutComFocal. a, Mutated genes without significant copy number alterations (Mut, mutation %, frequency of mutations). b, Mutated genes in regions of focal and recurrent amplifications (Amp-Mut, Amplification/mutation scores). c, Mutated genes in regions of focal and recurrent deletions (Del-Mut, Deletion/mutation scores). Previously known GBM genes are indicated in blue, new and independently validated GBM genes are indicated in red. In panels b and c, the genes scores are colored according to their corresponding tier with blue corresponding to high tiers and red to low tiers.
Figure 2
Figure 2
Interaction with Cul3 and protein stability of wild type and mutant LZTR-1. a, Lysates from SF188 glioma cells transfected with vectors expressing Myc-LZTR-1 and Flag-Cul3 or the empty vector were immunoprecipitated with Flag antibody and assayed by western blot with the indicated antibodies. *, non specific band; arrowhead indicates neddylated Cul3. b, Localization of altered residues in LZTR-1. Homology model of the Kelch (green), BTB (cyan) and BACK (magenta) domains of LZTR-1 with the Cul3 N-terminal domain (white) docked onto the putative binding site. GBM mutations are indicated in red. c, In vitro analysis of the interaction between Cul3 and LZTR-1 wild type and GBM related mutants. Left panel, In vitro translated Myc-LZTR-1 input. Right panel, In vitro translated Myc-LZTR-1 was mixed with Flag-Cul3 immunoprecipitated from transfected HEK-293T cells. Bound proteins were analyzed by western blot using the indicated antibodies. d, Steady state protein levels of wild type LZTR-1 and GBM-related mutants. e, Left panel, Cells transfected with LZTR-1 wild type or the R810W mutant were treated with cycloexamide for the indicated time. Right panel, Quantification of LZTR-1 wild type and LZTR-1-R810W protein from the experiment in the left panel. f, Semi-quantitative RT-PCR evaluation of LZTR-1 wild type and LZTR-1-R810W RNA expression in cells transfected as in e.
Figure 3
Figure 3
Functional analysis of LZTR-1 wild type and GBM associated mutants in GBM-derived cells. a, GSEA shows up-regulation of genes associated with the phenotype of “spherical cultures” of glioma cells in primary human GBM carrying mutations in the LZTR-1 gene [Enrichment Score (ES) = 0.754; P (family-wise error rate, FWER) = 0.000 q (false discovery rate, FDR) = 0.000]. b, Sphere forming assay (left panel) and western blot analysis (right panel) of GBM-derived glioma spheres (#48) expressing vector or LZTR-1. Data are Mean±SD of triplicate samples (t-test, p = 0.0036). c, Linear regression plot of in vitro limiting dilution assay using GBM-derived glioma spheres #46 expressing vector or LZTR-1. The frequency of sphere forming cells was 8.49±1.04 and 1.44±0.05% in vector and LZTR-1 expressing cells, respectively (t-test, p = 0.00795). Each data point represents the average of triplicates. Error bars are SD. d, Left upper panels, Bright field microphotographs of GBM-derived line 46 cells six days after transduction with vector or LZTR-1 expressing lentivirus. Left lower panels, Bright field microphotographs of spheres from GBM-derived glioma cells #46 expressing lentivirus expressing vector or LZTR-1 from experiment in c. Right panel, The size of tumor spheres from cultures in c was determined by microscopy review after 14 days of culture. n = 60 spheres from triplicates for each condition. Data are Mean±SD (t-test, p < 0.0001). e, Western blot analysis of GBM-derived cells #84 expressing vector or LZTR-1. f, Linear regression plot of in vitro limiting dilution assay using GBM-derived line 84 expressing vector, LZTR-1, LZTR-1-R810W or LZTR-1-W437STOP. The frequency of sphere forming cells was 7.2±0.92 for vector, 1.48±0.09 for LZTR-1 wild type (p = 0.0096), 7.82±0.99 for LZTR-1-R810W (p = 0.2489), and 6.74±1.07 for LZTR-1-W437STOP (p = 0.2269). Error bars are SD, p is from t-test.
Figure 4
Figure 4
Expression of δ-catenin in neurons and δ-catenin driven loss of mesenchymal marker in GBM. a, Pattern of expression of δ-catenin in the developing brain, as determined by immunostaining. Double immunofluorescence staining of brain cortex using δ-catenin antibody (red) and βIII-tubulin (green); Nuclei are counterstained with Dapi (blue). b, Pattern of expression of δ-catenin in the adult brain, as determined by immunostaining. Upper panels, Double immunofluorescence staining of brain cortex using δ-catenin antibody (red) and MAP2 (green); Nuclei are counterstained with Dapi (blue). Lower panels, Double immunofluorescence staining of of brain cortex using δ-catenin antibody (red) and GFAP (green); Nuclei are counterstained with Dapi (blue). c, Immunofluorescence staining for βIII-tubulin (upper panels) and PSD95 (lower panels) in U87 cells expressing δ-catenin or the empty vector. d, Expression of mesenchymal genes in glioma cells expressing δ-catenin or the empty vector (averages of triplicate quantitative RT-PCR). Error bars are SD p is from t-test. *, p ≤ 0.005; **, p ≤ 0.001. e, Western blot using the indicated antibodies for U87 cells expressing δ-catenin wild type, glioma–associated δ-catenin mutants or the empty vector. FBN, fibronectin. Vinculin is shown as control for loading.
Figure 5
Figure 5
Functional analysis of CTNND2 in mesenchymal GBM. a, Immunofluorescence for fibronectin, collagen-5α1 (COL5A1) and smooth muscle actin (SMA) in glioma spheres #48 four days after infection with lentiviruses expressing δ-catenin or the empty vector. Nuclei are counterstained with Dapi. b, Quantification of fluorescence intensity for SMA, COL5A1 and FBN for cultures treated as in a. n = 3 independent experiments; data indicate mean±SD. c, Quantification of fluorescence intensity for βIII-tubulin in cells #48 infected with lentiviruses expressing CTNND2 or the empty vector. d, Time course analysis of βIII-tubulin expression in glioma spheres #48 transduced with lentiviruses expressing CTNND2 or the empty vector. Note the loss from the advanced culture of βIII-Tubulin expressing cells. e, Linear regression plot of in vitro limiting dilution assay using GBM-derived cells #48 expressing vector or δ-catenin. The frequency of sphere forming cells was 7.42±1.16 and 0.88±0.02 for vector and δ-catenin, respectively (t-test, p = 0.0098). Error bars are SD. f, Longitudinal analysis of bioluminescence imaging in mice injected intracranially with GBM-derived line 48 expressing vector or δ-catenin. n = 3 mice for vector and 5 for δ-catenin. Symbols are the mean and bars are SEM of photon counts.
Figure 6
Figure 6
EGFR-SEPT14 gene fusion identified by whole transcriptome sequencing. a, Split reads are shown aligning on the breakpoint. The predicted reading frame at the breakpoint is shown at the top with EGFR sequences in blue and SEPT14 in red. b, (left panel), EGFR-SEPT14-specific PCR from cDNA derived from GBMs. Marker, 1kb ladder. (right panel), Sanger sequencing chromatogram showing the reading frame at the breakpoint and putative translation of the fusion protein in the positive sample. c, EGFR-Septin14 fusion protein sequence and schematics. Regions corresponding to EGFR and Septin14 are shown in blue and red, respectively. The fusion joins the tyrosine kinase domain of EGFR and the Coiled-coil domain of Septin14. d, Genomic fusion of EGFR exon 25 with intron 9 of SEPT14. In the fuse mRNA exon 24 of EGFR is spliced 5’ to exon 10 of SEPT14. Solid arrows indicate the position of the fusion genome primers that generate a fusion specific PCR product in the GBM sample TCGA-27–1837.
Figure 7
Figure 7
Functional analysis of EGFR-SEPT14 fusion and effect of inhibition of EGFR kinase on glioma growth. a, Sphere forming assay in the absence of EGF of GBM-derived primary cells (#48) expressing vector, EGFR wild type, EGFR Viii or EGFR-SEPT14 fusion. Data are Mean±SD of triplicate samples (t-test, p = 0.0051 and p = 0.027 for EGFR-SEPT14 fusion and EGFR Viii compared with vector, respectively). b, Western blot analysis of GBM-derived primary cells (#48) expressing vector, EGFR Viii or EGFR-SEPT14 fusion cultured in the presence of EGF. c, GBM-derived cells (#48) expressing vector, EGFR Viii or EGFR-SEPT14 fusion were cultured in the absence of EGF for 48 h and then stimulated with EGF 20ng/ml for the indicated time. Cells were assayed by western blot using the indicated antibodies. d, Survival of GBM-derived cells (#48) expressing vector, EGFR wild type, EGFR Viii or EGFR-SEPT14 fusion after treatment with lapatinib for 48 h at the indicated concentrations. Data are Mean±SD of triplicate samples. e, Survival of GBM-derived cells (#48) expressing vector, EGFR wild type, EGFR Viii or EGFR-SEPT14 fusion after treatment with erlotinib for 48 h at the indicated concentrations. Data are Mean±SD of triplicate samples. Experiments were repeated three times. f, In vivo inhibition of tumor growth by EGFR kinase inhibitors in glioma patient derived xenografts carrying EGFR-SEPT14 fusion (n = 10) but not wild type EGFR (n = 8). T-C indicates the median difference in survival between drug treated and vehicle (control) treated mice.

Comment in

References

    1. Porter KR, McCarthy BJ, Freels S, Kim Y, Davis FG. Prevalence estimates for primary brain tumors in the United States by age, gender, behavior, and histology. Neuro-oncology. 2010;12:520–527. - PMC - PubMed
    1. Stupp R, et al. Radiotherapy plus concomitant and adjuvant temozolomide for glioblastoma. New Engl. J. Med. 2005;352:987–996. - PubMed
    1. Cancer Genome Atlas Research. N Comprehensive genomic characterization defines human glioblastoma genes and core pathways. Nature. 2008;455:1061–1068. - PMC - PubMed
    1. Noushmehr H, et al. Identification of a CpG island methylator phenotype that defines a distinct subgroup of glioma. Cancer Cell. 2010;17:510–522. - PMC - PubMed
    1. Parsons DW, et al. An integrated genomic analysis of human glioblastoma multiforme. Science. 2008;321:1807–1812. - PMC - PubMed

Publication types