. 2013:3:2363.
doi: 10.1038/srep02363.

Intense THz pulses down-regulate genes associated with skin cancer and psoriasis: a new therapeutic avenue?

Affiliations

Intense THz pulses down-regulate genes associated with skin cancer and psoriasis: a new therapeutic avenue?

Lyubov V Titova et al. Sci Rep. 2013.

Abstract

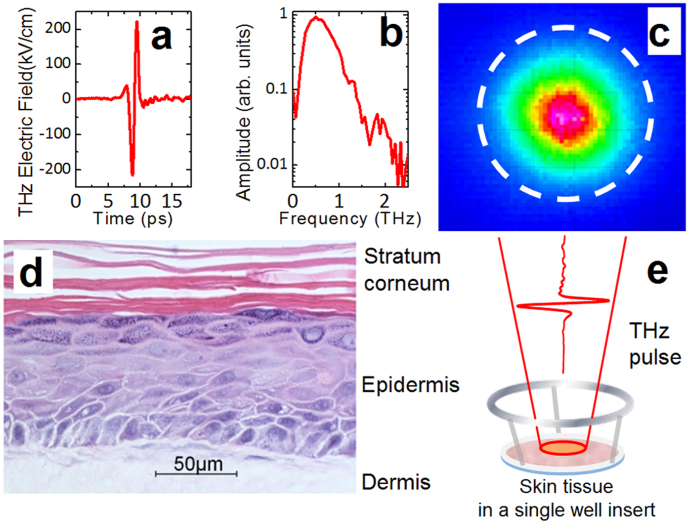
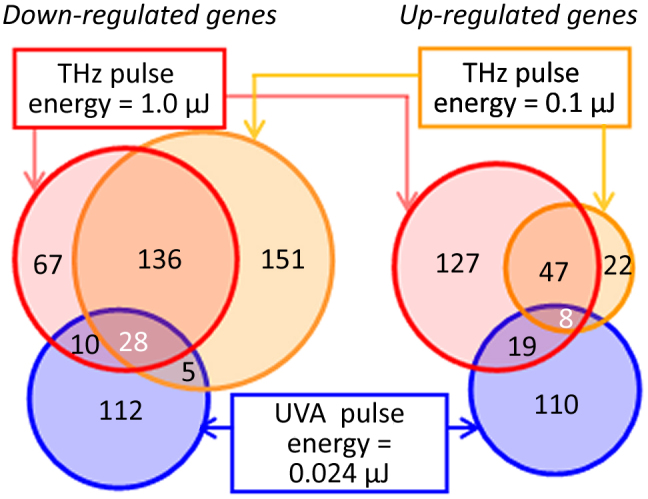
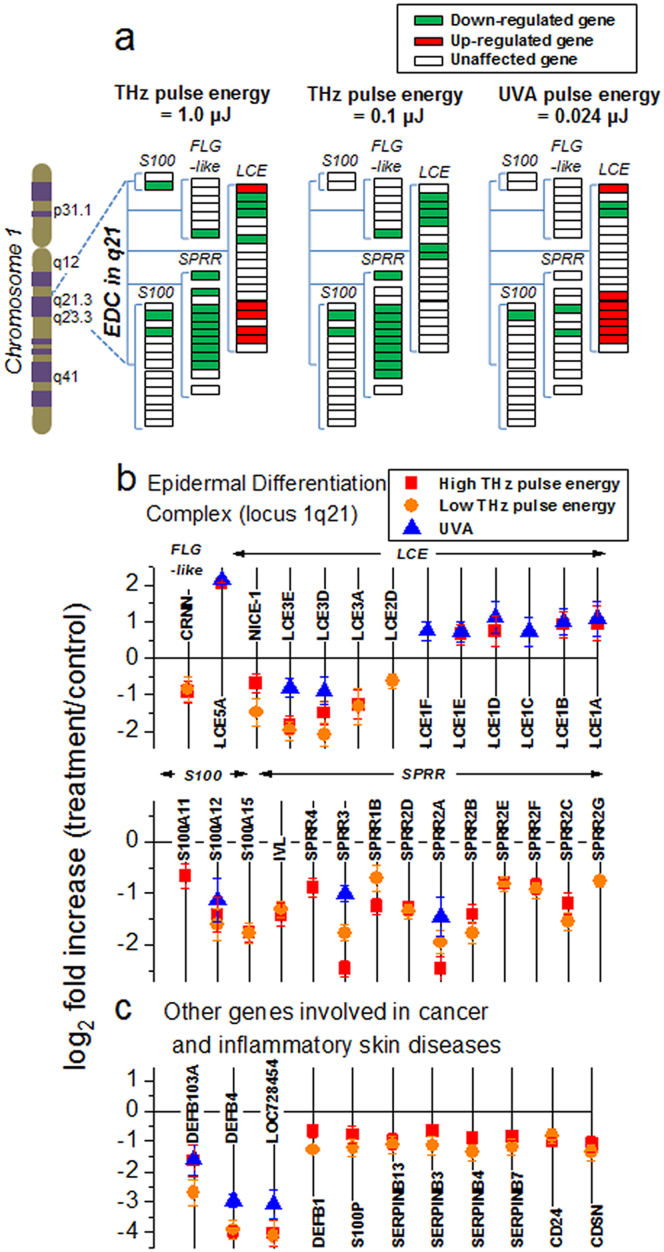
Terahertz (THz) radiation lies between the infrared and microwave regions of the electromagnetic spectrum and is non-ionizing. We show that exposure of artificial human skin tissue to intense, picosecond-duration THz pulses affects expression levels of numerous genes associated with non-melanoma skin cancers, psoriasis and atopic dermatitis. Genes affected by intense THz pulses include nearly half of the epidermal differentiation complex (EDC) members. EDC genes, which are mapped to the chromosomal human region 1q21, encode for proteins that partake in epidermal differentiation and are often overexpressed in conditions such as psoriasis and skin cancer. In nearly all the genes differentially expressed by exposure to intense THz pulses, the induced changes in transcription levels are opposite to disease-related changes. The ability of intense THz pulses to cause concerted favorable changes in the expression of multiple genes implicated in inflammatory skin diseases and skin cancers suggests potential therapeutic applications of intense THz pulses.


Figures

Figure 1
Figure 1. Intense THz pulses and skin tissue samples used in this study.
(a) Electric field wave form of the THz pulse. (b) Spectral bandwidth of the THz pulse shown in (a). (c) THz spot profile at the focus. The 1/e2 diameter of the THz beam is 1.5 mm. The 2 mm-diameter dashed circle shows the portion of the tissue that was excised for gene profiling. (d) Histology of an EpiDermFT tissue section (400X image, courtesy of MatTek). (e) Schematic illustration of the THz exposure procedure. The EpiDermFT tissue is in a single well insert placed at the focus of THz beam.
Figure 2
Figure 2. Intense THz-pulse-induced gene expression in human skin.
Venn diagrams summarizing differentially-expressed genes in EpiDermFT tissues exposed to either 1.0 μJ or 0.1 μJ THz or UVA (400 nm, 0.024 μJ) pulses, as described in Materials and Methods. Genes with a False Discovery Rate (FDR)-adjusted p-value < 0.05 and log2 fold change > 0.6 (1.5× change) were considered differentially expressed. Left diagram: down-regulated genes. Right diagram: up-regulated genes. The complete lists of the affected genes, the fold change and p-values are given in Supplementary Tables S1, S2 and S3.
Figure 3
Figure 3. Differentially expressed Epidermal Differentiation Complex (EDC) genes and selected other genes associated with non-melanoma skin cancer or inflammatory skin diseases.
(a) EDC genes that were either up-regulated (green rectangles) or down-regulated (red rectangle) after exposure of skin tissues to either 1.0 μJ or 0.1 μJ THz pulse energies, or UVA pulses. Unaffected genes are depicted as white rectangles. (b) log2 fold changes for differentially-expressed genes belonging to four families of EDC genes (FLG-like, LCE, S100, and SPRR). (c) Other genes (selected) involved in dermatological diseases and cancer, whose expression levels were altered by exposure to both THz pulse energy regimes. In (b) and (c), error bars indicate corresponding standard deviations, and in some cases are smaller than the symbol size. Mean values of three biological or technical replicates, log2 fold changes relative to control mean values, and FDR-adjusted p-values for genes in (b) and (c) are given in Supplementary Table S4. Individual replicates, mean values and corresponding standard deviations are given in Supplementary Table S5.

References

    1. Tonouchi M. Cutting-edge terahertz technology. Nat. Photonics 1, 97–105 (2007).
    1. Fitzgerald A. J. et al. An introduction to medical imaging with coherent terahertz frequency radiation. Phys. Med. Biol. 47, R67–84 (2002). - PubMed
    1. Ashworth P. C. et al. Terahertz pulsed spectroscopy of freshly excised human breast cancer. Opt. Express 17, 12444–54 (2009). - PubMed
    1. Woodward R. M., Wallace V. P., Arnone D. D., Linfield E. H. & Pepper M. Terahertz pulsed imaging of skin cancer in the time and frequency domain. J. Biol. Phys. 29, 257–9 (2003). - PMC - PubMed
    1. Yu C., Fan S., Sun Y. & Pickwell-Macpherson E. The potential of terahertz imaging for cancer diagnosis: A review of investigations to date. Quant. Imaging Med. Surg. 2, 33–45 (2012). - PMC - PubMed

Publication types