. 2015 Apr;24 Suppl 2(Suppl 2):197-208.
doi: 10.1007/s00586-013-2915-1. Epub 2013 Aug 6.

Advances in MR imaging for cervical spondylotic myelopathy

Affiliations

Advances in MR imaging for cervical spondylotic myelopathy

Benjamin M Ellingson et al. Eur Spine J. 2015 Apr.

Abstract

Purpose: To outline the pathogenesis of cervical spondylotic myelopathy (CSM), the correlative abnormalities observed on standard magnetic resonance imaging (MRI), the biological implications and current status of diffusion tensor imaging (DTI), and MR spectroscopy (MRS) as clinical tools, and future directions of MR technology in the management of CSM patients.

Methods: A systematic review of the pathogenesis and current state-of-the-art in MR imaging technology for CSM was performed.

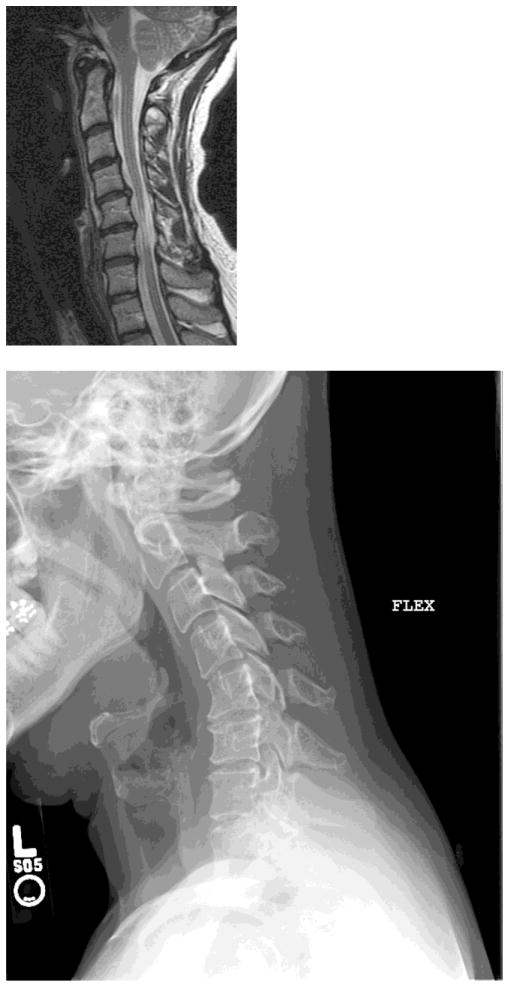
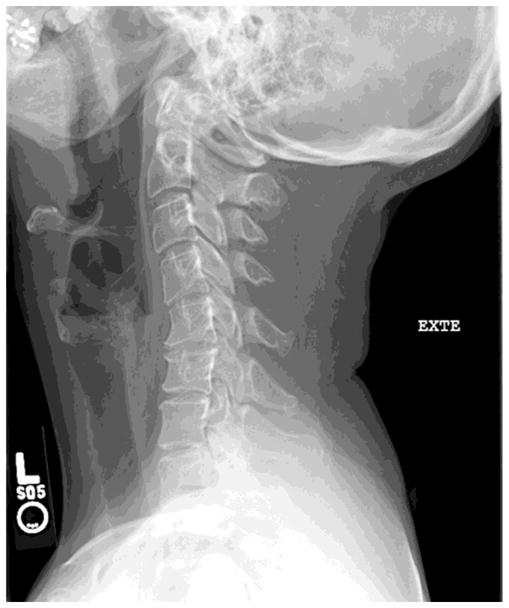
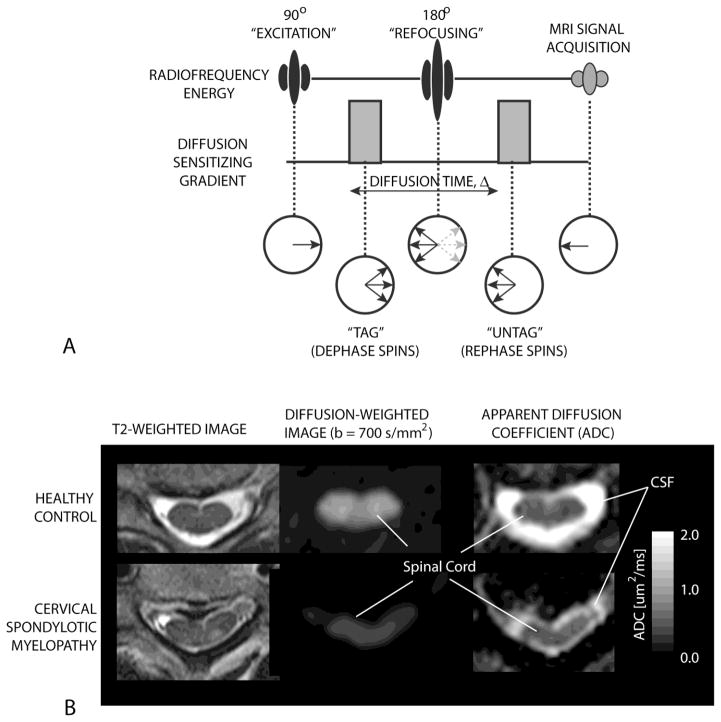
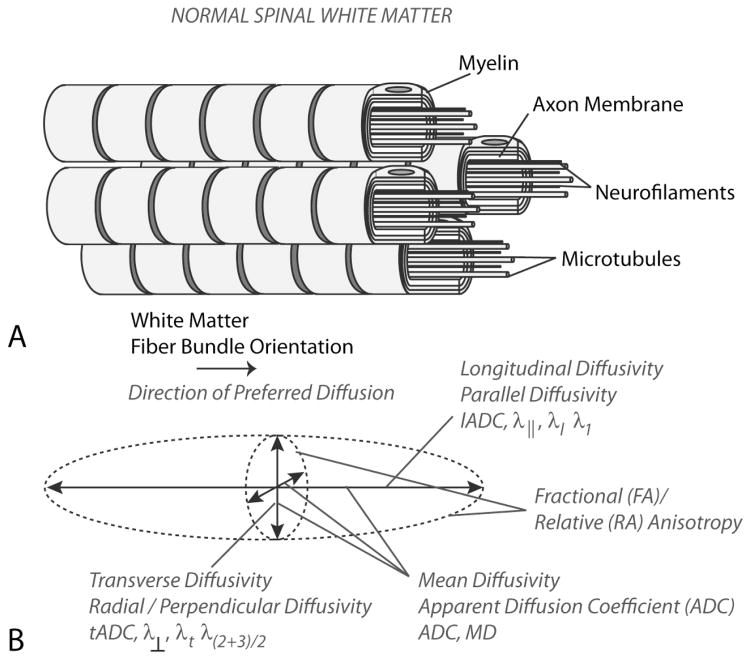
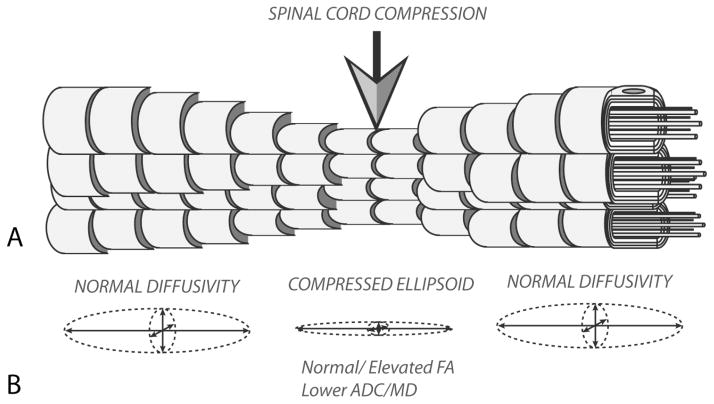
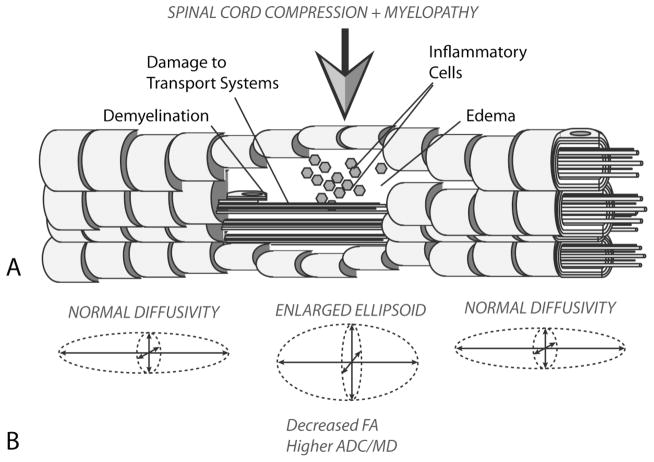
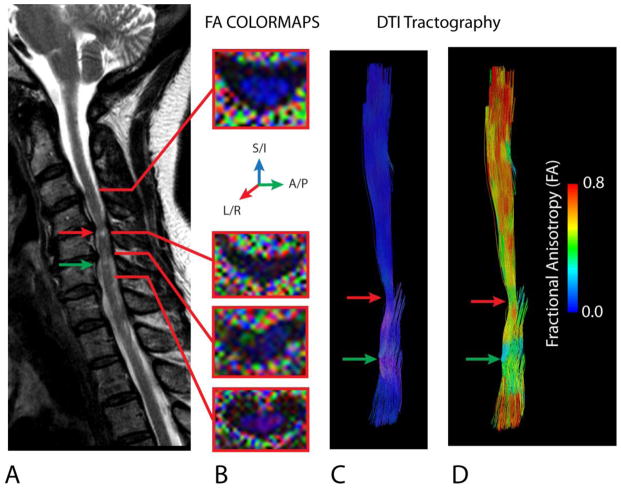
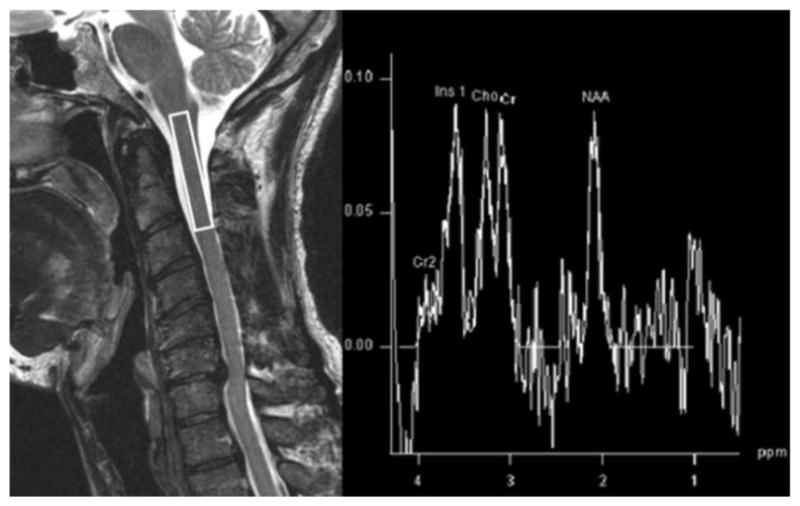
Results: CSM is caused by progressive, degenerative, vertebral column abnormalities that result in spinal cord damage related to both primary mechanical and secondary biological injuries. The T2 signal change on conventional MRI is most commonly associated with neurological deficits, but tends not to be a sensitive predictor of recovery of function. DTI and MRS show altered microstructure and biochemistry that reflect patient-specific pathogenesis.

Conclusion: Advanced imaging techniques, including DTI and MRS, show higher sensitivity to microstructural and biochemical changes within the cord, and may aid in management of CSM patients.


Figures

Figure 1
Figure 1. Cervical Spondylotic Myelopathy
A) Cervical spine MRI of a 45 year old woman with CSM demonstrating extensive spinal cord atrophy and T2 weighted signal change at the C5 and C6 levels despite the absence of frank spinal cord compression. This spinal cord damage was caused by repetitive shear injury across the ventral disc bulges during flexion (B) and extension (C).
Figure 2
Figure 2. Diffusion weighted imaging (DWI) of the spinal cord
A) The pulse sequence diagram (top) and water hydrogen spin dynamics (bottom) during a one-dimensional DI experiment. The use of pulsed “diffusion sensitizing” magnetic field gradients tags the water hydrogens by dephasing them at one time point and then untags them by rephrasing them at a later time point. Water hydrogens that are stationary will completely rephase and lead to maximum signal intensity on DWIs. Water hydrogens that are moving (i.e. diffusion) will have incomplete rephasing resulting in loss of signal amplitude by S=S0 e−bADC, where S is the MRI signal amplitude (image intensity) with diffusion weighting, S0 is the MRI signal amplitude (image intensity) without diffusion weighting, b is the “b-value” or the level of diffusion weighting (dependent on the gradient amplitude, duration, etc.), and ADC is the apparent diffusion coefficient. B) Example T2-weighted (left), diffusion weighted (middle), and ADC maps (right) for a healthy control volunteer (top) and patient with cervical spondylotic myelopathy (bottom). Note that at the site of chronic compression the signal intensity on DWIs is decreased and ADC is increased relative to the normal spinal cord.
Figure 3
Figure 3. Microstructure and Diffusion Characteristics of Healthy Spinal White Matter
A) Model of axon bundles showing boundaries to diffusion in the transverse orientation, including myelin, axon membranes, neurofilaments, and microtubules. B) The diffusion ellipsoid model derived from the traditional diffusion tensor shows anisotropic diffusion with preferred diffusion in the direction of white matter fiber bundles, with lower ADC in the transverse orientation and higher ADC in the longitudinal orientation.
Figure 4
Figure 4. Microstructure and Diffusion Characteristics of Acute Spinal Cord Compression
A) During acute compression of spinal cord white matter fibers are compressed and blood flow to these regions is reduced, resulting in transient ischemia. B) Transient, acute compression of the spinal cord results in compression of the diffusion ellipsoid, resulting in lower ADC and, in some cases, localized increases in FA values relative to adjacent spinal segments.
Figure 5
Figure 5. Pathological Changes and Diffusion Characteristics in Cervical Spondylotic Myelopathy
A) After chronic compression of the spinal cord resulting in sustained ischemia, white matter tracks eventually degenerate, resulting in demyelination, damage to axon transport systems, the influx of inflammatory cells, and vasogenic edema, which eventually leads to functional impairment. B) ADC increases and FA decreases in the site of chronic compression due to the increased extracellular water concentration and decreased fiber tract density, respectively.
Figure 6
Figure 6. Disruption of Fiber Orientation in CSM
A) Sagittal T2-weighted image of a 65 year old female patient with CSM showing T2 hyperintensity at the site of most severe spinal cord compression. B) FA colormaps showing the orientation of the primary eigenvector (blue = superior/inferior; green = anterior/posterior; red = left/right) in the normal-appearing spinal cord (top image at C3–4) and regions of compression (bottom images). Note that in areas of compression that FA is low (dark) and the orientation of the primary eigenvalue is deflected from the superior/inferior (blue) orientation, resulting in other colors appearing within the spinal cord. C) DTI tractography labeled (colored) with respect to the primary eigenvalue orientation shows deflection (pink regions) through the area of compression. D) DTI tractography labeled (colored) with respect to fractional anisotropy (FA) shows a decrease in FA at the site of primary eigenvalue deflection. Red arrows = area of significant compression resulting in T2 hyperintensity. Green arrow = second area of compression caudal from the first lesion.
Figure 7
Figure 7
MRS obtained with voxel at the C2 level in a 60 year old gentleman with CSM. The MRS spectra demonstrate a low NAA/Cr ratio indicative of axonal and neuronal injury.

References

    1. Song T, Chen WJ, Yang B, Zhao HP, Huang JW, Cai MJ, Dong TF, Li TS. Diffusion tensor imaging in the cervical spinal cord. Eur Spine J. 2011;20:422–428. - PMC - PubMed
    1. Demir A, Ries M, Moonen CT, Vital JM, Dehais J, Arne P, Caille JM, Dousset V. Diffusion-weighted MR imaging with apparent diffusion coefficient and apparent diffusion tensor maps in cervical spondylotic myelopathy. Radiology. 2003;229:37–43. - PubMed
    1. Facon D, Ozanne A, Fillard P, Lepeintre JF, Tournoux-Facon C, Ducreux D. MR diffusion tensor imaging and fiber tracking in spinal cord compression. AJNR Am J Neuroradiol. 2005;26:1587–1594. - PMC - PubMed
    1. Hernandez E, Mackay AL, MacMillan EL, Madler B, Li DK, Dvorak MF, Cordova T, Ramirez-Manzanares A, Laule C. Diffusion tensor imaging of subjects with Cervical Spondylotic Myelopathy: use of the eigenvalues as indicators of spinal stenosis. Proc Intl Soc Mag Reson Med. 2009;17:1309.
    1. Jones JG, Cen SY, Lebel RM, Hsieh PC, Law M. Diffusion Tensor Imaging Correlates with the Clinical Assessment of Disease Severity in Cervical Spondylotic Myelopathy and Predicts Outcome following Surgery. AJNR Am J Neuroradiol 2012 - PMC - PubMed

Publication types