. 2013 Aug 6:9:683.
doi: 10.1038/msb.2013.39.

Bacterial cheating drives the population dynamics of cooperative antibiotic resistance plasmids

Affiliations

Bacterial cheating drives the population dynamics of cooperative antibiotic resistance plasmids

Eugene A Yurtsev et al. Mol Syst Biol. .

Abstract

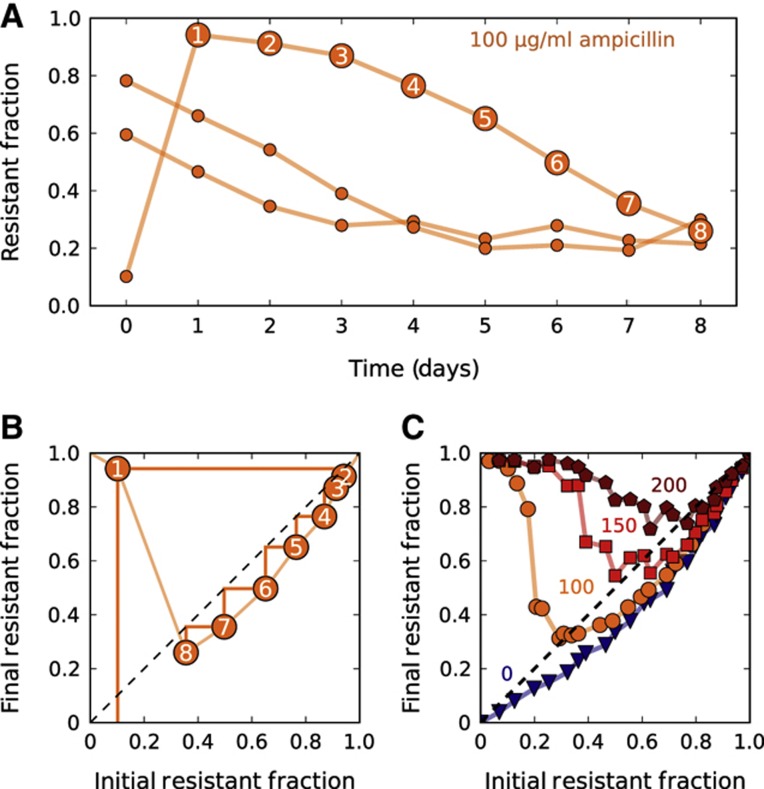
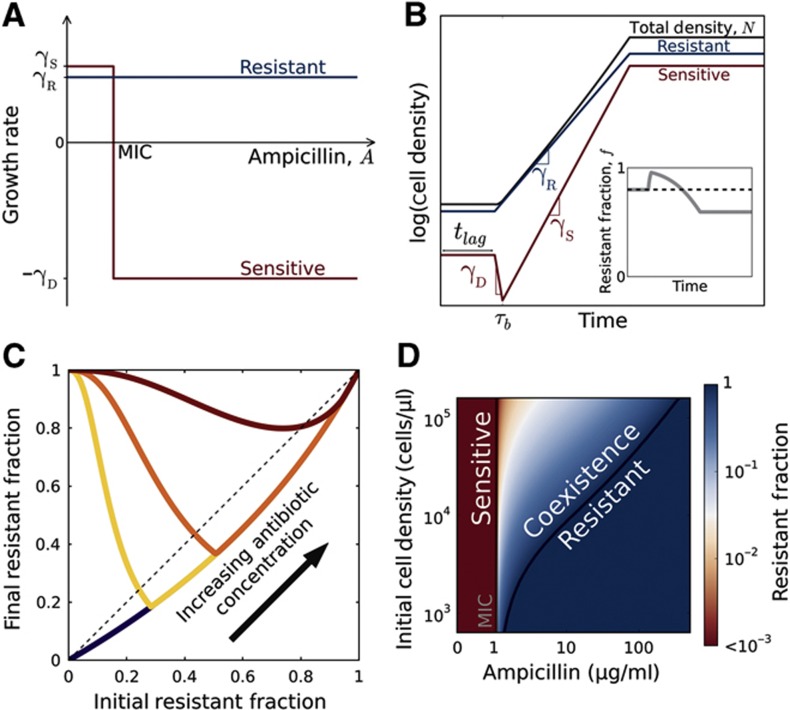
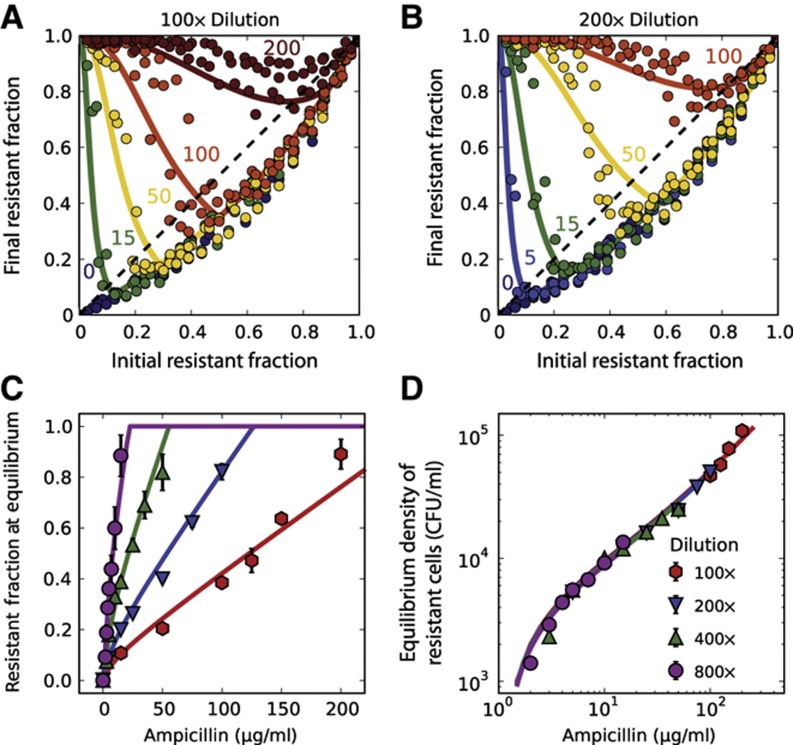
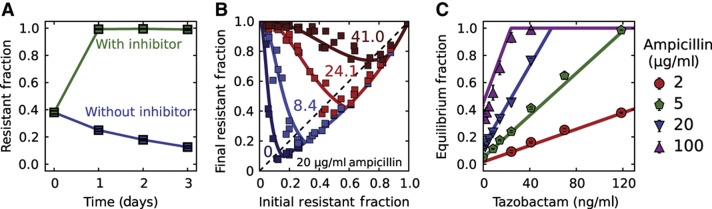
Inactivation of β-lactam antibiotics by resistant bacteria is a 'cooperative' behavior that may allow sensitive bacteria to survive antibiotic treatment. However, the factors that determine the fraction of resistant cells in the bacterial population remain unclear, indicating a fundamental gap in our understanding of how antibiotic resistance evolves. Here, we experimentally track the spread of a plasmid that encodes a β-lactamase enzyme through the bacterial population. We find that independent of the initial fraction of resistant cells, the population settles to an equilibrium fraction proportional to the antibiotic concentration divided by the cell density. A simple model explains this behavior, successfully predicting a data collapse over two orders of magnitude in antibiotic concentration. This model also successfully predicts that adding a commonly used β-lactamase inhibitor will lead to the spread of resistance, highlighting the need to incorporate social dynamics into the study of antibiotic resistance.


Conflict of interest statement

The authors declare that they have no conflict of interest.

Figures

Figure 1
Figure 1
In the presence of resistant cells, sensitive cells can survive at otherwise lethal antibiotic concentrations. (A) Experimental time traces showing the evolutionary dynamics between sensitive E. coli and an isogenic strain that is resistant as the result of a plasmid containing a β-lactamase gene. A single resistant and a single sensitive colony were used to create three cultures with a different initial fraction of resistant cells. These three cultures were then grown for 1 day in the absence of ampicillin to make sure that resistant and sensitive cells experienced the same growth conditions (see Materials and methods). Then, every 23 h, the fraction of resistant cells was measured using flow cytometry, and the cultures were diluted by a factor of 100 × into fresh media containing 100 μg/ml ampicillin. Each data point represents a single flow cytometry measurement. (B) The orange time trace that starts at ∼10% in subplot (A) was replotted as a difference equation map that shows how the resistant fraction on day n+1 depends on the fraction on day n. The light orange line is an estimation of the difference equation. A simple trick to estimate the time dynamics with a difference equation is to use cobwebbing (dark orange lines), in which the daily dynamics are obtained by bouncing back and forth between the data line and the dashed diagonal line. (C) For each antibiotic concentration (indicated adjacent to each curve), a difference equation map was obtained experimentally by starting populations at 24 different initial fractions and measuring the final fraction after 23 h of growth. The intersection of a given difference equation map with the diagonal line represents the equilibrium fraction for that particular condition.
Figure 2
Figure 2
A simple model describes the population dynamics of a cooperative antibiotic resistance plasmid in the β-lactam antibiotic ampicillin. (A) Growth rates of resistant (blue) and sensitive (red) bacteria as a function of antibiotic concentration. Free of the metabolic cost associated with resistance, sensitive cells grow faster than resistant cells (γSR) at antibiotic concentrations below the MIC of the sensitive bacteria. Above the MIC, sensitive cells die at a rate of γD. (B) The population dynamics within a single competition cycle (1 day). During the lag phase (t<tlag), neither cell type divides nor dies, but the antibiotic is constantly hydrolyzed by resistant cells. After the lag phase, each sub-population grows at a rate that depends on the extracellular antibiotic concentration. At time τb, the extracellular antibiotic concentration drops below the MIC of the sensitive cells. Cell growth ceases when the total population density reaches saturation. Inset: the time trace of the resistant fraction within a single day. (C) The model gives rise to difference equations that resemble experimental data (Figures 1C, 3A, and B). (D) The equilibrium-resistant fraction predicted by our model as a function of the antibiotic concentration and the initial cell density. According to the model, coexistence between resistant and sensitive cells is possible at antibiotic concentrations above the MIC of sensitive cells.
Figure 3
Figure 3
Experimental difference equations confirm model predictions regarding the equilibria and dynamics of resistant and sensitive bacteria. (A, B) Experimental difference equations obtained at two dilution factors (100 × and 200 × ) and different antibiotic concentrations. At a given antibiotic concentration, an increase in the dilution ratio leads to stronger selection for resistance. Each difference equation plotted in (A, B) includes the data obtained on three different days. Measurement error from flow cytometry was typically smaller than symbol size. (C) The equilibrium fractions as a function of ampicillin concentration at four different dilution factors (see Supplementary Figure S13 for difference equations). The relationship is approximately linear for antibiotic concentrations higher than KM. The equilibrium fractions were extracted from the difference equation plots by determining the intersection between the difference equations and the diagonal line (dashed line in A). Error bars represent standard error of the mean (n=3). (D) Plotting the initial density of resistant cells at equilibrium as a function of antibiotic concentration reveals a data collapse that extends over two orders of magnitude in the concentration. (AD) Solid curves show a single fit of the model to all the experimental data.
Figure 4
Figure 4
As predicted by the model, addition of the β-lactamase inhibitor tazobactam increases the fraction of resistant cells in the population. (A) Sensitive E. coli cells increase in frequency when grown in 20 μg/ml ampicillin in the absence of tazobactam; however, the addition of the inhibitor at a concentration of 1000, ng/ml results in a completely resistant bacterial population. Cultures were diluted daily by a factor of 100 × into fresh media containing 20 μg/ml ampicillin. Error bars represent standard error of the mean of four different bacterial cultures. (B) Experimental difference equation maps for four different concentrations of the inhibitor tazobactam (in ng/ml) at a background of 20 μg/ml ampicillin and a dilution factor of 100 × (see Supplementary Figure S17 for more difference equations). Each difference equation map contains the data obtained on three different days. (C) As predicted by the model, the equilibrium fractions depend linearly on the concentration of the inhibitor tazobactam with a slope that depends on the ampicillin concentration. The equilibrium fractions were extracted from the difference equation plots by determining the intersection between the difference equations and the diagonal line (dashed line in A). Error bars represent standard error of the mean (n=3). (B, C) Solid curves show a fit of the model to all the experimental data with a single free parameter of KI=4.6 ng/ml (other parameters held fixed).

References

    1. Andersson DI (2006) The biological cost of mutational antibiotic resistance: any practical conclusions? Curr Opin Microbiol 9: 461–465 - PubMed
    1. Bonomo RA, Tolmasky ME (eds) (2007) Enzyme-Mediated Resistance to Antibiotics: Mechanisms, Dissemination, and Prospects for Inhibition 1st edn. Amer Society for Microbiology: Washington, DC,
    1. Bouma JE, Lenski RE (1988) Evolution of a bacteria/plasmid association. Nature 335: 351–352 - PubMed
    1. Bret L, Chaibi EB, Chanal-Claris C, Sirot D, Labia R, Sirot J (1997) Inhibitor-resistant TEM (IRT) beta-lactamases with different substitutions at position 244. AntimicrobAgents Chemother 41: 2547–2549 - PMC - PubMed
    1. Brook I (1984) The role of β-lactamase-producing bacteria in the persistence of streptococcal tonsillar infection. Clin Infect Dis 6: 601–607 - PubMed

Publication types

MeSH terms