

Enabling enhanced emission and low-threshold lasing of organic molecules using special Fano resonances of macroscopic photonic crystals
- PMID: 23918363
- PMCID: PMC3752230
- DOI: 10.1073/pnas.1311866110
Enabling enhanced emission and low-threshold lasing of organic molecules using special Fano resonances of macroscopic photonic crystals
Abstract
The nature of light interaction with matter can be dramatically altered in optical cavities, often inducing nonclassical behavior. In solid-state systems, excitons need to be spatially incorporated within nanostructured cavities to achieve such behavior. Although fascinating phenomena have been observed with inorganic nanostructures, the incorporation of organic molecules into the typically inorganic cavity is more challenging. Here, we present a unique optofluidic platform comprising organic molecules in solution suspended on a photonic crystal surface, which supports macroscopic Fano resonances and allows strong and tunable interactions with the molecules anywhere along the surface. We develop a theoretical framework of this system and present a rigorous comparison with experimental measurements, showing dramatic spectral and angular enhancement of emission. We then demonstrate that these enhancement mechanisms enable lasing of only a 100-nm thin layer of diluted solution of organic molecules with substantially reduced threshold intensity, which has important implications for organic light-emitting devices and molecular sensing.
Keywords: enhanced light–matter interaction; fluorescence enhancement.
Conflict of interest statement
The authors declare no conflict of interest.
Figures
 to X and
  to M were measured.
 ), extraction
  , and total
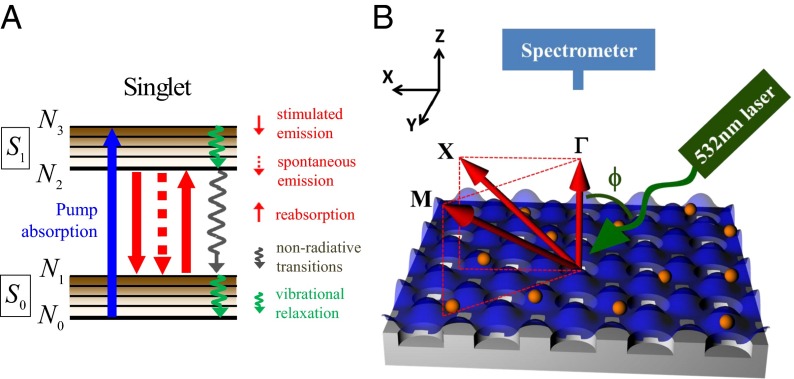
  enhancement factors, which are compared with the theoretical predictions, as described in the main text. (Inset) FDTD calculation results of the band structure from which the incident angle (ϕ) for on-resonance coupling is determined
  , showing good agreement with experiments
  . a.u., arbitrary unit.
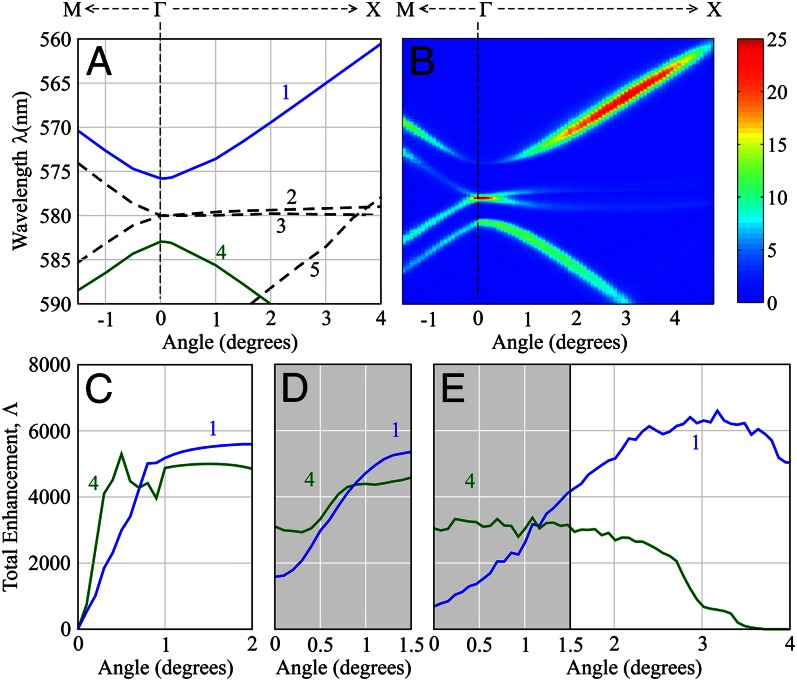
 -to-M and
  -to-X directions. (B) Angle-resolved fluorescence measurements of R6G solution suspended on top of the PhC. The correspondence between the color and number of photons (arbitrary units) is given in the color bar on the side. (C) Total enhancement factors,
  , for mode 1 (blue line) and mode 4 (green line) calculated through the product of excitation enhancement,
  , and extraction enhancement,
  , using the theoretical model. (D) Theoretical prediction of the averaged total enhancement factor,
  , between 0° and
  , to be compared with experiments. (E) Total enhancement factor,
  , extracted from experimental results in B. A comparison between D and E for the same angle range (0–
 ) shows good agreement not only in trend but also in values.
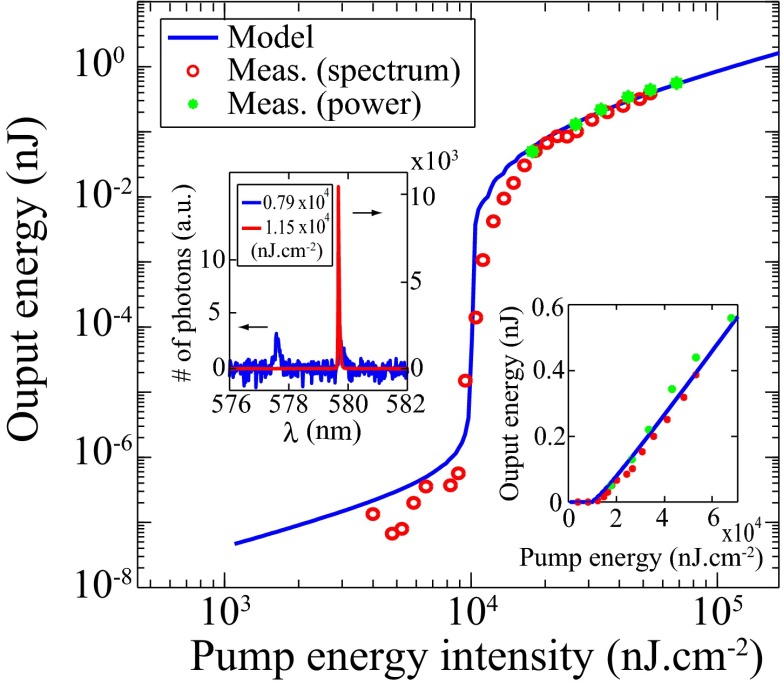
 (corresponding to an intensity of
  ).
).References
-
- Donzella V, Crea F. Optical biosensors to analyze novel biomarkers in oncology. J Biophotonics. 2011;4(6):442–452. - PubMed
-
- Hoa XD, Kirk AG, Tabrizian M. Towards integrated and sensitive surface plasmon resonance biosensors: A review of recent progress. Biosens Bioelectron. 2007;23(2):151–160. - PubMed
-
- Hunt HK, Armani AM. Label-free biological and chemical sensors. Nanoscale. 2010;2(9):1544–1559. - PubMed
-
- Cooper MA. Optical biosensors in drug discovery. Nat Rev Drug Discov. 2002;1(7):515–528. - PubMed
-
- Lakowicz JR. Principles of Fluorescence Spectroscopy. New York: Springer; 1999.
Publication types
MeSH terms
Substances
LinkOut - more resources
Full Text Sources
Other Literature Sources
