. 2013 Sep 10;110(37):E3506-15.
doi: 10.1073/pnas.1303558110. Epub 2013 Aug 5.

ETV4 promotes metastasis in response to activation of PI3-kinase and Ras signaling in a mouse model of advanced prostate cancer

Affiliations

ETV4 promotes metastasis in response to activation of PI3-kinase and Ras signaling in a mouse model of advanced prostate cancer

Alvaro Aytes et al. Proc Natl Acad Sci U S A. .

Abstract

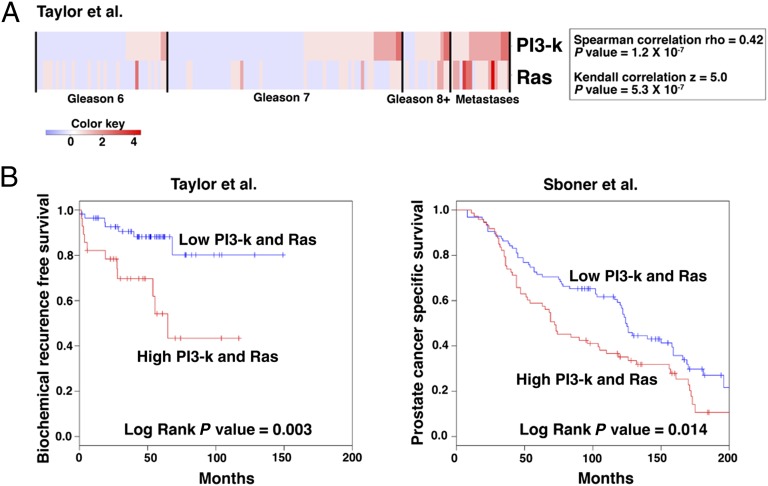
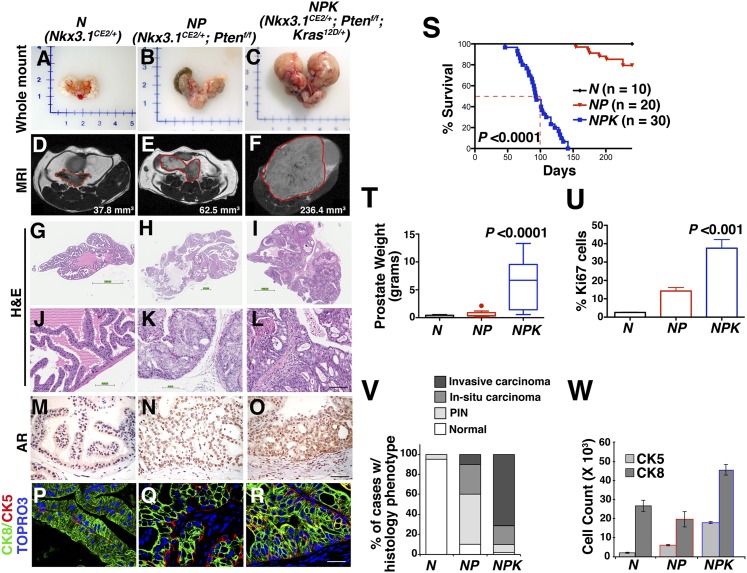
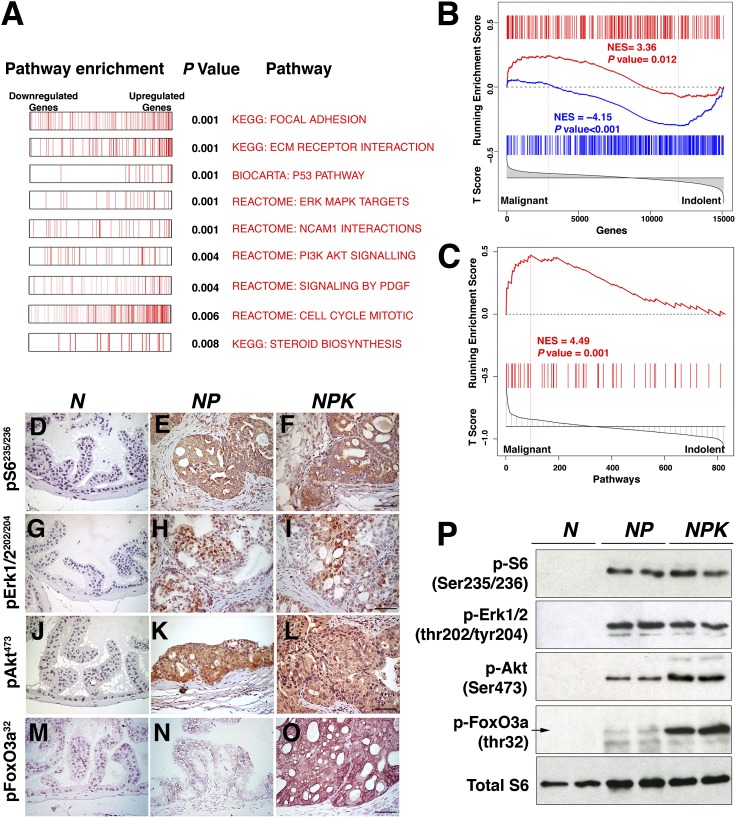
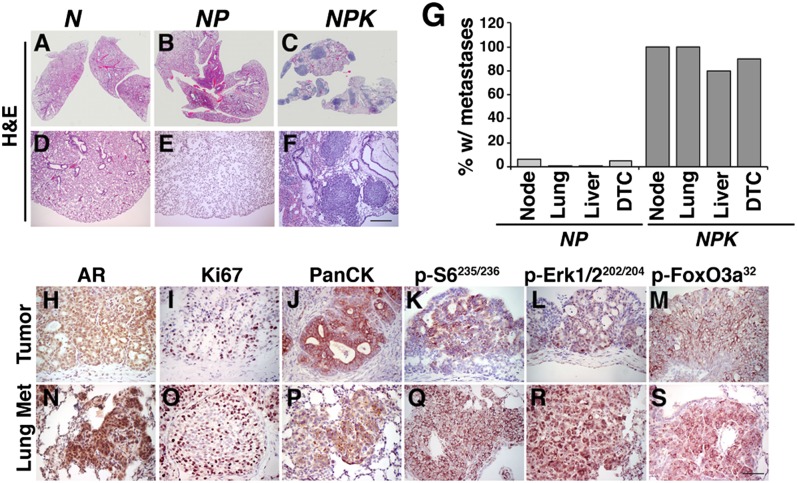
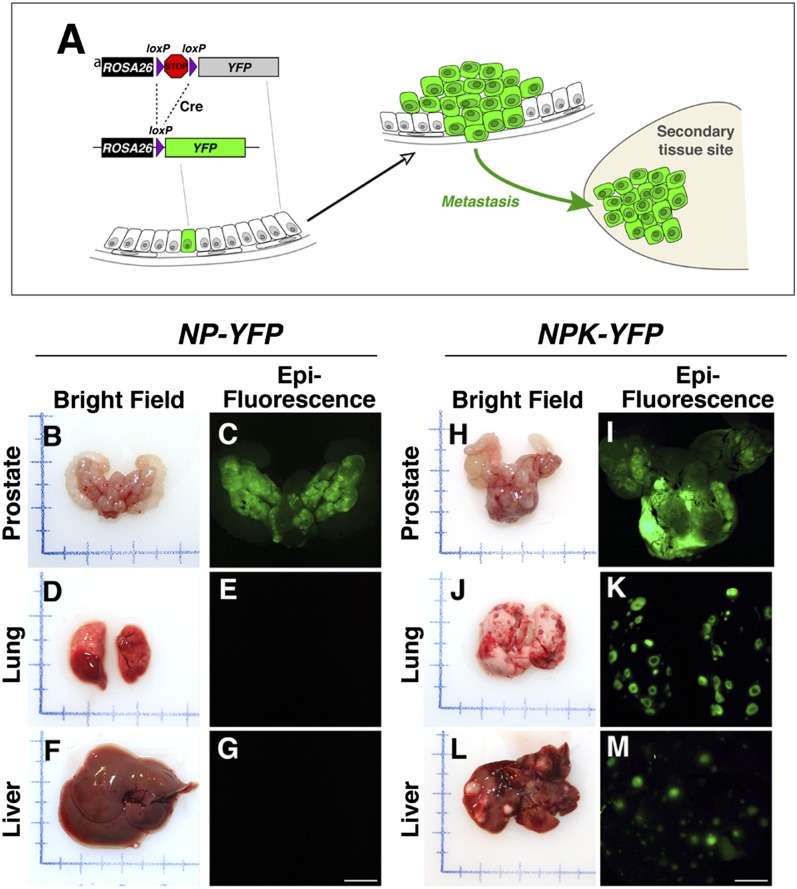
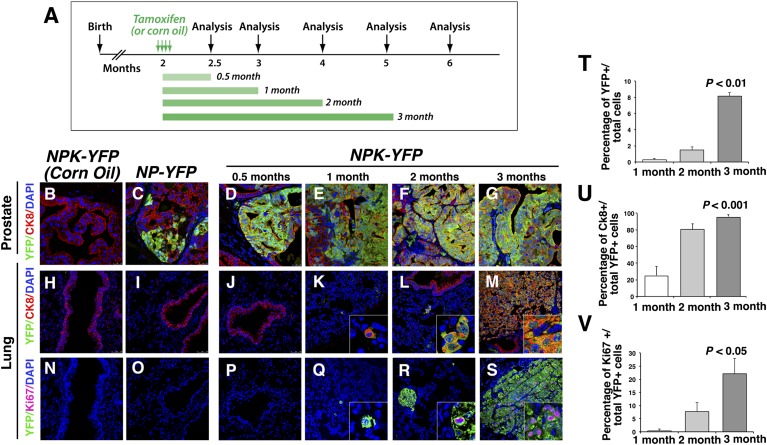
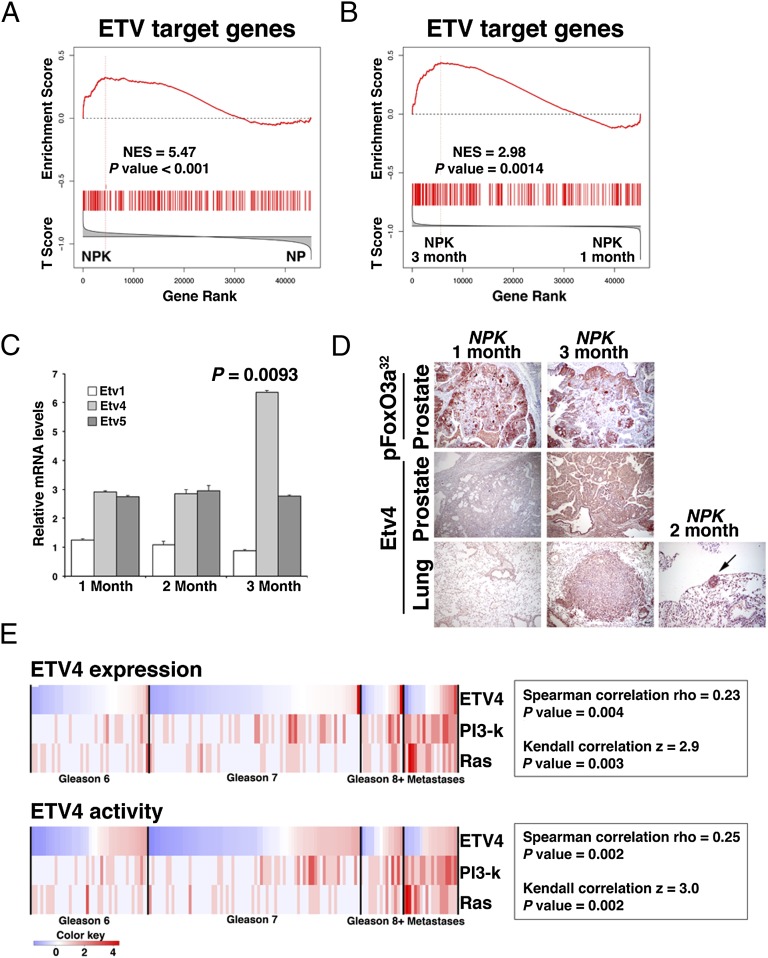
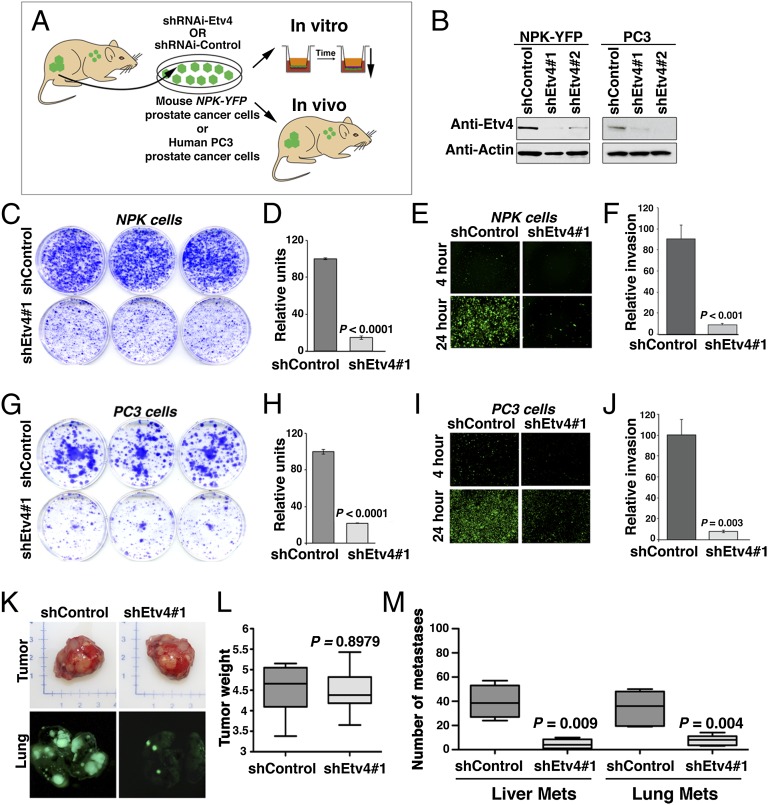
Combinatorial activation of PI3-kinase and RAS signaling occurs frequently in advanced prostate cancer and is associated with adverse patient outcome. We now report that the oncogenic Ets variant 4 (Etv4) promotes prostate cancer metastasis in response to coactivation of PI3-kinase and Ras signaling pathways in a genetically engineered mouse model of highly penetrant, metastatic prostate cancer. Using an inducible Cre driver to simultaneously inactivate Pten while activating oncogenic Kras and a fluorescent reporter allele in the prostate epithelium, we performed lineage tracing in vivo to define the temporal and spatial occurrence of prostate tumors, disseminated tumor cells, and metastases. These analyses revealed that though disseminated tumors cells arise early following the initial occurrence of prostate tumors, there is a significant temporal lag in metastasis, which is temporally coincident with the up-regulation of Etv4 expression in primary tumors. Functional studies showed that knockdown of Etv4 in a metastatic cell line derived from the mouse model abrogates the metastatic phenotype but does not affect tumor growth. Notably, expression and activation of ETV4, but not other oncogenic ETS genes, is correlated with activation of both PI3-kinase and Ras signaling in human prostate tumors and metastases. Our findings indicate that ETV4 promotes metastasis in prostate tumors that have activation of PI3-kinase and Ras signaling, and therefore, ETV4 represents a potential target of therapeutic intervention for metastatic prostate cancer.


Conflict of interest statement

The authors declare no conflict of interest.

Figures

Fig. 1.
Fig. 1.
Coactivation of PI3-kinase and Ras signaling pathways is associated with adverse patient outcome. (A) Correlation of PI3-kinase and Ras signaling in human prostate cancer from the Taylor et al. (6) dataset. Shown is a heat map in which each clinical sample (i.e., primary tumors of the indicated Gleason scores and metastases) was evaluated to determine status for PI3-kinase and Ras signaling (Materials and Methods). Correlation coefficients and P values of the correlations are shown for both Spearman rho and Kendall z calculations. The color key indicates relative expression levels of the pathway. (B) Kaplan–Meier analyses showing the association of activation of both PI3-kinase and Ras signaling with adverse patient outcome in two independent cohorts using biochemical recurrence-free (BCR-free; Left) and prostate cancer-specific survival (Right) as clinical endpoints.
Fig. 2.
Fig. 2.
Cooperation of PI3-kinase and Ras signaling pathways in advanced prostate cancer in a genetically engineered mouse model. Mice of the indicated genotypes were induced with tamoxifen at 2 mo and analyzed at 8 (for N), 9 (for NP), or 4 (for NPK) mo after induction. (A–C) Whole-mount images. (D–F) MRI images with the regions corresponding to prostate indicated by the red lines and with tumor volumes indicated. (G–L) Representative H&E images of anterior prostate showing whole-slide (G–I) or high-power (J–L) images. (M–O) Immunohistochemical staining for AR. (P–R) Immunofluorescence images show staining for cytokeratin 8 (CK8), which stains luminal epithelium, and cytokeratin 5 (CK5), which stains basal cells. (S) Survival curve showing the percent of mice of the indicated genotypes remaining alive relative to days after tumor induction with tamoxifen; for the NPK mice, 50% survival is indicated by the dashed red line. (T) Average wet weights of anterior prostate (N) or prostate tumors (NP and NPK). (U) Average proliferation assessed by the number of Ki67-positive cells relative to the total number of epithelial cells. (V) Summary of the histopathological phenotype. (W) Quantification of CK8 and CK5 immunofluorescence staining. P values compare NPK mice to the control (N, normal prostate). (Scale bars, 100 μm.) Additional supporting data are provided in SI Appendix, Fig. S1 and Table S1.
Fig. 3.
Fig. 3.
Signaling pathway activation in NPK mouse prostate tumors. (A) Pathway enrichment analyses. Summary of GSEA analyses comparing NPK and NP mouse prostate tumors. Shown is a summary of biological pathways indicating the down-regulated and up-regulated genes, with P value of enrichment indicated. (B) Cross-species GSEA analyses showing the enrichment of an expression signature from the NPK vs. NP mouse prostate tumors compared with a reference signature of malignant vs. indolent human prostate cancer. (C) GSEA analyses of biological pathways comparing pathways that are differentially activated in the NPK vs. NP mouse prostate tumors with pathways enriched in a reference signature of malignant vs. indolent human prostate cancer. (D–O) Immunohistochemical staining of mouse prostate tissues using the indicated phosphoantibodies. (Scale bars, 100 μm.) (P) Western blot analyses using total protein extracts prepared from dorsal prostate or prostate tumors from the indicated mouse genotypes. Additional supporting data are provided in SI Appendix, Figs. S2 and S3 and Datasets S1S3.
Fig. 4.
Fig. 4.
Analyses of metastasis in NPK mice. (A–F) Representative H&E images of the lungs from the indicated mouse genotypes showing whole-slide (A–C) or high-power (D–F) images. (G) Summary of the incidence of metastases and DTCs in mice of the indicated genotypes. Metastases were scored by H&E analyses and immunostaining for AR and pan-cytokeratin; DTCs were quantified from bone marrow using real-time PCR (Materials and Methods). (H–S) Immunostaining for the indicated proteins/phosphoproteins comparing primary prostate tumors and lung metastases from the same NPK mice. Data show representative images from multiple (n = 5) comparisons of tumors and metastases from the corresponding mice. (Scale bars, 100 μm.) Additional supporting data are provided in SI Appendix, Figs. S3 and S4 and Table S1.
Fig. 5.
Fig. 5.
Lineage-tracing analysis of metastases in vivo. (A) Strategy for lineage tracing of metastases with YFP. The R26R allele contains a YFP reporter under the control of the ubiquitously expressed ROSA26 promoter, but is not expressed due to the presence of the transcriptional STOP sequence. Expression of Cre recombinase (shown here in a single cell) results in excision of the STOP sequence and expression of YFP. Cells descended from the original cell undergoing Cre-mediated recombination will be genetically marked by expression of YFP. If these cells metastasize to a distant site, they can be identified unambiguously by their lineage mark. (B–M) Corresponding bright-field and epifluorescence images showing prostate, lungs, and liver from mice of the indicated genotypes having a YFP (fluorescent) allele that is conditionally expressed in prostate following tamoxifen induction. Note that both NP-YFP and the NPK-YFP mice have robust fluorescence in the prostate, whereas only the NPK-YFP mice display metastatic lesions evident in the bright-field images of lungs and liver that display robust fluorescence. Additional supporting data are provided in SI Appendix, Fig. S4.
Fig. 6.
Fig. 6.
Lineage-tracing analysis of the spatial and temporal occurrence of metastases. (A) Experimental strategy. NPK-YFP (or NP-YFP) mice were induced with tamoxifen (or treated with corn oil as control) for four consecutive days and then analyzed from 2 wk (0.5 mo) to up to 4 mo following induction. (B–S) Representative confocal images of prostate or lungs from NKP-YFP mice (or the control NPK-YFP treated with corn oil, or NP-YFP mice), which were analyzed at the indicated time points following tamoxifen induction. Images show immunofluorescence staining for YFP-expressing cells (green), costained with CK8 (red) or Ki67 (magenta); all cells were visualized with DAPI (blue). (Insets) High-power images. (TV) Quantification of YFP-expressing cells from lungs of NPK-YFP mice at the indicated time points following tamoxifen induction. (T) The percentage of YFP-expressing cells relative to the total cells counted (i.e., DAPI-stained cells). (U) The percentage of YFP-expressing cells that costained with CK8. (V) The percentage of YFP-expressing cells that costained with Ki67. Quantification of cell-counting data are provided in SI (Fig. Appendix, Table S2; additional supporting data are provided in SI Appendix, Figs. S3 and S4.
Fig. 7.
Fig. 7.
Activation of Etv4 by PI3-kinase and Ras signaling in metastatic prostate cancer. (A and B) GSEA analyses showing enrichment of human ETV target genes in reference signatures comparing NPK and NP mouse prostate tumors (A) or 3-mo vs. 1-mo NPK mouse prostate tumors (B). The mouse genes were mapped to their human orthologs for comparison with a reference signature of human ETV target genes. (C) Real-time quantitative PCR analyses of NPK prostate tumors at 1, 2, or 3 mo following tamoxifen induction showing the relative mRNA expression levels for Etv1, Etv4, and Etv5. P value compares the relative levels of Etv4 at 1 mo vs. 3 mo; other comparisons were not significant. (D) Immunostaining of NPK prostate tumors or lungs at 1, 2, or 3 mo following tamoxifen induction. Note that the tumor marker pFoxO3a32 (Fig. 2) is robustly expressed in the prostate tumors at both time points, whereas Etv4 is only expressed in the 3-mo prostate as well as in the lung metastases from this time point as well as the micrometastases at 2 mo. (Scale bars, 100 μm.) (E) Correlation of human ETV4 expression and activation of target genes with activation of both PI3-kinase and Ras signaling in human prostate cancer from the Taylor et al. (6) dataset. Shown is a heat map in which the status of ETV4 expression/activity as well as PI3-kinase and Ras signaling activation was evaluated in each of the clinical sample (i.e., primary tumors of the indicated Gleason scores and metastases; Materials and Methods). Correlation coefficients, and the P values of the correlations, are shown for both Spearman rho and Kendall z calculations. The color key indicates relative expression and activity levels of the ETV4 as well as PI3K and Ras pathways. Additional supporting data are provided in SI Appendix, Figs. S5 and S6 and Datasets S4 and S5.
Fig. 8.
Fig. 8.
Etv4 promotes prostate cancer metastasis. (A) Experimental strategy. Cells lines were derived from NPK-YFP prostate tumors. The CASP-NPK-YFP(1) cells can be visualized by fluorescence by virtue of the expression of YFP, and retain the ability to metastasize when implanted into immunodeficient mice. Cells were infected with lentivirus vector expressing two alternative Etv4 shRNA or a control shRNA (scrambled sequence). The consequences of Etv4 knockdown in the experimental vs. control cells were evaluated in vitro, in colony formation, in matrigel invasion assays, as well as in vivo, to quantify the consequences for tumor growth and metastasis. (B) Western blot assay showing knockdown of the Etv4 protein with the corresponding shRNA (shEtv4#1 or shEtv4#1) compared with the control (shControl). All assays were done at least three times using both Etv4 shRNA with similar results; the representative data shown were done using shEtv4#1. (C–J) In vitro analyses in CASP-NPK-YFP(1) (C–F) and PC3 (G–J) cells. (C and G) Colony formation assay in cells expressing shControl or shEtv4#1 lentivirus showing representative plates stained with crystal violet. (D and H) Quantification of colony formation assay data. (E and I) Matrigel invasion assay in cells expressing shControl or shEtv4#1 lentivirus showing the increased invasion of fluorescent cells expressing the control shRNA but not the Etv4 shRNA. (F and J) Quantification of invasion assay data. (K–M) In vivo analyses in CASP-NPK-YFP(1) cell. (K) Images of tumors (Upper) and visualization of lung metastases by fluorescence (Lower) from immunodeficient mice implanted with CASP-NPK-YFP(1) cells expressing the shControl or shEtv4#1 lentivirus. (L) Summary of tumor weights (n = 10 mice per group). (M) Summary of the total number of metastases per mouse analyzed (n = 10 mice per group) for liver and lung as indicated. In each case, the P values compare the results in cells expressing the shEtv4#1 lentivirus with those expressing the shControl.

Comment in

References

    1. Valastyan S, Weinberg RA. Tumor metastasis: Molecular insights and evolving paradigms. Cell. 2011;147(2):275–292. - PMC - PubMed
    1. Nguyen DX, Bos PD, Massagué J. Metastasis: From dissemination to organ-specific colonization. Nat Rev Cancer. 2009;9(4):274–284. - PubMed
    1. Joyce JA, Pollard JW. Microenvironmental regulation of metastasis. Nat Rev Cancer. 2009;9(4):239–252. - PMC - PubMed
    1. Kang Y, Pantel K. Tumor cell dissemination: Emerging biological insights from animal models and cancer patients. Cancer Cell. 2013;23(5):573–581. - PMC - PubMed
    1. American Cancer Society (2012) Cancer Facts and Figures 2012. Available at www.cancer.org/acs/groups/content/@epidemiologysurveilance/documents/acs.... Accessed September 25, 2012.

Publication types

MeSH terms

Associated data