

State-dependent climate sensitivity in past warm climates and its implications for future climate projections
- PMID: 23918397
- PMCID: PMC3761583
- DOI: 10.1073/pnas.1303365110
State-dependent climate sensitivity in past warm climates and its implications for future climate projections
Abstract
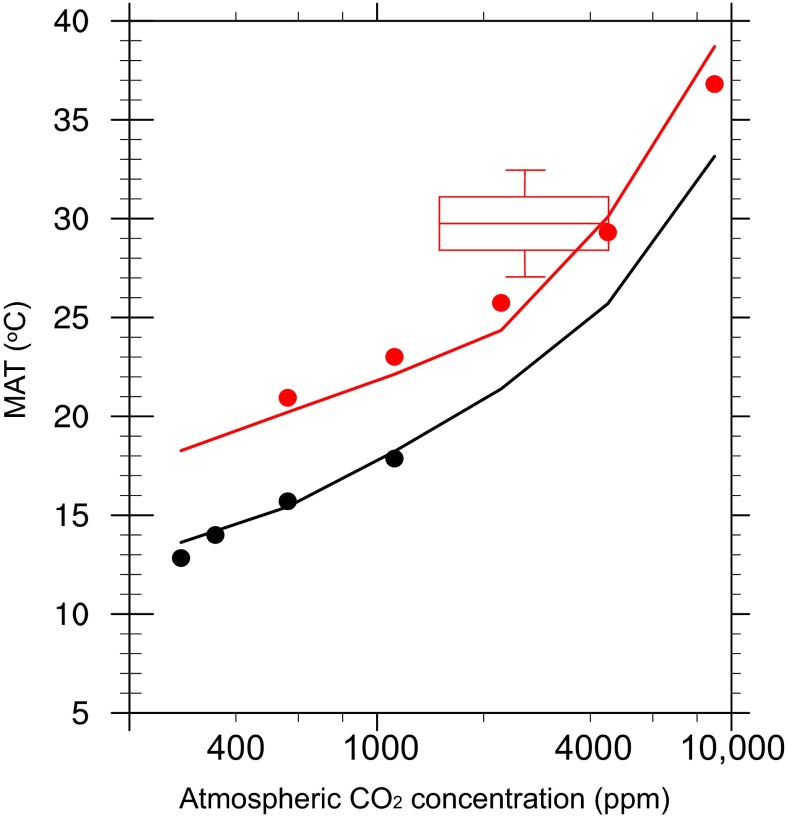
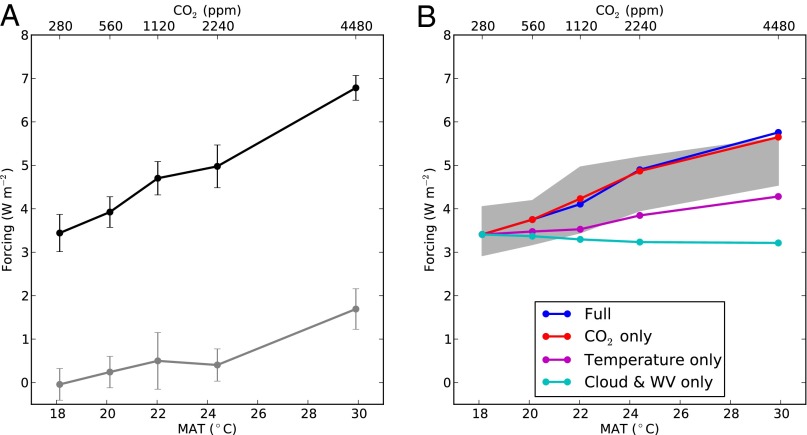
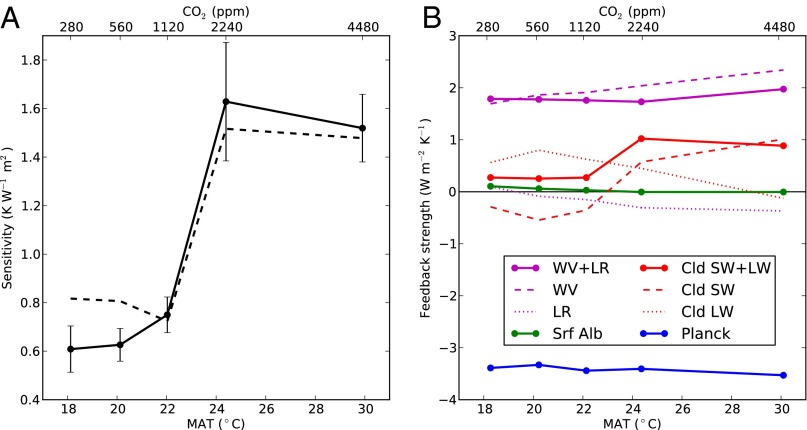
Projections of future climate depend critically on refined estimates of climate sensitivity. Recent progress in temperature proxies dramatically increases the magnitude of warming reconstructed from early Paleogene greenhouse climates and demands a close examination of the forcing and feedback mechanisms that maintained this warmth and the broad dynamic range that these paleoclimate records attest to. Here, we show that several complementary resolutions to these questions are possible in the context of model simulations using modern and early Paleogene configurations. We find that (i) changes in boundary conditions representative of slow "Earth system" feedbacks play an important role in maintaining elevated early Paleogene temperatures, (ii) radiative forcing by carbon dioxide deviates significantly from pure logarithmic behavior at concentrations relevant for simulation of the early Paleogene, and (iii) fast or "Charney" climate sensitivity in this model increases sharply as the climate warms. Thus, increased forcing and increased slow and fast sensitivity can all play a substantial role in maintaining early Paleogene warmth. This poses an equifinality problem: The same climate can be maintained by a different mix of these ingredients; however, at present, the mix cannot be constrained directly from climate proxy data. The implications of strongly state-dependent fast sensitivity reach far beyond the early Paleogene. The study of past warm climates may not narrow uncertainty in future climate projections in coming centuries because fast climate sensitivity may itself be state-dependent, but proxies and models are both consistent with significant increases in fast sensitivity with increasing temperature.
Keywords: hyperthermal; superrotation.
Conflict of interest statement
The authors declare no conflict of interest.
Figures
Comment in
-
Hot climates, high sensitivity.Proc Natl Acad Sci U S A. 2013 Aug 27;110(35):14118-9. doi: 10.1073/pnas.1313417110. Epub 2013 Aug 14. Proc Natl Acad Sci U S A. 2013. PMID: 23946429 Free PMC article. No abstract available.
References
-
- Archer D, et al. Atmospheric lifetime of fossil fuel carbon dioxide. Annu Rev Earth Planet Sci. 2009;37:117–134.
-
- Pagani M, Caldeira K, Archer D, Zachos JC. Atmosphere. An ancient carbon mystery. Science. 2006;314(5805):1556–1557. - PubMed
-
- PALAEOSENS Project Members Making sense of palaeoclimate sensitivity. Nature. 2012;491(7426):683–691. - PubMed
-
- Haywood AM, et al. Are there pre-Quaternary geological analogues for a future greenhouse warming? Philos Trans A Math Phys Eng Sci. 2011;369(1938):933–956. - PubMed
-
- Huber M. A sensitivity to history. Nat Geosci. 2013;6:15–16.
LinkOut - more resources
Full Text Sources
Other Literature Sources
Miscellaneous
