. 2013 Oct;33(19):3907-19.
doi: 10.1128/MCB.00627-13. Epub 2013 Aug 5.

Autophagy negatively regulates early axon growth in cortical neurons

Affiliations

Autophagy negatively regulates early axon growth in cortical neurons

Byung-Kwan Ban et al. Mol Cell Biol. 2013 Oct.

Abstract

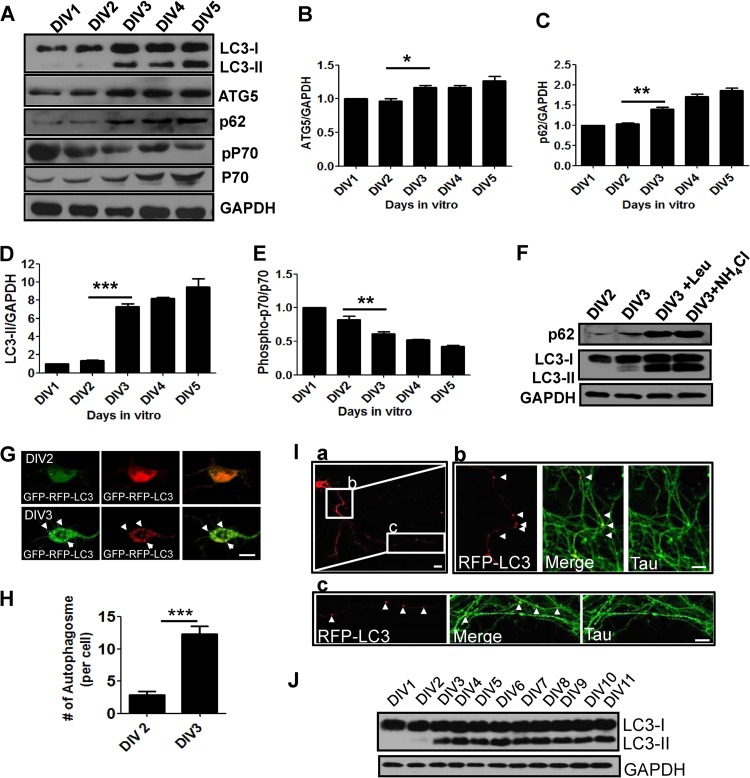
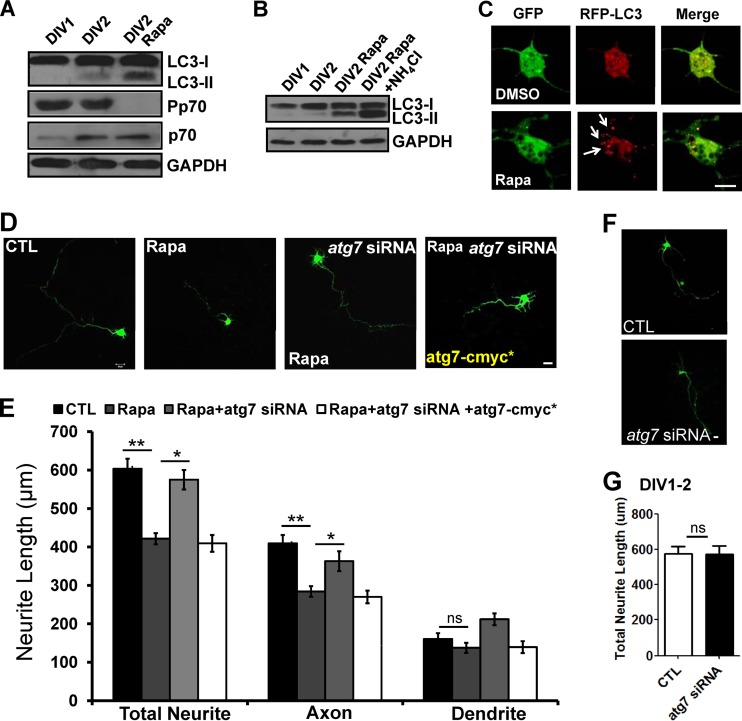
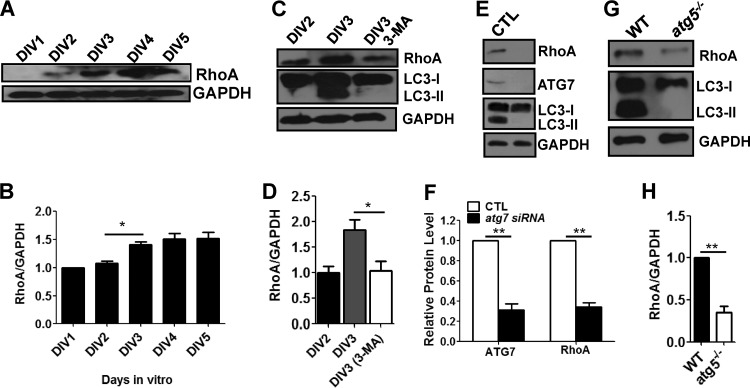
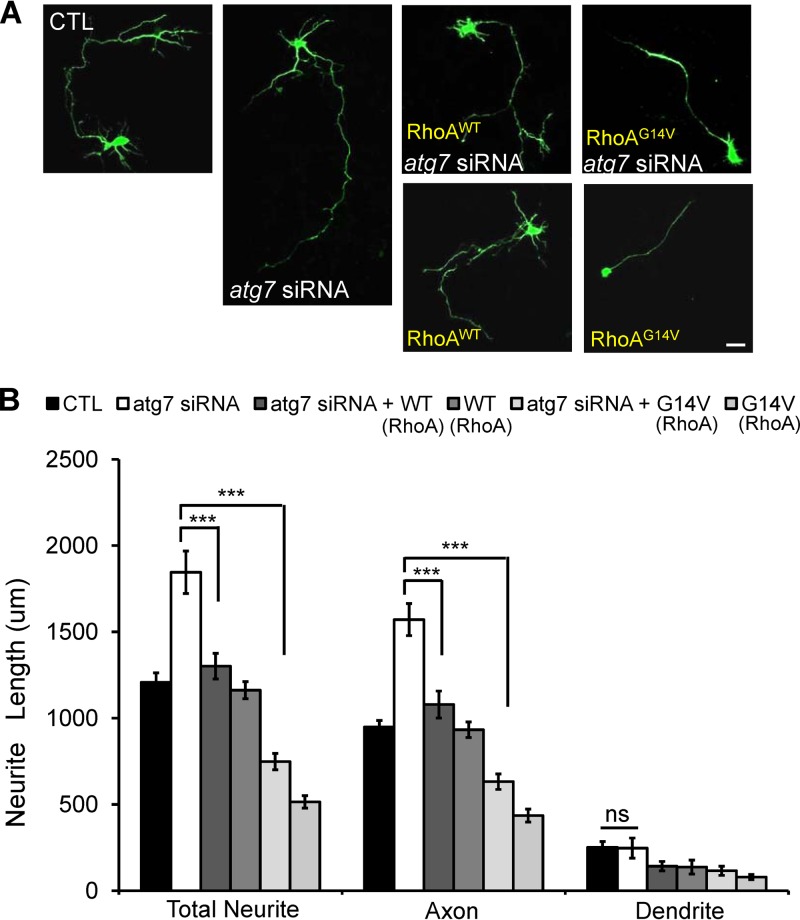
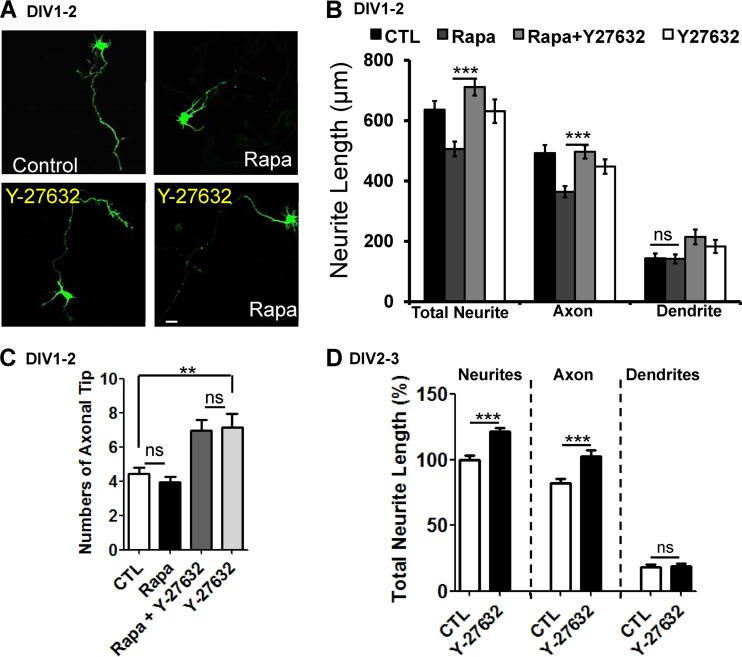
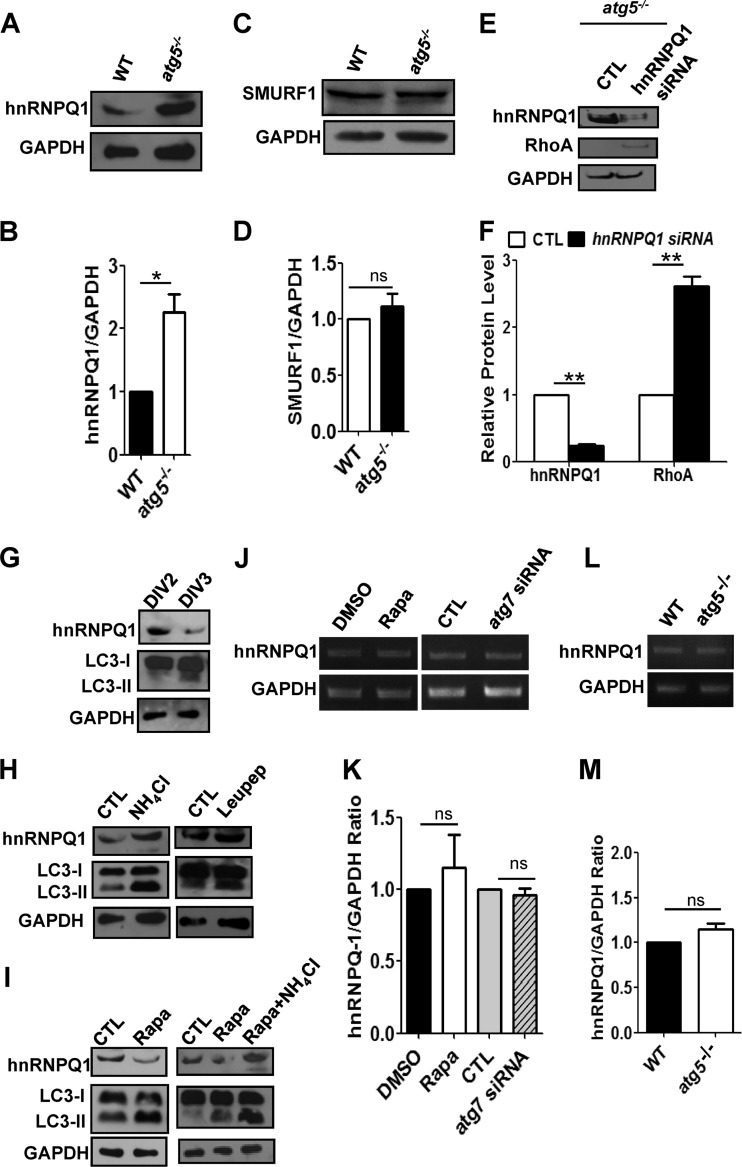
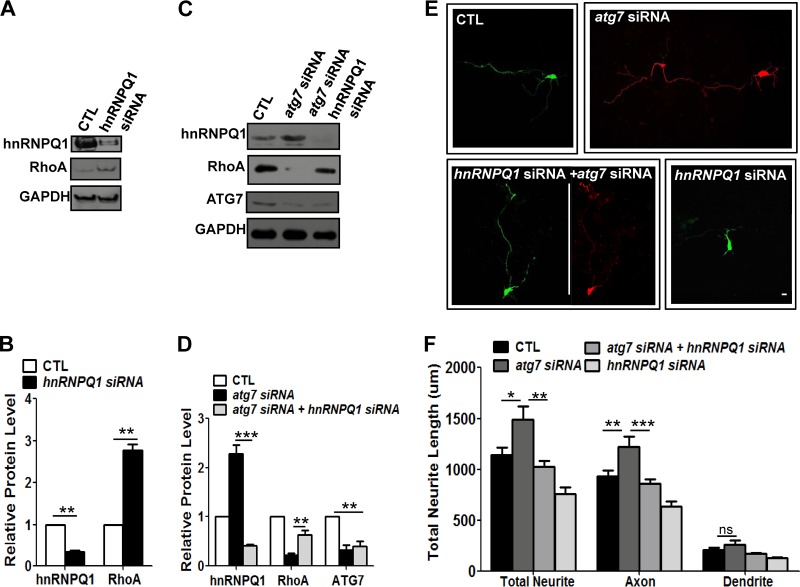
Neurite growth requires neurite extension and retraction, which are associated with protein degradation. Autophagy is a conserved bulk degradation pathway that regulates several cellular processes. However, little is known about autophagic regulation during early neurite growth. In this study, we investigated whether autophagy was involved in early neurite growth and how it regulated neurite growth in primary cortical neurons. Components of autophagy were expressed and autophagy was activated during early neurite growth. Interestingly, inhibition of autophagy by atg7 small interfering RNA (siRNA) caused elongation of axons, while activation of autophagy by rapamycin suppressed axon growth. Surprisingly, inhibition of autophagy reduced the protein level of RhoA. Moreover, expression of RhoA suppressed axon overelongation mediated by autophagy inhibition, whereas inhibition of the RhoA signaling pathway by Y-27632 recovered rapamycin-mediated suppression of axon growth. Interestingly, hnRNP-Q1, which negatively regulates RhoA, accumulated in autophagy-deficient neurons, while its protein level was reduced by autophagy activation. Overall, our study suggests that autophagy negatively regulates axon extension via the RhoA-ROCK pathway by regulating hnRNP-Q1 in primary cortical neurons. Therefore, autophagy might serve as a fine-tuning mechanism to regulate early axon extension.


Figures

Fig 1
Fig 1
Autophagy-related genes are expressed and autophagy is activated during early neurite growth in cultured cortical neurons. (A to E) Western blot (A) and quantification plots of bands (B to E) of cultured cortical neurons from DIV1 to DIV5 showing increased ATG5, LC3-II, and p62 and decreased phospho-p70 (pP70) S6 kinase/p70 S6 kinase ratios (indicative of mTOR inhibition), indicating autophagy induction. GAPDH was used as a loading control and a normalizing band for quantification. The phosphorylated p70 S6 kinase band was normalized to that of p70 S6 kinase. The values are the means and standard errors of the mean (SEM) of three independent replicates. One-way ANOVA and Tukey's multiple-comparison test; *, P < 0.05; **, P < 0.01; ***, P < 0.001. (F) Western blot of cultured cortical neurons at DIV2 and DIV3 and in the presence of ammonium chloride (NH4Cl) or leupeptin (Leup) at DIV3 revealing increased LC3 and p62 levels. (G to I) Representative images (G) and quantification (H) of RFP-GFP-positive autophagosomes of cultured cortical neurons at DIV2 and DIV3 expressing GFP-RFP-LC3 or RFP-LC3 showing accumulation of autophagosomes (puncta) in cell bodies (G) and axons (I, a) at DIV3. The values are the means and SEM of three independent replicates. Student's t test: ***, P < 0.001. RFP-LC3-positive autophagosomes were localized to the proximal (I, b) and distal (I, c) regions of axons labeled with Tau. The arrowheads indicate LC3-positive autophagosomes. Scale bars, 20 μm (G and I, a) and 5 μm (I, b and c). (J) Western blot analysis of LC3 using cultured developing cortical neurons (from DIV1 to DIV11).
Fig 2
Fig 2
Autophagy inhibition by atg7 siRNA leads to axon elongation during early neurite growth. (A to C) Western blot (A), quantification of the Western blot (LC3-II and ATG7) (B), and representative images of GFP-LC3-positive autophagosomes (indicated by arrows) (C) of cultured cortical neurons at DIV2 and DIV3 transfected with atg7 siRNA showing a decrease in ATG7 and LC3-II levels (A and B) and autophagosomes in cell bodies (C) compared to controls (CTL) transfected with scrambled siRNA, indicating inhibition of autophagy. Neurons rescued by cotransfection of siRNA-resistant human atg7–c-myc (atg7–c-myc*) and atg7 siRNA (Rescue) showed no noticeable decrease in ATG7, LC3-II, or autophagosomes, demonstrating the specificity of siRNA treatment. GAPDH was used as a loading control. (D) Composite images of neurite morphology were generated from 2 or 3 separate images obtained from the same neuron to track the total neurite length. (D and E) Representative images of neurite growth (D) and a quantification plot of neurite length (E) of cultured cortical neurons at DIV1 to DIV3 transfected with atg7 siRNA showing a significant increase in total neurites and axons but not in dendrite length, whereas atg7–c-myc* (inset labeled with c-myc antibody) showed no significant change in total neurite, axon, and dendrite length. Each siRNA was cotransfected with GFP to determine the neurite morphology. CTL, control neurons transfected with scrambled siRNA. The values are shown as means ± SEM of three independent experiments. One-way ANOVA and Tukey's multiple-comparison test; *, P < 0.05; **, P < 0.01; ns, not significant. Scale bar, 20 μm. (F) Scrambled siRNA (CTL) or atg7 siRNA was transfected into cultured cortical neurons to examine axon morphology at DIV1 to DIV3 in developing neurons, and the number of axon tips was determined. The values are shown as means and SEM. Student's t test; ns, not significant. (G) Scrambled siRNA (CTL) or atg7 siRNA was transfected into cultured cortical neurons at DIV1. Cell viability was measured by counting surviving neurons at 24 h and 48 h after transfection. The values are shown as means and SEM. Student's t test; ns, not significant. (H and I) Cultured neurons were transfected with GFP to visualize cell morphology at DIV2. Cells were treated with 3-MA (10 mM) at DIV2 for 12 h. Shown are representative images of neurite growth (H) and a quantification plot of neurite length (I) of cultured cortical neurons at DIV2 and DIV3. (H) Composite images of neurite morphology were generated from 2 separate images obtained from the same neuron to track the total neurite length of atg7 siRNA-transfected neurons. The values are shown as means and SEM. Student's t test; ***, P < 0.001. Scale bar, 20 μm.
Fig 3
Fig 3
Autophagy activation by rapamycin causes suppression of axon growth during early neurite growth. (A to E) Western blots (A and B) in the absence (A) or presence (B) of ammonium chloride (10 mM), representative images of RFP-LC3-positive autophagosomes (indicated by arrows) (C), neurite length (D), and quantification plot of neurite length (E) of cultured cortical neurons at DIV1 and DIV2 treated with 10 nM rapamycin (Rapa) at DIV1 showing increased LC3 (more robust for LC3-II) and a decreased phospho-p70 S6 kinase/p70 S6 kinase ratio (A), accumulation of autophagosomes (C), and significant reduction in total neurite and axon but not dendrite length (D and E) at DIV2 compared to vehicle-treated control (DMSO), indicating that rapamycin induced autophagy. GAPDH was used as a loading control. Transfection with atg7 siRNA followed by rapamycin treatment led to significant improvement of total neurite and axon length, whereas atg7–c-myc* showed no improvement in total neurite and axon length. Each siRNA was cotransfected with GFP to determine the neurite morphology. CTL, control neurons were transfected with scrambled siRNA. The values are shown as means ± SEM of three independent experiments. One-way ANOVA and Tukey's multiple-comparison test; *, P < 0.05; **, P < 0.01; ns, not significant. Scale bar, 20 μm. (F and G) Scrambled siRNA (CTL) or atg7 siRNA was transfected into cultured cortical neurons at DIV1. The total neurite length was quantified 24 h after transfection. Shown are representative images of neurite growth (F) and a quantification plot of the neurite length (G) of cultured cortical neurons at DIV1 and DIV2. The values are shown as means and SEM. Student's t test; ns, not significant. Scale bar, 20 μm.
Fig 4
Fig 4
RhoA is downregulated by autophagy inhibition and upregulated during early neurite growth. (A and B) Western blot (A) and quantification plots of bands (B) of cultured cortical neurons from DIV1 to DIV5 showing increased RhoA levels. GAPDH was used as a loading control and a normalizing band for quantification. The values are means and SEM of three independent replicates. One-way ANOVA and Tukey's multiple-comparison test; *, P < 0.05. (C and D) Western blot (C) and quantification plots of bands (D) of cultured cortical neurons at DIV2 and DIV3 treated with 10 mM 3-MA showing a significant decrease in RhoA and LC3-II levels compared to DMSO (vehicle)-treated controls (CTL), indicating that inhibition of autophagy downregulates RhoA. GAPDH was used as a loading control. The values are the means and SEM of three independent replicates. One-way ANOVA and Tukey's multiple-comparison test; *, P < 0.05. (E and F) Western blot (E) and quantification plots of bands (F) of cultured cortical neurons at DIV2 and DIV3 transfected with atg7 siRNA showing significant decreases in RhoA, ATG7, and LC3-II relative to those transfected with scrambled siRNA (CTL), indicating that inhibition of autophagy downregulates RhoA. GAPDH was used as a loading control. The values are the means and SEM of normalized band intensities from three independent replicates. Student's t test; **, P < 0.01. (G and H) Western blot (G) and quantification plots of bands (H) of atg5−/− MEFs showing a significant decrease in RhoA and LC3-II levels compared to wild-type MEFs (WT), indicating that inhibition of autophagy downregulates RhoA. GAPDH was used as a loading control. The values are the means and SEM of three independent replicates. Student's t test; **, P < 0.01.
Fig 5
Fig 5
RhoAWT or RhoAG14V rescues abnormal axon extension caused by autophagy inhibition. (A and B) Representative images of neurite growth (A) and quantification plot of neurite length (B) of cultured cortical neurons at DIV1 to DIV3 transfected with atg7 siRNA showing significant increases in total neurite and axon length but not in dendrite length compared to transfection with scrambled siRNA. Shown is cotransfection of atg7 siRNA with wild-type (Flag-RhoAWT [WT]) or constitutively active (Flag-RhoAG14V [G14V]) RhoA. RhoA significantly recovered the axon overextension phenotype, indicating that ectopic expression of RhoA recovers the deficient autophagy-mediated reduction of RhoA. Transfection with Flag-RhoAWT alone did not show a neurite phenotype; however, transfection with constitutively active RhoAG14V alone showed a remarkable reduction in neurite length compared to the control. Each siRNA was cotransfected with GFP to determine the neurite morphology. CTL, control neurons transfected with scrambled siRNA. The values are shown as the means ± SEM of three independent replicates. One-way ANOVA and Tukey's multiple-comparison test; ***, P < 0.001; ns, not significant. Scale bar, 20 μm.
Fig 6
Fig 6
Inhibition of ROCK by Y-27632 recovers the suppression of axon growth induced by rapamycin. (A and B) Representative images of neurite growth (A) and quantification plot of neurite length (B) of cultured cortical neurons at DIV2 treated with 10 nM rapamycin showing a significant decrease in total neurite and axon length but not in dendrite length compared to vehicle (DMSO) treatment. Cotreatment with 10 nM rapamycin and 50 μM Y-27632, an inhibitor of ROCK, significantly rescued the rapamycin phenotype, indicating that inhibition of the ROCK pathway mitigates the reduction in axon length due to rapamycin-mediated activation of autophagy. Treatment with Y-27632 alone did not show any dramatic changes in the neurite phenotype. Each siRNA was cotransfected with GFP to determine the neurite morphology. CTL, control neurons treated with DMSO. The values are shown as means ± SEM of three independent replicates. One-way ANOVA and Tukey's multiple-comparison test; ***, P < 0.001; ns, not significant. Scale bar, 20 μm. (C) Cortical neurons were treated with either rapamycin (10 mM) or Y-27632 (50 μm) or both at DIV1 for 14 to 16 h. The number of axon tips was determined in neurons treated with rapamycin at DIV2. The values are shown as means and SEM. One-way ANOVA and Tukey's multiple-comparison test; **, P < 0.01; ns, not significant. (D) Cortical neurons transfected with GFP were treated with 50 μM Y-27632 at DIV2 and DIV3. The total neurite length was quantified, and the axon length was found to have increased significantly. The values are means and SEM of three independent replicates. One-way ANOVA and Tukey's multiple-comparison test; ***, P < 0.001.
Fig 7
Fig 7
The protein level of hnRNP-Q1, but not its mRNA level, is regulated by autophagy during early neurite growth. (A and B) Western blot (A) and quantification plots of bands (B) of atg5−/− MEFs showing an increase in hnRNP-Q1 levels, indicating that autophagy negatively regulates hnRNP-Q1. GAPDH was used as a loading control and a normalizing band for quantification. The values are means and SEM of three independent replicates. Student's t test; *, P < 0.05. (C) Western blot analysis of SMURF1 using wild-type or atg5−/− MEFs. GAPDH was used as a loading control. (D) Levels of SMURF1 in wild-type and atg5−/− MEFs. The values are the means and SEM of three independent replicates. ns, not significant. (E and F) Western blot (E) and quantification plots of bands (F) of atg5−/− MEFs transfected with hnRNP-Q1 siRNA showing a significant decrease in hnRNP-Q1 levels (F) and a significant increase in RhoA levels (F) relative to control scrambled siRNA, indicating that hnRNP-Q1 negatively regulates RhoA. GAPDH was used as a loading control. The values are the means and SEM of three independent replicates. Student's t test; **, P < 0.01. (G) Western blot of cultured cortical neurons at DIV2 and DIV3 showing a remarkable decrease in hnRNP-Q1 and increase in LC3-II at DIV3 compared to DIV2, indicating that activation of autophagy coincides with a reduction in hnRNP-Q1 during early neurite development. GAPDH was used as a loading control. (H) Western blot of cultured cortical neurons at DIV2 and DIV3 treated with ammonium chloride (NH4Cl) and leupeptin (Leupep) to block lysosomal degradation showing increased hnRNP-Q1 and LC3-II levels relative to the vehicle control (CTL). (I) Western blot of cultured cortical neurons at DIV2 and DIV3 treated with rapamycin (Rapa) showing a decrease in hnRNP-Q1 and an increase in LC3-II in the presence or absence of NH4Cl. GAPDH was used as a loading control. (J and K) Representative gel images of semiquantitative RT-PCR (J) and densitometric quantification of band intensities (K) illustrating the relative levels of hnRNP-Q1 mRNA in cultured neurons either treated with 10 nM rapamycin or DMSO (CTL) or transfected with atg7 siRNA or scrambled siRNA (CTL). There was no significant difference in the mRNA levels of hnRNP-Q1 between CTL (DMSO or scrambled siRNA) and neurons regulated by autophagy. The relative gene expression of hnRNP-Q1 mRNA was normalized to that of GAPDH. The values are the means and SEM of three independent replicates. Student's t test; ns, not significant. (L and M) Representative gel images of semiquantitative RT-PCR (L) and densitometric quantification of band intensities (M) illustrating the relative levels of hnRNP-Q1 mRNA in wild-type and atg5−/− MEFs. There was no significant difference in the mRNA levels of hnRNP-Q1 between wild-type and atg5−/− MEFs. The relative gene expression of hnRNP-Q1 mRNA was normalized to that of GAPDH. The values are the means and SEM of three independent replicates. Student's t test; ns, not significant.
Fig 8
Fig 8
hnRNP-Q1 regulated by autophagy negatively regulates RhoA and affects early axon growth in cultured neurons. (A and B) Western blot (A) and quantification plots of bands (B) of cultured cortical neurons at DIV1 to DIV3 transfected with hnRNP-Q1 siRNA showed a significant decrease in hnRNP-Q1 levels (B) and a significant increase in RhoA levels (B) compared to the control (scrambled siRNA), indicating that hnRNP-Q1 negatively regulates RhoA in cortical neurons. GAPDH was used as a loading control and a normalizing band for quantification. The values are the means and SEM of three independent replicates. Student's t test; **, P < 0.01. (C and D) Western blot (C) and quantification plots of bands (D) of cultured cortical neurons at DIV2 and DIV3 with cotransfection of atg7 and hnRNP-Q1 siRNA showing recovery of the autophagy deficiency-mediated reduction in RhoA levels. GAPDH was used as a loading control. The values are the means and SEM of three independent replicates. One-way ANOVA and Tukey's multiple-comparison test; **, P < 0.01; ***, P < 0.001. (E and F) Composite images of neurite morphology (E) were generated from 2 or 3 separate images obtained from the same neuron to track the total neurite length of atg7 siRNA-transfected neurons. Representative images of neurite growth (E) and a quantification plot of the neurite length (F) of cultured cortical neurons at DIV1 to DIV3 transfected with atg7 siRNA, hnRNP-Q1 siRNA, or both show that cotransfection of atg7 siRNA (in pSICOR-RFP) with hnRNP-Q1 siRNA (in pSUPER-GFP) significantly recued the axon overextension phenotype, indicating that reduction of hnRNP-Q1 recovers the level of RhoA and suppresses abnormal axon elongation. Transfection with hnRNP-Q1 siRNA alone showed a slight reduction in neurite length compared to the control. Transfection with hnRNP-Q1 or atg7 siRNA and neurite morphology was determined by expression of GFP or RFP, respectively, or both. CTL, control neurons transfected with scrambled siRNA. The values are shown as the means and SEM of three independent replicates. One-way ANOVA and Tukey's multiple-comparison test; *, P < 0.05; **, P < 0.01; ***, P < 0.001; ns, not significant. Scale bar, 20 μm.

References

    1. Low LK, Cheng HJ. 2006. Axon pruning: an essential step underlying the developmental plasticity of neuronal connections. Philos. Trans. R. Soc. Lond. B Biol. Sci. 361:1531–1544 - PMC - PubMed
    1. Luo L, O'Leary DD. 2005. Axon retraction and degeneration in development and disease. Annu. Rev. Neurosci. 28:127–156 - PubMed
    1. Saxena S, Caroni P. 2007. Mechanisms of axon degeneration: from development to disease. Prog. Neurobiol. 83:174–191 - PubMed
    1. Murakami F, Song WJ, Katsumaru H. 1992. Plasticity of neuronal connections in developing brains of mammals. Neurosci. Res. 15:235–253 - PubMed
    1. Eberwine J. 2001. Molecular biology of axons: “a turning point…”. Neuron 32:959–960 - PubMed

Publication types

MeSH terms