

Review
doi: 10.1083/jcb.201304193.
Cryo-electron tomography: the challenge of doing structural biology in situ
Affiliations
- PMID: 23918936
- PMCID: PMC3734081
- DOI: 10.1083/jcb.201304193
Item in Clipboard
Review
Cryo-electron tomography: the challenge of doing structural biology in situ
J Cell Biol.
.
Abstract
Electron microscopy played a key role in establishing cell biology as a discipline, by producing fundamental insights into cellular organization and ultrastructure. Many seminal discoveries were made possible by the development of new sample preparation methods and imaging modalities. Recent technical advances include sample vitrification that faithfully preserves molecular structures, three-dimensional imaging by electron tomography, and improved image-processing methods. These new techniques have enabled the extraction of high fidelity structural information and are beginning to reveal the macromolecular organization of unperturbed cellular environments.
Figures
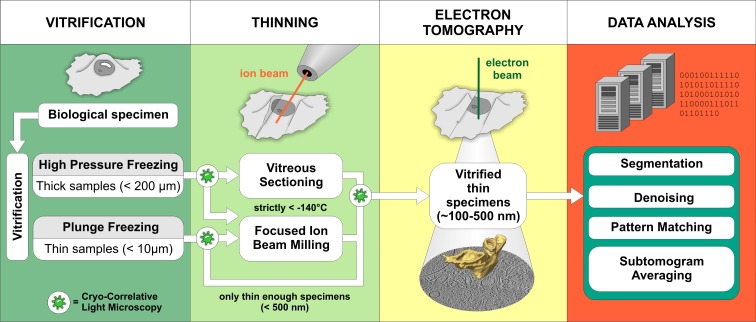
Schematic representation of the cryo-ET workflow. Vitrification. The sample type usually dictates the vitrification method. Samples that are thin enough to be directly investigated by EM are commonly vitrified by plunge-freezing into a cryogen (such as liquid ethane at less than −160°C) where sufficiently fast cooling speeds are reached (Dubochet et al., 1988). High-pressure freezing combines rapid temperature decrease with the application of high pressure, which lowers the melting point of water. This allows vitrification of samples up to 200 µm in thickness, but cryo-protectants are often needed (Studer et al., 2008). Thinning. Due to a strong electron–matter interaction, samples thicker than 1 µm are virtually opaque to electrons and require thinning at cryo-conditions. Although vitreous sectioning is currently used more often, focused ion beam milling (FIB) is an emerging method with a great promise for the future (see Box 2). Electron tomography. 3D images of vitrified samples are produced by tomographic imaging (see Box 1 for more information). Data analysis. Computational methods are used to improve the resolution of structures visualized in tomograms and to aid in their molecular identification. Cryo-correlative light microscopy is an optional procedure that facilitates identification and navigation to target features in cryo-ET.
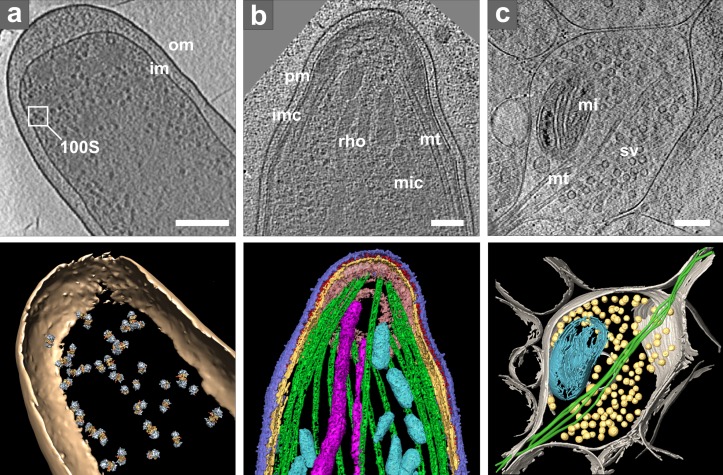
Cryo-ET of intact cells. (a) Intact E. coli. Top: tomographic slice. Bottom: isosurface representation with positions of template-matched ribosome pairs: om, outer membrane; im, inner membrane; inset shows one ribosome pair (100S). Bar, 200 nm. Modified from Ortiz et al. (2010). (b) Plasmodium organelles and the associated cytoskeleton. Top: tomographic slice. Bottom: surface rendering showing plasma membrane (pm, blue), inner membrane complex (imc, yellow), density between pm and imc (red), microtubules (mt, green), apical polar ring (pink), rhoptries (rho, violet), and micronemes (mic, cyan). Bar, 100 nm. Reproduced from Kudryashev et al. (2010b). (c) Presynaptic terminal visualized in vitrified dissociated neuronal culture at 15 days in vitro and thinned by FIB milling. Top: tomographic slice (courtesy of Y. Fukuda). Bottom: 3D visualization: plasma membrane (gray), microtubules (mt, green), mitochondrion (mi, cyan), and synaptic vesicles (sv, yellow). Bar, 200 nm.
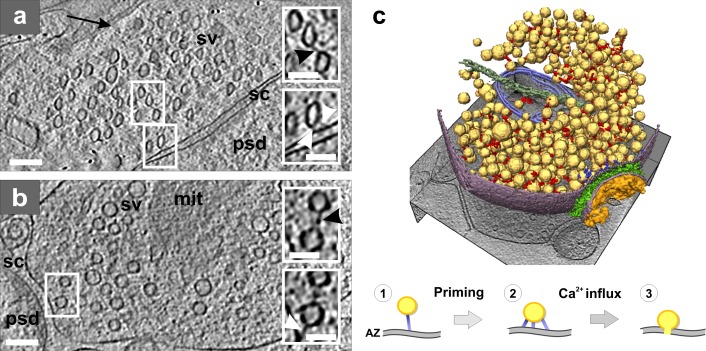
Presynaptic cytomatrix. (a) Tomographic slice of a synapse from a high-pressure frozen organotypic hippocampal slice, thinned by vitreous sectioning. Synaptic vesicles are compressed along the cutting direction (arrow). Top inset shows a connector (black arrowhead) that links two vesicles. Bottom inset shows tethers (white arrowheads) that link a vesicle to the active zone (AZ). (b) Tomographic slice of a synapse obtained from the synaptosomal cellular fraction. Top inset: connector linking two vesicles (black arrowhead). Bottom inset: tether linking a vesicle to the AZ (white arrowhead; same vesicles as in the top inset at another z-slice). (a and b) Synaptic vesicle (sv), mitochondrion (mit), synaptic cleft (sc), and postsynaptic density (psd). Bars: (main panels) 100 nm; (insets) 50 nm. (c) 3D rendering of a synaptosome; synaptic vesicles (yellow), connectors (red), tethers (blue), mitochondrion (light blue), microtubule (dark green), plasma membrane (purple), cleft complexes (green), and PSD (orange). Proposed structural model of the synaptic vesicle mobilization and release: initial tethering (1), primed vesicle (2), and release (3). Image copyright Fernández-Busnadiego et al. (2010).
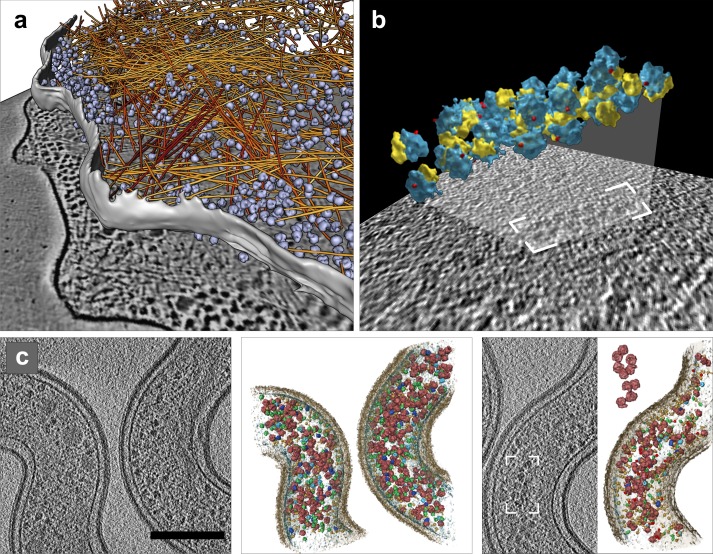
Image processing: segmentation and template matching. (a) Automated segmentation of actin filaments in Dictyostelium discoideum: actin filaments (yellow to red); ribosomes (blue). Reproduced with permission from Rigort et al. (2012b); copyright Elsevier, Inc. (b) Polyribosomes from intact human glioma cells identified by template matching. Modified with permission from Brandt et al. (2010); copyright Elsevier, Inc. (c) Protein identification using multiple template matching in intact Leptospira interrogans. Tomographic slices and 3D visualization of identified proteins of nonstimulated (left) and antibiotics-treated cells (right), ribosomes (red), GroEL (light blue), GroEL/ES (dark blue), and RNA polymerase II (green). Bar, 200 nm. Reprinted by permission from Macmillan Publishers Ltd: Nature Methods (Beck et al., 2009); copyright 2009.
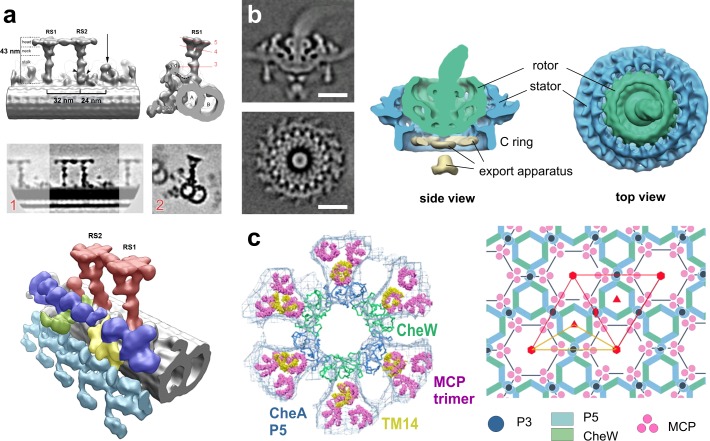
Image processing: subtomogram averaging. (a) Isolated C. reinhardtii axoneme. Top row: surface renderings of the density map obtained by averaging radial spokes (RS). Middle row: tomographic slices of the above density map. Bottom: surface renderings of the overall 3D structure: microtubule doublet (gray), outer dynein arms (turquoise), inner dynein arms (IDA, blue), the intermediate and light chains of IDAs (yellow), the dynein regulatory complex (green), and the radial spokes (red). RS1, radial spoke 1; RS2, radial spoke 2. Image copyright Pigino et al. (2011). (b) Flagellar motor of intact Borrelia. Left: tomographic slices of the averaged density map. Right: 3D isosurface views of the motor. Bars, 25 nm. Reproduced from Liu et al. (2009) with permission from the American Society for Microbiology. (c) Bacterial chemosensory receptors. Left: superposition of one ring of the crystal structure (P5 blue, CheW green) with its six receptor dimers (TM14, yellow) on the EM map (blue mesh) with its previously fit 18 receptor dimers (pink). Right: the arrangement of the receptor array produces P6 point symmetry (red; the asymmetric unit yellow). Image copyright Briegel et al. (2012).
References
Publication types
MeSH terms
Substances
LinkOut - more resources
Full Text Sources
Other Literature Sources
