. 2013 Aug 26;210(9):1839-54.
doi: 10.1084/jem.20122588. Epub 2013 Aug 5.

Origin, trafficking, and intraepithelial fate of gut-tropic T cells

Affiliations

Origin, trafficking, and intraepithelial fate of gut-tropic T cells

Delphine Guy-Grand et al. J Exp Med. .

Erratum in

  • J Exp Med. 2013 Oct 21;210(11):2493

Abstract

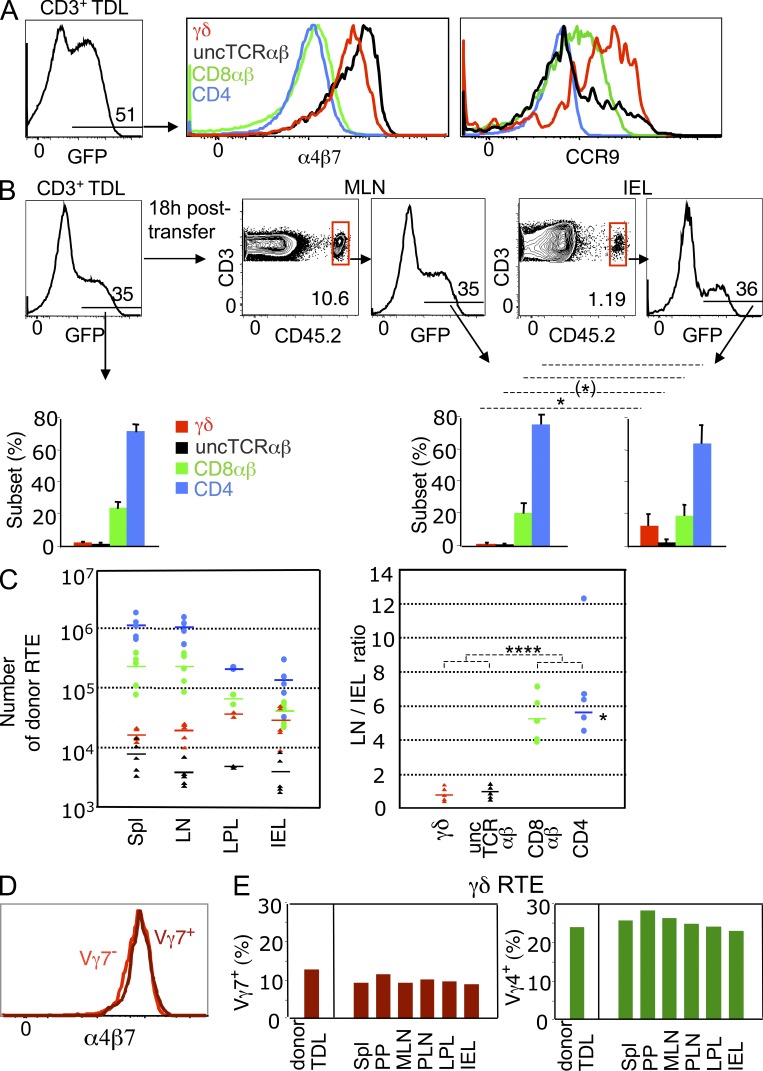
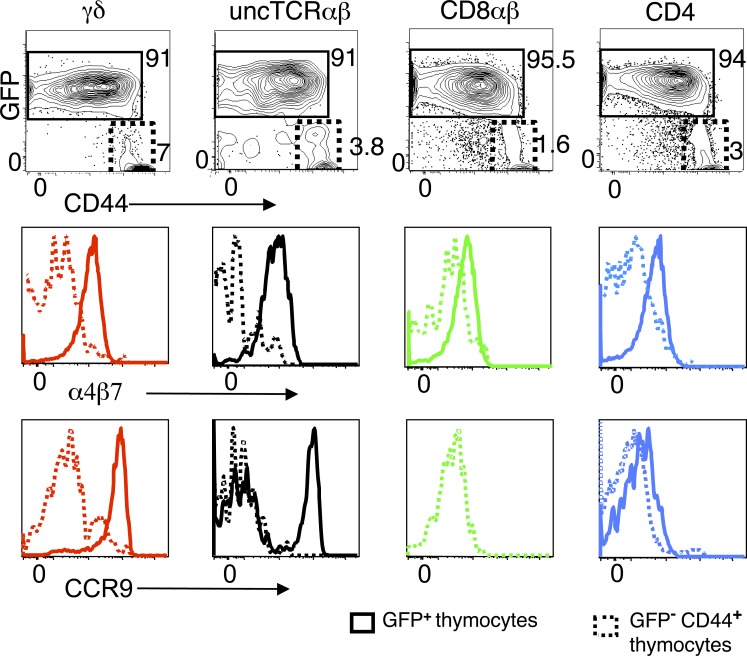
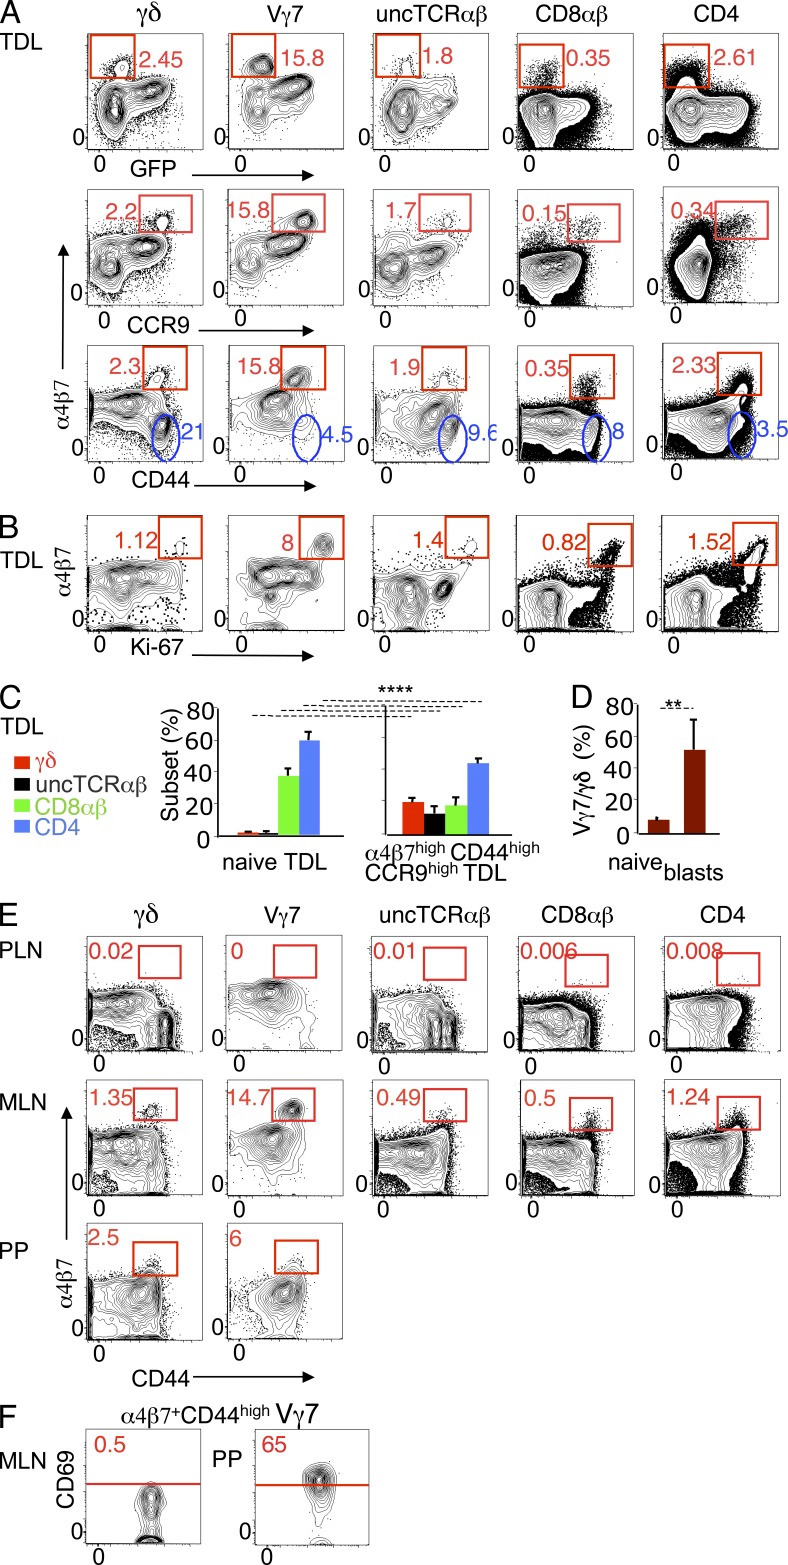
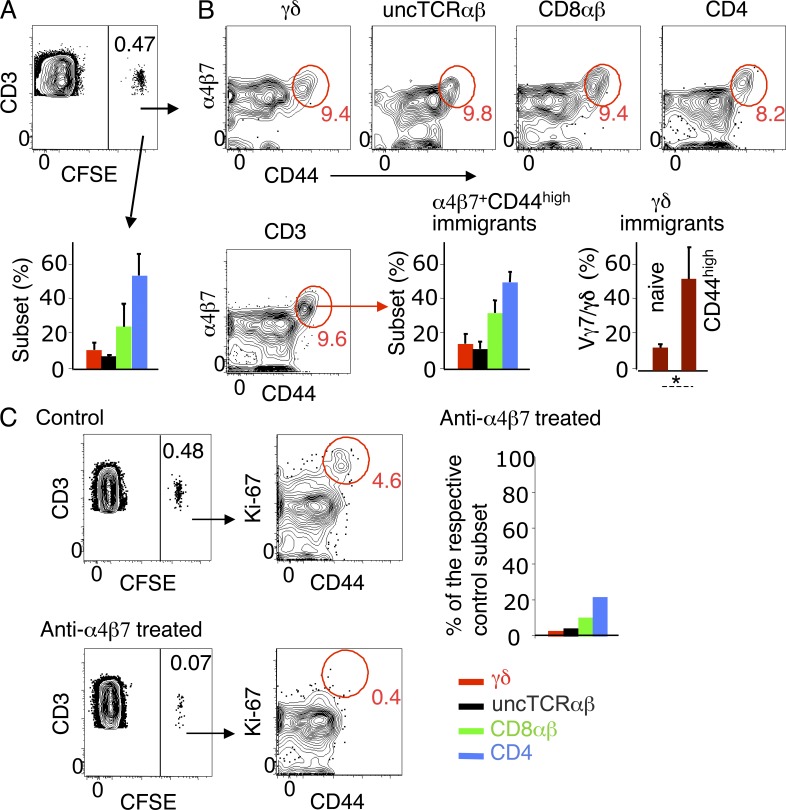
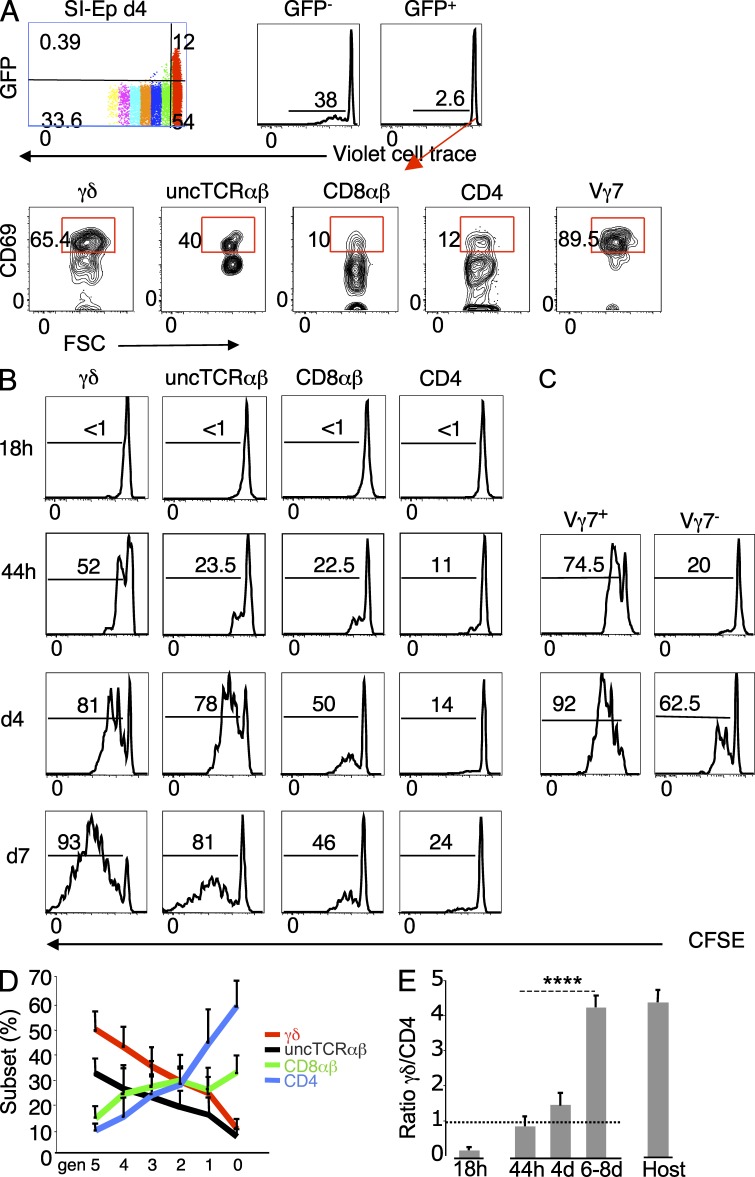
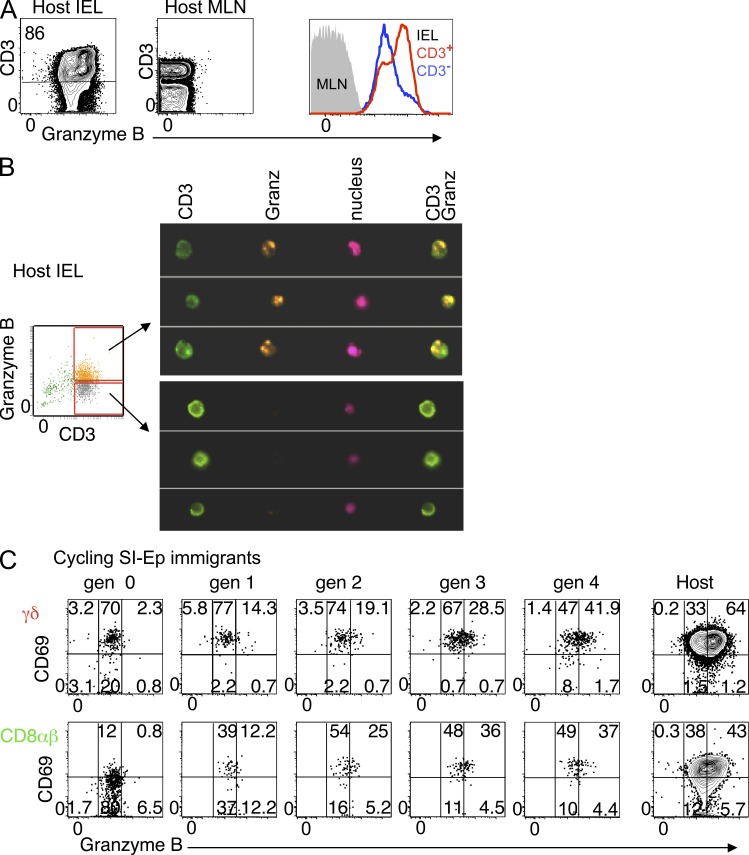
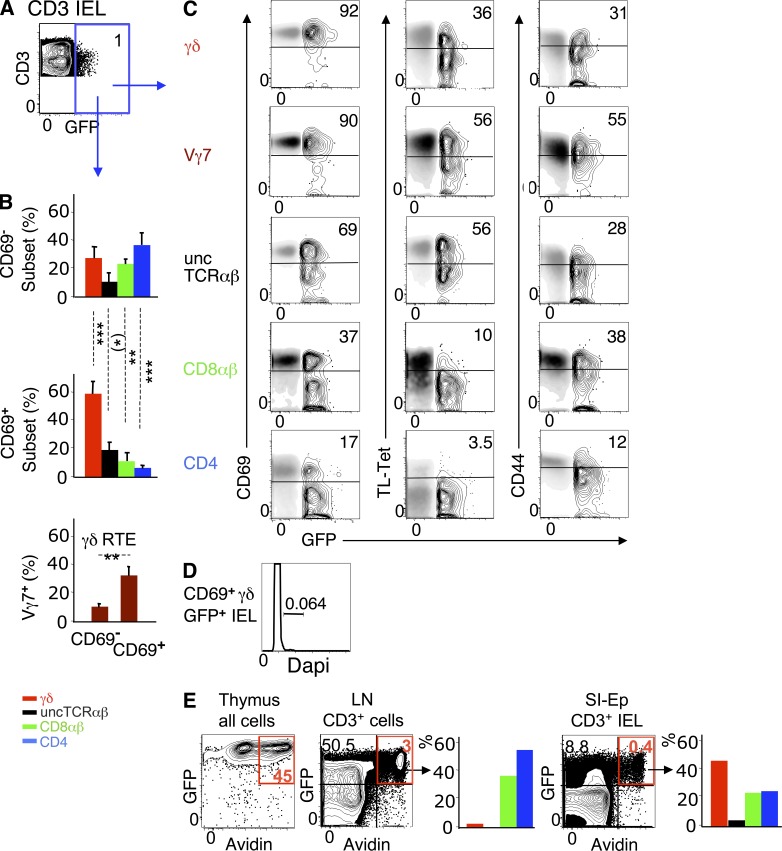
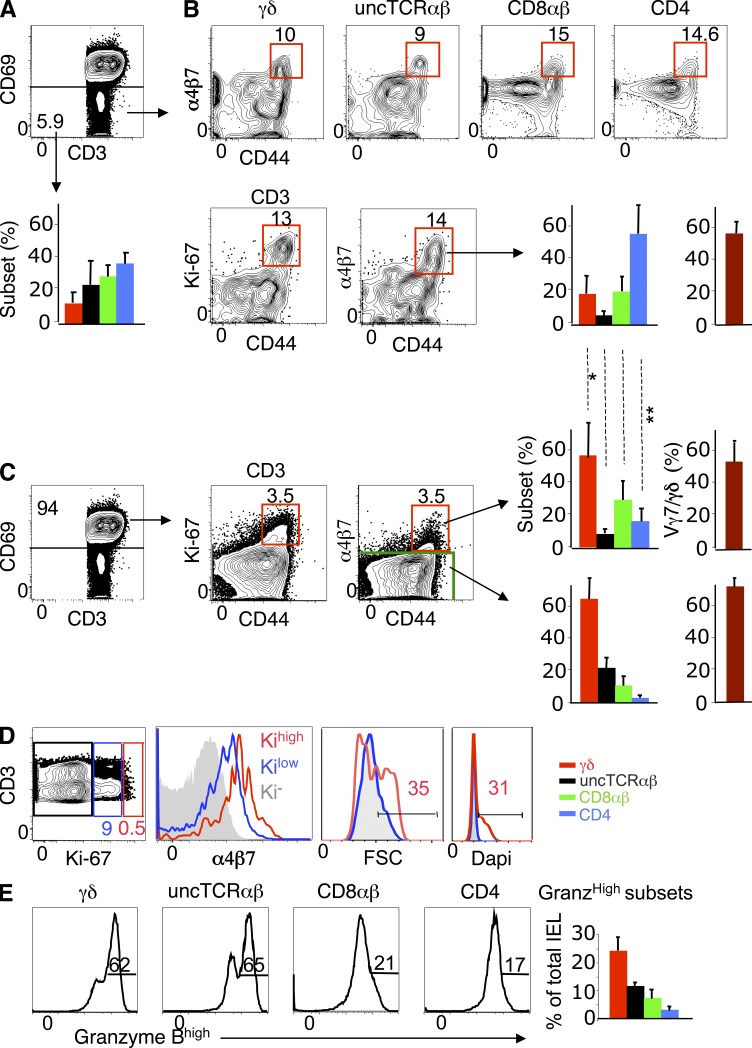
The small intestine epithelium (SI-Ep) harbors millions of unconventional (γδ and CD4(-) CD8(-) NK1.1(-) TCRαβ) and conventional (CD8αβ and CD4) T cells, designated intraepithelial lymphocytes (IELs). Here, we identified the circulating pool of SI-Ep-tropic T cells and studied their capacity to colonize the SI-Ep under steady-state conditions in SPF mice. Developmentally regulated levels of α4β7 endowed recent thymic emigrants (RTEs) of unconventional types with higher SI-Ep tropism than their conventional homologues. SI-Ep-tropic RTEs, which in all lineages emerged naive, homed to the SI-Ep, but this environment was inadequate to stimulate them to cycle. In contrast, conventional and, unexpectedly, unconventional T cells, particularly Vγ7(+) (hallmark of γδ IELs), previously stimulated to cycle in the gut-associated lymphoid tissue (GALT), proliferated in the SI-Ep. Cycling unconventional SI-Ep immigrants divided far more efficiently than their conventional homologues, thereby becoming predominant. This difference impacted on acquisition of high Granzyme B content, which required extensive proliferation. In conclusion, SI-Ep-tropic T cells follow a thymus-SI-Ep or a GALT-SI-Ep pathway, the latter generating highly competitive immigrants that are the sole precursors of cytotoxic IELs. These events occur continuously as part of the normal IEL dynamics.


Figures

Figure 1.
Figure 1.
SI-Ep tropism of RTEs. (A) RTEs from 6-wk-old RAG2p-GFP (CD45.2) B6 mice were assessed for expression of gut-tropic molecules by flow cytometry. (left) Frequency of GFP+ (RTEs) cells in CD3+ TDLs. (right) Expression of α4β7 and CCR9 in the indicated T cell subsets of GFP+ cells. α4β7 mean fluorescence intensity (MFI): 5602 (γδ), 7750 (uncTCR αβ), 1624 (CD8αβ), 1296 (CD4). CCR9 MFI: 3412 (γδ), 1865 (uncTCR αβ), 1151 (CD8αβ), 493 (CD4). Data correspond to six mice, individually studied in five independent experiments (α4β7), and to three mice, in three independent experiments (CCR9). (B) RAG2p-GFP TDLs were transferred to wild-type (CD45.1) B6 recipients and analyzed 18 h later. Dot plots show the frequency of donor CD3+ TDLs in MLN and SI-Ep. Histograms show the frequency of GFP+ cells and respective T cell subset distribution (bar graphs) in donor TDLs (eight mice individually studied in seven independent canulation experiments) and in the indicated recipient’s organs (five mice in five independent transfer experiments). *, P < 0.02; (*), P = 0.056. (C, left) Absolute number of donor RTEs in the indicated organs of the recipients described in B. Values are based on the total number of CD3+ cells per organ, calculated as described in Materials and methods. Arithmetic means are indicated. (C, right) Ratio of the number of donor cells in LN versus SI-Ep for each T cell subset. For CD4 T cells, the average ratio (see asterisk) did not take into account the outlier value. ****, P < 0.0001 (pooled unconventional versus conventional LN/IEL ratios). (D) Expression of α4β7 in Vγ7+ and Vγ7 GFP+ (RTEs) TDLs (two mice studied in two independent experiments). (E) RAG2p-GFP TDLs were transferred to wild-type (CD45.1) B6 recipients and analyzed 18 h later. The histograms show the frequency of Vγ7+ and Vγ4+ cells in GFP+ (RTEs) cells in the indicated organs. A second recipient, in another transfer experiment, gave similar results: the average frequency, as percentage of γδ RTEs, of all pooled organs was as follows: Vγ7+, 11.2 ± 2.5; Vγ4+, 23.2 ± 4.1. In detail, for IELs 13.7% (Vγ7+) and 23.9% (Vγ4+), for MLN 9.8% (Vγ7+) and 20.4% (Vγ4+), for the spleen 10.2% (Vγ7+) and 20.3% (Vγ4+).
Figure 2.
Figure 2.
Expression of α4β7 and CCR9 in newly generated mature thymocytes. Thymocytes of a RAG2p-GFP mouse were gated on CD69 TCRhigh cells. Gates delineate GFP+ CD44low/int and GFP CD44high subsets in the indicated populations. Histograms show an overlay of α4β7 or CCR9 profiles in GFP+ versus GFP subsets for each T cell lineage. α4β7 MFI of GFP+ versus GFP subsets: 1273 versus 238 (γδ), 926 versus 50 (uncTCR αβ), 616 versus 285 (CD8αβ), and 524 versus 173 (CD4). CCR9 MFI of GFP+ versus GFP subsets: 7400 versus 859 (γδ), 3732 versus 119 (uncTCR αβ), 776 versus 318 (CD8αβ), and 318 versus 252 (CD4). For comparison, the MFI of DP thymocytes were 250 for α4β7, and 2019 for CCR9. Profiles are representative of four mice individually studied in three independent experiments.
Figure 3.
Figure 3.
Conventional and unconventional cycling TDL blasts express the highest levels of gut-tropic molecules and are GALT-related. TDLs of 8–12-wk-old RAG2p-GFP mice were assessed for expression of gut-tropic molecules by flow cytometry. (A) Dot plots show α4β7 versus GFP, CCR9, or CD44 (eight mice individually studied in seven independent experiments). Red gates define cells expressing high levels of α4β7 lacking GFP or coexpressing high levels of CD44 or CCR9. α4β7 MFI in α4β7high GFP (CD44high) versus GFP+ (CD44low) TDLs: γδ, 15133/1758; Vγ7, 15139/1833; uncTCRαβ, 15321/780; CD8αβ, 7427/369; CD4, 5113/397. Blue gates indicate CD44high TDLs that lack α4β7. (B) Dot plots showing α4β7 versus Ki-67 expression (three mice in three independent experiments). (C) T cell subset distribution in naive (CD44low) and α4β7high CCR9high CD44high TDLs from the mice described in A. ****, P < 0.0001. (D) Frequency of Vγ7+ cells in naive (CD44low) and α4β7high CCR9high γδ TDLs (four mice in four independent experiments). **, P < 0.003. (E). Dot plots showing CD44 versus α4β7 expression in MLN, PLN (pool of brachial, axillary and inguinal LN) and PPs. MLN and PPs data are representative of 6 independent experiments, each with a pool of 2–3 mice. Two of these experiments included PLN, which in each case were a pool from 3 mice. (F) CD69 expression of α4β7high CD44high Vγ7+ cells in MLN and PPs, as gated in the corresponding panels in E.
Figure 4.
Figure 4.
T cell subset distribution and phenotype of TDL-derived SI-Ep immigrants. CFSE-labeled CD45.2 B6 TDLs were transferred to wild-type CD45.1 B6 recipients, which were analyzed 18 h later. (A) Frequency of donor SI-Ep immigrants (mean ± SD: 0.48 ± 0.22; 8 recipients in 8 independent canulation and transfer experiments). Bar graph shows the corresponding T cell subset distribution (mean ± SD: γδ, 10.6 ± 3.6; uncTCRαβ, 6.8 ± 0.2; CD8αβ, 23.8 ± 12; CD4, 52.6 ± 11.5. (B, top) Frequency of α4β7+ CD44high cells in each T cell subset (mean ± SD: γδ, 9.8 ± 5.2; uncTCRαβ, 7.6 ± 7.1; CD8αβ, 8.2 ± 6.8; CD4, 7.4 ± 5.7) of the mice described in A. (B, bottom) Frequency of α4β7+ CD44high CD3+ immigrants (mean ± SD: 8.7 ± 3.7). (left) Respective subset distribution (mean ± SD: γδ, 11.0 ± 5.7; uncTCRαβ, 11.1 ± 7.0; CD8αβ, 29.0 ± 12.3; CD4, 49.3 ± 11.1). (right) Frequency of Vγ7+ cells in naive (CD44low) and CD44high γδ immigrants (three recipients in three independent experiments). *, P < 0.02. (C) Dot plots show the frequency and phenotype of donor SI-Ep immigrants in anti-α4β7–treated recipients (two treated recipients in two independent canulation and transfer experiments), and respective controls. Bar graph shows the number of immigrants in treated recipients, related to the number of the respective subset in untreated controls. Similar results were obtained in three treated recipients (each studied in an independent experiment) sacrificed 44 h after transfer.
Figure 5.
Figure 5.
In the SI-Ep, RTEs do not proliferate and cycling unconventional immigrants have the highest proliferation rate. (A) TDLs of 6-wk-old RAG2p-GFP (CD45.2) B6 mice, labeled with violet cell division tracer, were transferred to wild-type CD45.1 B6 mice. Recipients were sacrificed at day 4 post-transfer. (top) Pattern of the violet tracer in donor cells in the SI-Ep and in the respective GFP and GFP+ subsets. (bottom) CD69 expression in gated GFP+ immigrants. A second recipient studied in an independent canulation and transfer experiment provided similar results. (B–E) TDLs of 8–12-wk-old (CD45.1) B6 mice labeled with CFSE were transferred to CD45.2 B6 recipients. (B) Kinetics of CFSE patterns of the indicated donor SI-Ep immigrants. The frequencies of the progenies of immigrants that divided one or more times are indicated. Plots are representative of 5–9 independent experiments per time point (total of 30 experiments). Half of the experiments studied 1 recipient and the other half a pool of 2 transferred recipients. (C) Kinetics of CFSE patterns of Vγ7+ and Vγ7 immigrants as described in B. Plots are representative of two independent transfer experiments, each corresponding to a pool of 2 recipients, per time point. (D) T cell subset distribution at each cell division generation, in the experiments described in B. Since the shift in the distribution correlated with the division generation and not with the time of sacrifice, data correspond to days 4–8 after transfer. (E) γδ/CD4 ratio in immigrants at 18 h after transfer, and in the progenies of immigrants that proliferated in situ, at the indicated time points after transfer, in the transfers described in B, compared with the corresponding ratio in host IELs (n = 46 mice). ****, P < 0.0001.
Figure 6.
Figure 6.
Cycling SI-Ep immigrants are the precursors of Granzyme Bhigh cells. (A) Flow cytometric analysis of the expression levels of Granzyme B in normal IELs and MLNs (15 mice in 15 independent experiments). (B) Structural analysis of Granzyme B content with ImageStream system (Amnis) in the indicated subsets of CD3+ IELs, as defined in the accompanying dot plot (one experiment [preliminary]). (C) Dot plots correlating CD69 expression and levels of Granzyme B in the indicated CFSE generations of donor γδ or CD8αβ SI-Ep immigrants. Data are representative of seven recipients individually analyzed at days 4–8 after transfer, in seven independent experiments.
Figure 7.
Figure 7.
RTEs in normal IELs at steady state. (A) Dot plot correlating CD3 and GFP (RTEs) in IELs of 10-wk-old RAG2p-GFP mice (five mice in five independent experiments). (B) (top and middle) T cell subset distribution in CD69 and CD69+ GFP+ IELs (same mice as in A). (bottom) Frequency of Vγ7+ cells in CD69+ and CD69 GFP+ γδ IELs (four mice in four independent experiments). (C) Gated GFP+ IELs (contour mode) were overlay with GFP IELs (density mode) for comparison of the expression levels of the indicated markers (CD8αα expression was detected by TL-tetramer labeling). Inserted numbers (%) relate to the GFP+ subset (same mice as in A). (D) Cell cycle analysis of sorted GFP+ IELs from a pool of six 25-d-old mice (one experiment, [preliminary]). At this age, GFP+ cells were 4.5% of CD3+ IELs. (E) 4-wk-old RAG2p-GFP mice received intrathymically 100 µg of biotin, and were sacrificed 40 h later. Dot plots: frequency of avidin-labeled total thymocytes, and of CD3+ lymphocytes from LN or SI-Ep (red gate). Bar graphs show T cell subset distribution in avidin+ CD3+ cells. Data correspond to two pooled animals. Similar results were obtained with another pool of two mice in an independent experiment.
Figure 8.
Figure 8.
Identification of cycling SI-Ep immigrants, and their progenies, in normal IELs at steady state. (A) Dot plot: Frequency of CD69 (mobile) cells in CD3+ IELs (mean ± SD: 6.7% ± 4), and corresponding T cell subset distribution (bar graph). Data correspond to 12 mice studied in 12 independent experiments. (B, top) Frequency of α4β7+ CD44high cells in each CD69 T cell subset (mean ± SD: γδ, 17.3 ± 12.0; uncTCRαβ, 9.8 ± 4.2; CD8αβ, 10.7 ± 4.3; CD4, 10.8 ± 2.5). (bottom) Frequency of Ki-67+ α4β7+ CD44high cells in total CD69 CD3+ IELs (10.9% ± 4.2), and corresponding T cell subset distribution (bar graph). Frequency of Vγ7+ cells in α4β7+ CD44high Vγδ IELs (right bar graph). Data correspond to 5 mice individually studied in 4 independent experiments. (C) Dot plots show frequency of Ki-67+ α4β7+ CD44high cells in CD69+ (resident) CD3+ IELs (6.9 ± 2.2%), and corresponding T cell subset distribution (bar graph). Frequency of Vγ7+ cells in α4β7+ CD44high γδ IELs (right bar graph). Data correspond to the same experiments in (B). Shown is the statistical significance of CD69 versus CD69+ α4β7+ CD44high IELs for each T cell subset: *, P < 0.05 (γδ); **, P < 0.05 (CD4). (D) Dot plot shows the frequency of Ki-67low/int and Ki-67high cells in CD69+ CD3+ IELs (10.6 ± 4.6%). Overlay histogram for α4β7, cell cycle (Dapi) and FSC of gated Ki-67low/int versus Ki-67high CD69+ IELs. Profiles correspond to six mice in six independent experiments, three of which included Dapi. (E) Frequency of Granzyme Bhigh cells in IELs subsets (mean ± SD): γδ, 51.0 ± 10 (n = 24); uncTCRαβ, 57.6 ± 7.0 (n = 6); CD8αβ, 34.5 ± 14.6 (n = 15); CD4, 31.0 ± 14.0 (n = 11). One mouse per independent experiment.

References

    1. Arstila T., Arstila T.P., Calbo S., Selz F., Malassis-Seris M., Vassalli P., Kourilsky P., Guy-Grand D. 2000. Identical T cell clones are located within the mouse gut epithelium and lamina propia and circulate in the thoracic duct lymph. J. Exp. Med. 191:823–834 10.1084/jem.191.5.823 - DOI - PMC - PubMed
    1. Bandeira A., Mota-Santos T., Itohara S., Degermann S., Heusser C., Tonegawa S., Coutinho A. 1990. Localization of γ/δ T cells to the intestinal epithelium is independent of normal microbial colonization. J. Exp. Med. 172:239–244 10.1084/jem.172.1.239 - DOI - PMC - PubMed
    1. Bankovich A.J., Shiow L.R., Cyster J.G. 2010. CD69 suppresses sphingosine 1-phosophate receptor-1 (S1P1) function through interaction with membrane helix 4. J. Biol. Chem. 285:22328–22337 10.1074/jbc.M110.123299 - DOI - PMC - PubMed
    1. Berlin C., Berg E.L., Briskin M.J., Andrew D.P., Kilshaw P.J., Holzmann B., Weissman I.L., Hamann A., Butcher E.C. 1993. α 4 β 7 integrin mediates lymphocyte binding to the mucosal vascular addressin MAdCAM-1. Cell. 74:185–195 10.1016/0092-8674(93)90305-A - DOI - PubMed
    1. Boursalian T.E., Golob J., Soper D.M., Cooper C.J., Fink P.J. 2004. Continued maturation of thymic emigrants in the periphery. Nat. Immunol. 5:418–425 10.1038/ni1049 - DOI - PubMed

Publication types

MeSH terms