. 2013 Sep 1;191(5):2372-83.
doi: 10.4049/jimmunol.1300107. Epub 2013 Aug 5.

Multistage T cell-dendritic cell interactions control optimal CD4 T cell activation through the ADAP-SKAP55-signaling module

Affiliations

Multistage T cell-dendritic cell interactions control optimal CD4 T cell activation through the ADAP-SKAP55-signaling module

Jason S Mitchell et al. J Immunol. .

Abstract

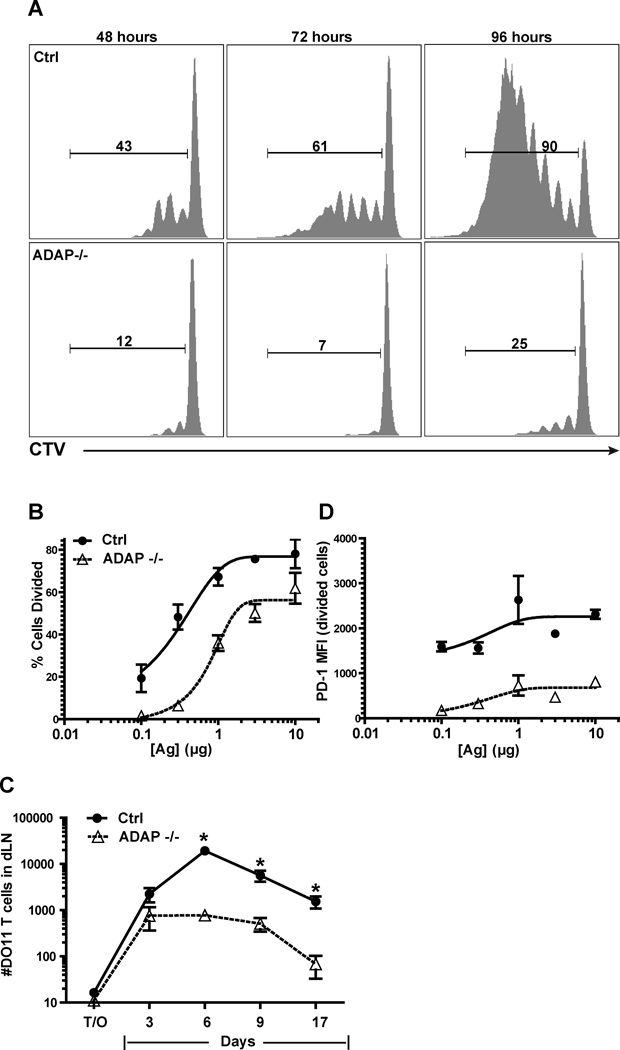
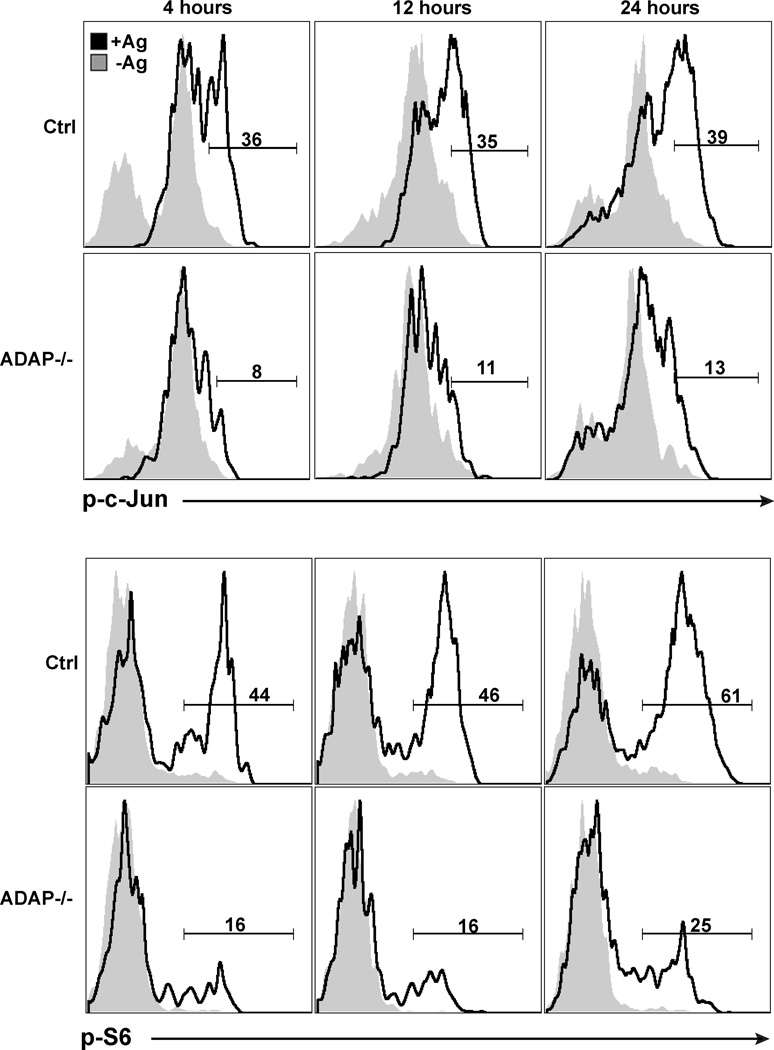
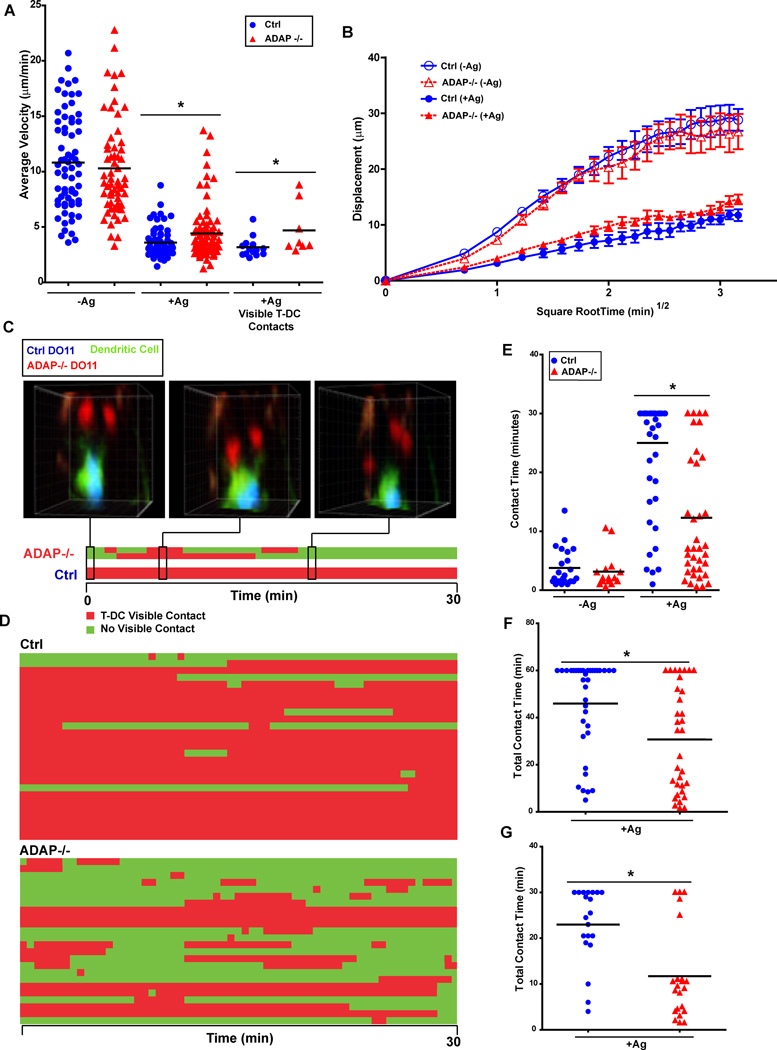
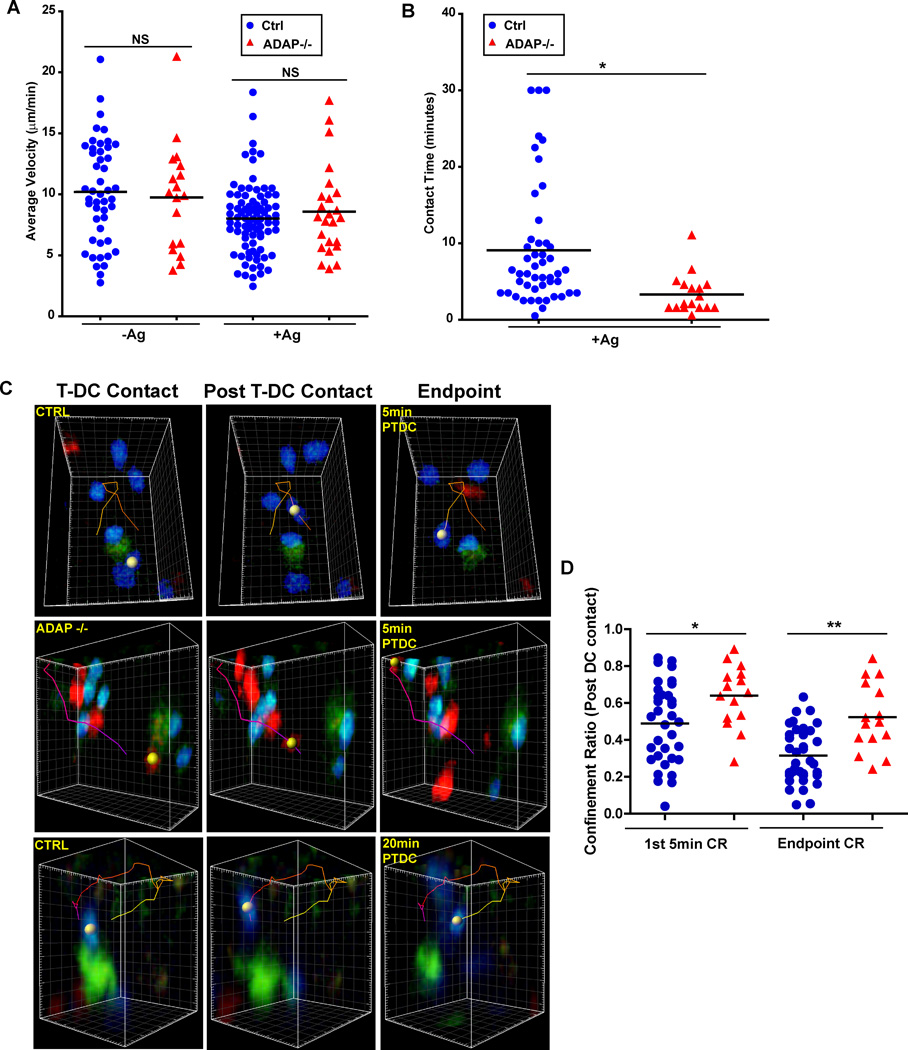
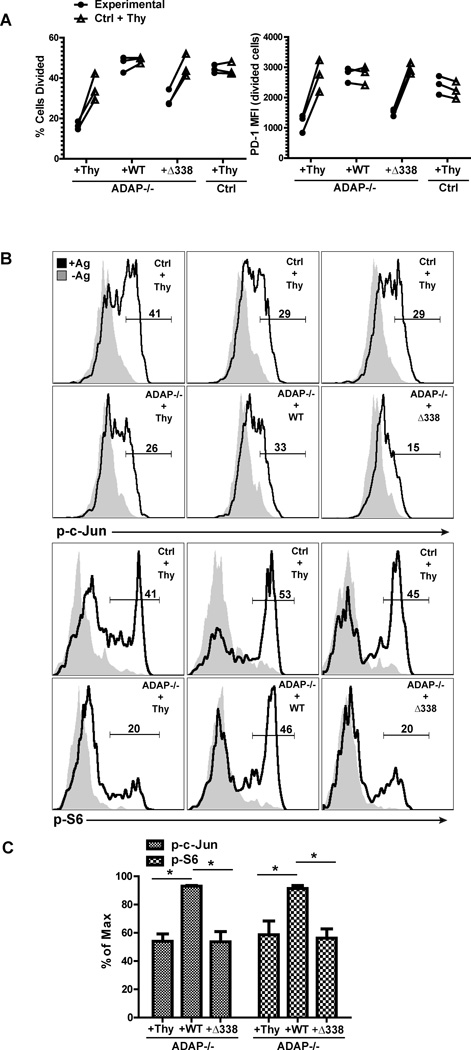
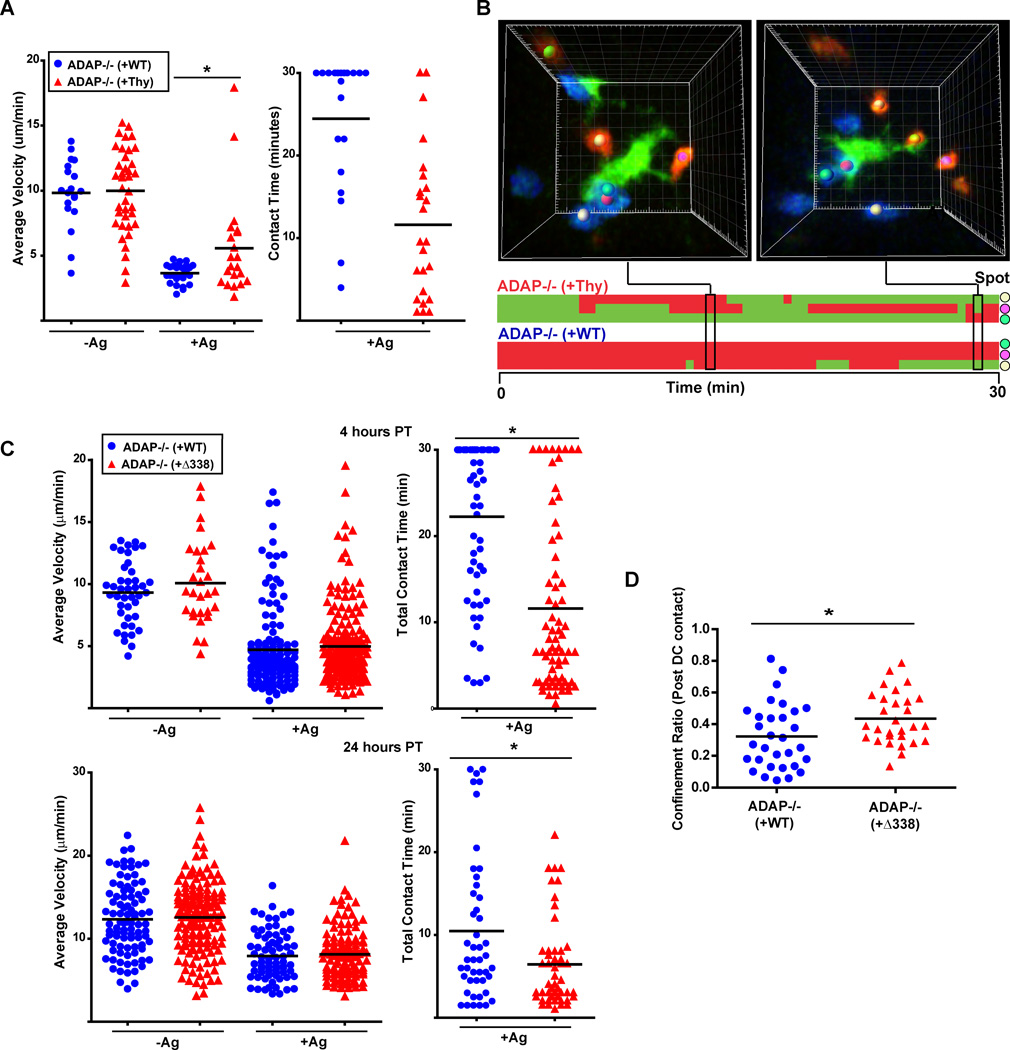
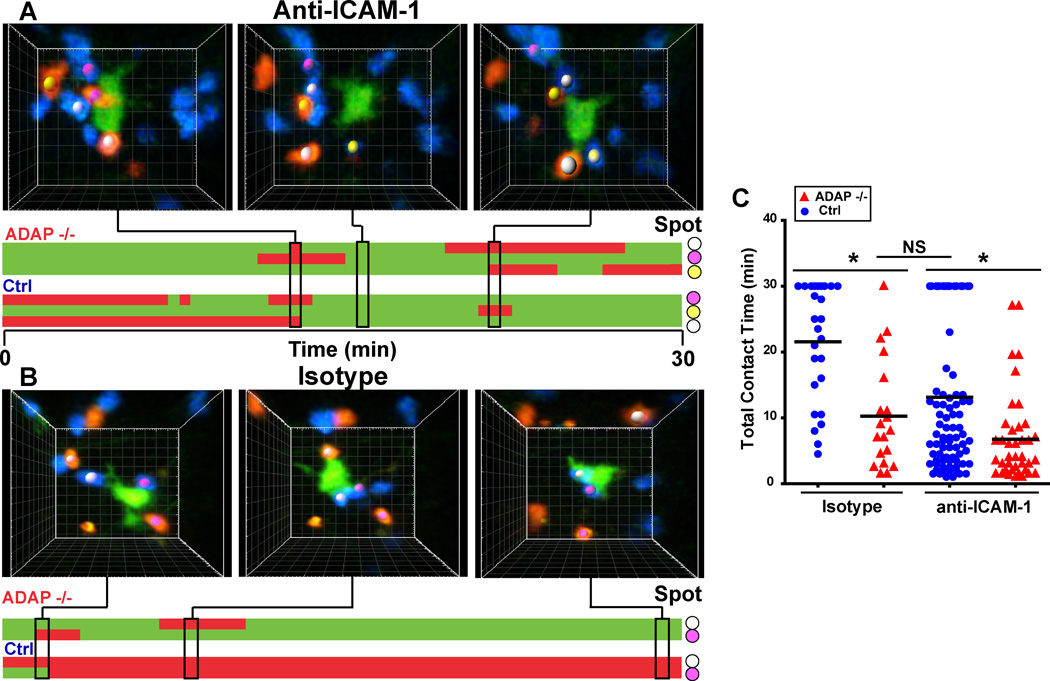
The Ag-specific interactions between T cells and dendritic cells progress through dynamic contact stages in vivo consisting of early long-term stable contacts and later confined, yet motile, short-lived contacts. The signaling pathways that control in vivo interaction dynamics between T cells and dendritic cells during priming remain undefined. Adhesion and degranulation promoting adapter protein (ADAP) is a multifunctional adapter that regulates "inside-out" signaling from the TCR to integrins. Using two-photon microscopy, we demonstrate that, in the absence of ADAP, CD4 T cells make fewer early-stage stable contacts with Ag-laden dendritic cells, and the interactions are characterized by brief repetitive contacts. Furthermore, ADAP-deficient T cells show reduced contacts at the late motile contact phase and display less confinement around dendritic cells. The altered T cell interaction dynamics in the absence of ADAP are associated with defective early proliferation and attenuated TCR signaling in vivo. Regulation of multistage contact behaviors and optimal T cell signaling involves the interaction of ADAP with the adapter src kinase-associated phosphoprotein of 55 kDa (SKAP55). Thus, integrin activation by the ADAP-SKAP55-signaling module controls the stability and duration of T cell-dendritic cell contacts during the progressive phases necessary for optimal T cell activation.


Figures

Figure 1
Figure 1. ADAP-deficient T cells show impaired antigen-dependent T cell activation in vivo
CTV-labeled wild-type and ADAP−/− DO11.10 T cells (200,000 T cells each) were co-transferred into IFA/OVA primed hosts. (A) Proliferation in the draining LNs was assessed at different times. Proliferation (B) and PD-1 expression (D) was assessed at 48 hours post-transfer at different antigen concentrations. (C) CTV-labeled wild-type and ADAP−/− DO11.10 T cells (10,000 cells each) were co-transferred into IFA/OVA ear primed hosts. Clonal expansion in the draining LNs was assessed at the indicated times. All plots are each representative of at least 3 independent experiments. *, P<0.05 unpaired t test.
Figure 2
Figure 2. DAP-deficient T cells show impaired early TCR signaling following antigen challenge in vivo
Wild-type and ADAP−/− DO11 T cells (200,000 T cells) were co-transferred into recipient mice challenged with either IFA alone (shaded histograms, -Ag) or IFA/OVA (black histograms, +Ag) in the ear. Draining LNs were harvested at the indicated time points, fixed and stained for phosphorylated c-Jun and S6. Plots are representative of 4 independent experiments.
Figure 3
Figure 3. ADAP-deficient T cells do not form early stable contacts with cognate DCs in vivo
CTV-labeled wild-type (blue) and CTO-labeled ADAP−/− (red) DO11.10 T cells (3 × 10⁶ cells each) were co-transferred into CFSE/IFA ear-primed recipients, with or without 1 µg OVA antigen (Ag), and draining LNs were harvested four hours after transfer and imaged by TPLSM. Average track velocity (A) and cell displacement (B) of individual movies representative of at least 5 independent experiments. (C) Three-dimensional images and corresponding kymograph of a single CFSE-labeled DC (green) interacting with 2 wild-type (blue) and 2 ADAP −/− (red) DO11 T cells. (D) Kymograph of T-DC interactions with multiple DCs from a single acquired movie. (E) Pooled cumulative T-DC contact time at 4 hours after antigen challenge from three separate movies. (F) Pooled cumulative T-DC contact time at 4 hours after challenge with a high dose of antigen (5 µg) from three separate movies. (G) Pooled cumulative T-DC contact time at 8 hours after challenge with 1 µg OVA from three separate movies. *, P<0.05 unpaired t test.
Figure 4
Figure 4. ADAP-deficient T cells are not confined near DC contact sites at the late swarming contact phase
CTV-labeled wild-type (blue) and CTO-labeled ADAP−/− (red) DO11.10 T cells (1 × 10⁶ cells each) were co-transferred into CFSE/IFA ear-primed recipients, with or without OVA antigen (Ag), and draining LNs were harvested 24 hours after transfer and imaged by TPLSM. (A) Average track velocity of individual movies from 3 independent experiments. (B) Pooled cumulative T cell-DC contact time from three independent experiments. (C) Three-dimensional images of CFSE-labeled DCs (green) interacting with wild-type (blue) and ADAP−/− (red) DO11.10 T cells. The images show the initial T cell-DC contact, the contact termination or post T cell-DC contact, and the endpoint displacement of the cell after 5 min or 20 min. (D) The pooled confinement ratio of the tracks described in (C) from 3 independent experiments. *, P<0.05; **, P=0.001 unpaired t test.
Figure 5
Figure 5. The SKAP55 binding region in ADAP regulates early T cell activation in vivo
Primary ADAP−/− DO11.10 hCAR T cells were transduced with control adenovirus expressing Thy1.1 or adenovirus expressing Thy1.1 and either wild-type ADAP or the ADAPΔ338 mutant as described in Methods. ADAP−/− reconstituted cells were co-transferred with wild-type DO11.10 hCAR T cells transduced with control adenovirus expressing Thy1.1 into OVA/IFA primed mice. (A) Proliferation in draining LNs was determined by CFSE (Ctrl + Thy; wild-type DO11.10 T cells transduced with control Thy1.1 adenovirus) and CTV (Experimental; ADAP−/− DO11.10 T cells transduced with the indicated adenovirus) dilution 48 hours after transfer. Cell samples were also stained for PD-1 expression. (B) Draining LNs were harvested at 4 hours after transfer, fixed and stained for phosphorylated c-Jun and S6. (C) Intracellular staining for phosphorylated c-Jun and S6 from 3 independent experiments as in (B) normalized to the maximum response in each mouse (response of wild-type DO11.10 T cells transduced with control adenovirus). *, P<0.05 unpaired t test.
Figure 6
Figure 6. The SKAP55 binding region in ADAP regulates stable contacts and late stage DC confinement
Primary ADAP−/− DO11.10 hCAR T cells were transduced with control adenovirus expressing Thy1.1 or adenovirus expressing Thy1.1 and either wild-type ADAP or the ADAPΔ338 mutant as described in Methods. (A) ADAP−/− DO11.10 T cells transduced with control Thy1.1 adenovirus were labeled with CTO (red) and co-transferred with ADAP−/− DO11.10 T cells transduced with adenovirus expressing Thy1.1 and wild-type ADAP and labeled with CTV (blue) into mice primed with CFSE/IFA with or without OVA antigen (Ag). Graphs show average velocity and T-DC contact time from 3 independent movies at four hours post T cell transfer. (B) Three-dimensional images and corresponding kymograph of a single DC interacting with transferred T cells at 4 hours after transfer. Colored spots match cell images to contacts on the kymograph. (C) CTO-labeled ADAP−/− DO11.10 T cells transduced with ADAPΔ338 adenovirus (red) were co-transferred as in (A) with CTV-labeled ADAP−/− DO11.10 T cells transduced with wild-type ADAP adenovirus (blue). Graphs show average velocity and T-DC contact time from 3 independent movies at 4 hours (top) and 24 hours (bottom) post T cell transfer. (D) Pooled post-T cell-DC contact endpoint confinement ratio from 3 independent movies at 24 hours post-transfer for ADAP−/− DO11.10 T cells transduced with wild-type ADAP (blue) and ADAP−/− DO11.10 T cells transduced with ADAPΔ338 adenovirus (red). *, P<0.05 unpaired t test.
Figure 7
Figure 7. Inhibition of ICAM-1 reduces T cell contact time with antigen-laden DCs
CTV-labeled wild-type (blue) and CTO-labeled ADAP−/− (red) DO11.10 T cells were co-transferred into CFSE/IFA ear-primed recipients with OVA antigen (Ag). One hour after T cell transfer, 200 µg of anti-ICAM-1 antibody or isotype control antibody was administered by i.p. injection. Draining LNs were harvested 3 hours after antibody treatment and imaged by TPLSM. (A, B) Three-dimensional images and corresponding kymographs of a single DC interacting with transferred T cells in the presence of anti-ICAM-1 antibody (A) or isotype control antibody (B). Colored spots match cell images to contacts on the kymograph. (C) Pooled cumulative T-DC contact time from three separate movies. *, P<0.05 unpaired t test.

References

    1. Burbach BJ, Medeiros RB, Mueller KL, Shimizu Y. T cell receptor signaling to integrins. Immunol. Rev. 2007;218:65–81. - PubMed
    1. Germain RN, Robey EA, Cahalan MD. A decade of imaging cellular motility and interaction dynamics in the immune system. Science. 2012;336:1676–1681. - PMC - PubMed
    1. Cahalan MD, Parker I. Choreography of cell motility and interaction dynamics imaged by two-photon microscopy in lymphoid organs. Annu. Rev. Immunol. 2008;26:585–626. - PMC - PubMed
    1. Miller MJ, Wei SH, Parker I, Cahalan MD. Two-photon imaging of lymphocyte motility and antigen response in intact lymph node. Science. 2002;296:1869–1873. - PubMed
    1. Miller MJ, Safrina O, Parker I, Cahalan MD. Imaging the single cell dynamics of CD4+ T cell activation by dendritic cells in lymph nodes. J. Exp. Med. 2004;200:847–856. - PMC - PubMed

Publication types

MeSH terms