. 2013 Sep 1;191(5):2717-30.
doi: 10.4049/jimmunol.1203268. Epub 2013 Aug 5.

Two phases of inflammatory mediator production defined by the study of IRAK2 and IRAK1 knock-in mice

Affiliations

Two phases of inflammatory mediator production defined by the study of IRAK2 and IRAK1 knock-in mice

Eduardo Pauls et al. J Immunol. .

Erratum in

  • J Immunol. 2013 Nov 15;191(10):5317

Abstract

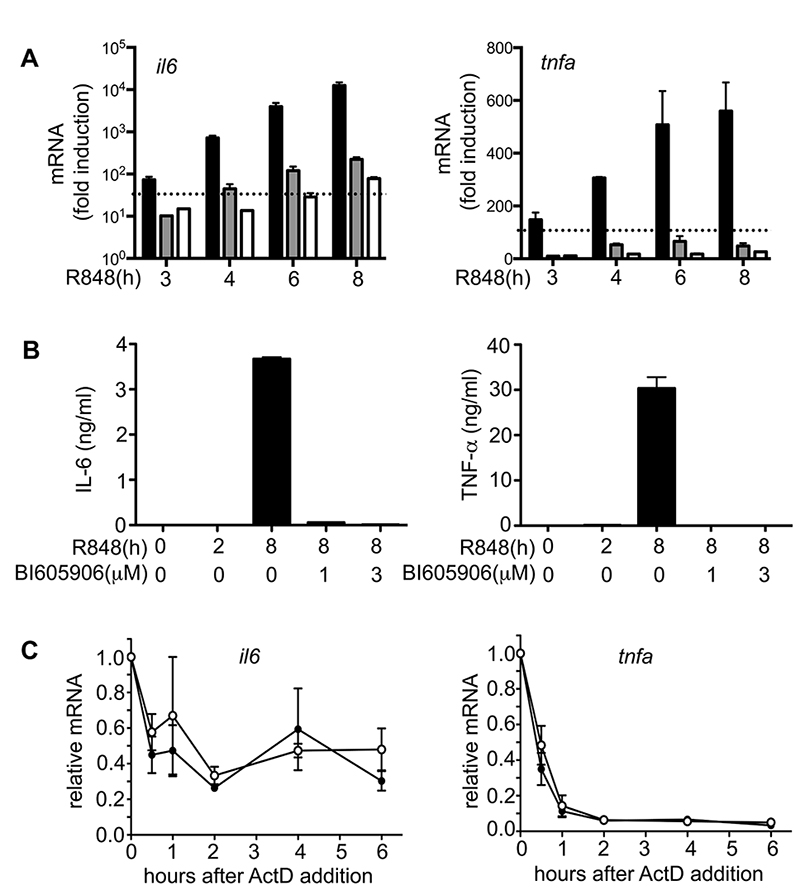
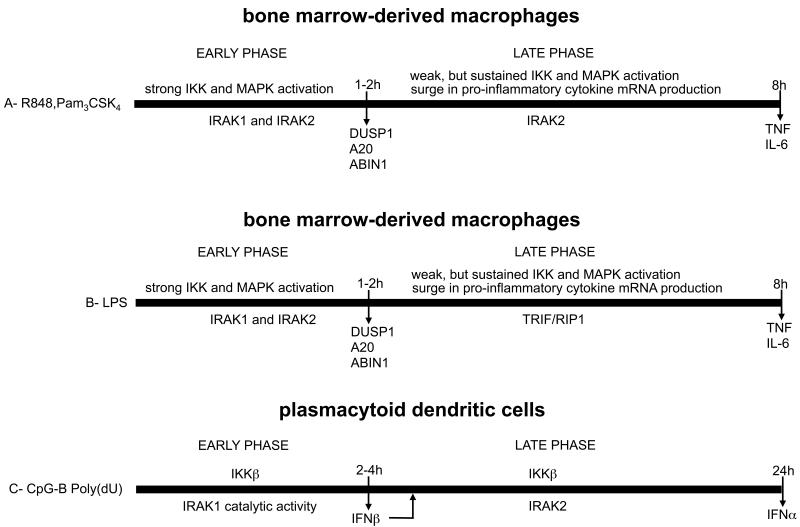
The roles of IL-1R-associated kinase (IRAK)2 and IRAK1 in cytokine production were investigated using immune cells from knock-in mice expressing the TNFR-associated factor 6 (TRAF6) binding-defective mutant IRAK2[E525A] or the catalytically inactive IRAK1[D359A] mutant. In bone marrow-derived macrophages (BMDMs), the IRAK2-TRAF6 interaction was required for the late (2-8 h) but not the early phase (0-2 h) of il6 and tnfa mRNA production, and hence for IL-6 and TNF-α secretion by TLR agonists that signal via MyD88. Loss of the IRAK2-TRAF6 interaction had little effect on the MyD88-dependent production of anti-inflammatory molecules produced during the early phase, such as Dual Specificity Phosphatase 1, and a modest effect on IL-10 secretion. The LPS/TLR4-stimulated production of il6 and tnfa mRNA and IL-6 and TNF-α secretion was hardly affected, because the Toll/IL-1R domain-containing adapter-inducing IFN-β (TRIF) signaling pathway was used instead of the IRAK2-TRAF6 interaction to sustain late-phase mRNA production. IRAK1 catalytic activity was not rate limiting for il6, tnfa, or il10 mRNA production or the secretion of these cytokines by BMDMs, but IFN-β mRNA induction by TLR7 and TLR9 agonists was greatly delayed in plasmacytoid dendritic cells (pDCs) from IRAK1[D359A] mice. In contrast, IFN-β mRNA production was little affected in pDCs from IRAK2[E525A] mice, but subsequent IFN-α mRNA production and IFN-α secretion were reduced. IFN-β and IFN-α production were abolished in pDCs from IRAK1[D359A] × IRAK2[E525A] double knock-in mice. Our results establish that the IRAK2-TRAF6 interaction is rate limiting for the late, but not the early phase of cytokine production in BMDM and pDCs, and that the IRAK2-TRAF6 interaction is needed to sustain IκB-inducing kinase β activity during prolonged activation of the MyD88 signaling network. [corrected]


Figures

Figure 1
Figure 1. Generation of an IRAK2[E525A] knock-in mice
(A) Mice were generated in which Glu525 of IRAK2 was mutated to Ala using the strategy detailed in Materials and Methods. The polyA-trapping neomycin cassette was used for positive selection, which allowed ES cell colonies to be screened by reverse transcription PCR of mRNA using the primers indicated (p1 and p2). This generated a 317-bp band in correctly targeted clones. The presence of the 5′ loxP site was confirmed by PCR of genomic DNA using primers p2 and p3. Correctly targeted ES cell clones were used to generate chimeric mice, and germline transmitting chimeric mice crossed to mice containing an Flpe transgene to excise the neomycin gene. Excision of this gene was confirmed by PCR using primers p5 and p6. (B) BMDM lysates (10 μg protein) from WT or IRAK2[E525A] (E/A) mice were immuno-blotted with the antibodies indicated. (C) IRAK1-null IL-1R HEK293 cells were co-transfected with plasmids encoding HA-tagged mouse TRAF6 (HA-TRAF6) or an empty vector (vector), and either FLAG-mouse WT IRAK2 (FL-WT) or FLAG-mouse IRAK2[E525A](FL-E/A). After 24 h, the cells were lysed and cell extracts subjected to SDS-PAGE and immuno-blotting with anti-HA or anti-FLAG to monitor the expression of TRAF6 and IRAK2 (top two panels). The FLAG-tagged IRAK2 (middle two panels) or HA-tagged TRAF6 (bottom two panels) were immunoprecipitated from 0.25 mg of cell extract protein then denatured in SDS subjected to SDS-PAGE and immuno-blotted with either anti-HA or anti-FLAG antibodies. (D) The experiment was carried out as in (C), except that HA-TRAF6 was omitted from all transfections. In the middle two panels the endogenous human TRAF6 in the cells was immunoprecipitated from 0.5 mg cell extract protein and the presence of FLAG-IRAK2 (FL-WT) or FLAG-IRAK2[E525A] (FL-E/A) in the immunoprecipitates was detected by immunoblotting with anti-FLAG. In the bottom two panels, FLAG-IRAK2[WT] (FL-WT) or FLAG-IRAK2[E525A] (FL-E/A) were immunoprecipitated and the presence of the endogenous human TRAF6 was detected by immunoblotting. (E) Primary BMDMs were stimulated with 1.0 μg/ml R848 for the times indicated. The cells were lysed and TRAF6 immunoprecipitated from the cell extracts and treated with USP2 and phage λ phosphatase to deubiquitylate and dephosphorylate IRAK2 (see Materials and Methods). Proteins were released from the antibody-Sepharose conjugate by denaturation in SDS and the supernatants subjected to SDS-PAGE and immuno-blotting with the antibodies indicated.
Figure 2
Figure 2. The activation and expression of signaling components of the MyD88 network in BMDM from IRAK2[E525A] mice during prolonged stimulation with TLR agonists
(A, B) BMDMs from WT (IRAK2[WT]) and IRAK2[E525A] mice were stimulated for the times indicated with 1 μg/ml R848 (A) or 1 μg/ml Pam3CSK4 (B). Cell extract protein (10 μg) was denatured in SDS, subjected to SDS-PAGE and immunoblotted with the indicated antibodies. Similar results were obtained in three separate experiments. (C, D) Primary WT BMDMs (prepared using L929 preconditioned medium) were stimulated for the times indicated with 1 μg/ml R848. The cells were lysed and IRAK1 (C) or IRAK2 (D) immunoprecipitated from the cell extracts and treated with (+) or without (−) USP2 and phage λ phosphatase as described in Materials and Methods. The reactions were terminated in SDS and after removal of the protein G-agarose, the supernatants were subjected to SDS-PAGE and immunoblotted with the antibodies indicated. (E) As in (D), except that IRAK2 was immunoprecipitated from the extracts of WT or IRAK2[E525A] mice. (F) As in (D), except that the IRAK2 immunoprecipitates were incubated with (+) or without (−) USP2 and/or phage λ phosphatase. Data are representative of two to three independent experiments. *NS, non-specific band.
Figure 3
Figure 3. Reduced cytokine production in BMDMs from IRAK2[E525A] mice after prolonged stimulation with TLR agonists
(A, B) BMDMs from WT (black bars) and IRAK2[E525A] (white bars) mice were incubated for the times indicated in the presence of 1 μg/ml R848 (A) or 1 μg/ml Pam3CSK4 (B). RNA was extracted from the cells and il6 and tnfa mRNA was measured by quantitative real-time PCR. The results are plotted as the fold increase in mRNA relative to the level determined in unstimulated cells. Error bars represent the mean ± SEM for experiments with BMDMs from three mice of each genotype. The data shown are representative of three independent experiments. (C) BMDMs from WT (black bars) or IRAK2[E525A] (white bars) mice were incubated for 7 h in the absence of any agonist (control [C]), 1 μg/ml R848, 1 μg/ml Pam3CSK4 (Pam), 2 μM ODN1826 (CpG), 1 μg/ml LTA, or 100 ng/ml LPS. The concentrations of IL-6, TNF-α, MIP1α and MIP1β in the supernatant were then measured. Error bars represent the mean ± SD for experiments with BMDMs from three mice of each genotype. The data shown are representative of three independent experiments. *p ≤ 0.05, **p ≤ 0.005, ***p ≤ 0.0005.
Figure 4
Figure 4. Inhibition of IKKβ leads to suppression of pro-inflammatory cytokine production
(A) BMDMs from WT mice were stimulated for 2 h with 1.0 μg/ml R848. The IKKβ inhibitor BI605906 was then added to the culture medium to a concentration of 1.0 μM (grey bars) or 3.0 μM (white bars). The black bars show a control experiment in which no inhibitor was added after 2 h. RNA was extracted from the cells at each time point, and il6 and tnfa mRNA was measured by quantitative real-time PCR. Results are plotted as the fold increase in mRNA relative to the level determined in unstimulated cells, and the broken line indicates the amount of mRNA produced after 2 h before the addition of BI605906. Error bars show the average of duplicate determinations for each condition. Data shown are representative of two independent experiments. (B) Cell culture supernatants from (A) were collected and the concentrations of IL-6 and TNF-α were measured. (C) BMDM from either WT (○) or IRAK2[E525A] mice (●) were stimulated for 1.5 h with 1.0 μg/ml R848 and actinomycin D (ActD) was added to the culture medium to a final concentration of 5 μg/ml. Stimulation with R848 was continued and RNA was extracted from the cells at the times indicated and il6 (left panel) and tnfa (right panel) mRNA was measured by qPCR. The ordinate shows the mRNA levels at each time point relative that measured at the time of ActD addition (1.0). Error bars represent the mean ± SEM for experiments with BMDM from three mice of each genotype. Data shown are representative of two independent experiments.
Figure 5
Figure 5. Effect of loss of the IRAK2-TRAF6 interaction on the production of some anti-inflammatory molecules
(A) BMDMs from WT (black bars) and IRAK2[E525A] (white bars) mice were stimulated with 1.0 μg/ml R848 for the times indicated. RNA was extracted from the cells and dusp1 and tnfaip3 mRNA was measured by quantitative real-time PCR. The results are plotted as the fold increase in mRNA relative to the level determined in unstimulated cells. Error bars represent the mean ± SEM for two independent experiments each with BMDMs from three mice of each genotype. (B) As in (A), except that BMDMs were stimulated with 1.0 μg/ml Pam3CSK4 or 1.0 μg/ml R848 and il10 mRNA was measured by quantitative PCR. Error bars represent the mean ± SEM for two independent experiments each with BMDMs from three mice of each genotype. (C) As in (B), except that the concentration of IL-10 in the cell culture medium was measured. Error bars represent the mean ± SD for two independent experiments each with BMDMs from three mice of each genotype. (D) BMDMs from WT (black bars) or IRAK2[E525A] (white bars) mice were incubated for 7 h in the absence of any agonist (control [C]) or stimulated with 1.0 μg/ml R848, 1 μg/ml Pam3CSK4 (Pam), 2 μM ODN1826 (CpG-B), 1.0 μg/ml lipoteichoic acid (LTA) or 100 ng/ml LPS (LPS). The concentration of IL-10 in the supernatant was then measured. Error bars represent the mean ± SD for three independent experiments with BMDMs each using three mice of each genotype. *p ≤ 0.05, **p ≤ 0.005, ***p ≤ 0.0005.
Figure 6
Figure 6. LPS induced protein kinase activation and pro-inflammatory cytokine production in BMDMs from IRAK2[E525A] and TRIF−/− mice
(A) Primary BMDMs from WT and IRAK2[E525A] mice were stimulated for the times indicated with 100 ng/ml LPS, and then lysed. Cell extract protein (10 μg) was denatured in SDS, subjected to SDS-PAGE and immunoblotted with the antibodies indicated. The data shown is representative of two independent experiments. (B) BMDMs from WT (black bars) and IRAK2[E525A] (white bars) mice were incubated for the times indicated in the presence of 100 ng/ml LPS. RNA was extracted from the cells and il6, tnfa or il10 mRNA was measured by quantitative PCR. The results are plotted as the fold increase in mRNA relative to the level determined in unstimulated cells. Error bars represent the mean ± SEM for experiments with BMDMs from three mice of each genotype. The data shown is representative of three independent experiments. (C) BMDMs from TRIF+/+ and TRIF−/− mice were stimulated with 100 ng/ml LPS for the times indicated. Following cell lysis, 20 μg of cell extract protein was denatured in SDS, subjected to SDS-PAGE and immunoblotted with the antibodies indicated. One blot representative of three independent experiments is shown. (D) BMDMs from TRIF+/+ (black bars) and TRIF−/− (white bars) mice were incubated for the indicated times with 100 ng/ml LPS. RNA was extracted from the cells and il6 (upper panel), tnfa (middle panel) and il10 (lower panel) mRNA levels were measured by quantitative PCR. The results are plotted as fold increase in mRNA relative to the level determined in unstimulated cells. Error bars represent the mean ± SEM for experiments with BMDMs from three mice of each genotype. The data shown is representative of three independent experiments (E) BMDMs from TRIF+/+ (black bars) and TRIF−/− (white bars) mice were incubated for 8 h with 100 ng/ml of LPS and the concentrations of IL-6, TNF-α and IL-10 in the cell culture supernatant were measured. The data are representative of two independent experiments with three mice of each genotype analyzed together. Error bars show the mean ± SD. *p ≤ 0.05, **p ≤ 0.005).
Figure 7
Figure 7. Suppression of type 1 IFN production in pDCs from IRAK2[E525A] mice and IRAK1[D359A] mice
(A) pDCs from WT or IRAK2[E525A] × IRAK1[D359A] mice were stimulated for the times indicated with 0.05 μM of CpG B. RNA was extracted from the cells and mRNA encoding ifnb (left panel), Ifna4 (middle panel) or Ifna6 (right panel) was determined by quantitative PCR. (B) As in (A) but pDCs from WT and IRAK2[E525A] mice. (C) As in (B) except WT pDCs were compared with IRAK1[D359A] mice. The results are plotted as the fold increase in mRNA relative to the level measured in unstimulated cells. The experiments were performed in 96 well plates with three wells being used for each condition, each containing pDCs from a different mouse. The results are presented as the Mean ± SEM for one representative experiment. Similar results were obtained in two independent experiments. *p ≤ 0.05, **p ≤ 0.005).
Figure 8
Figure 8. Inhibition on IFN production in IRAK2[E525A] × IRAK1[D359A] mice correlates with impaired activation of IKKβ
(A) pDCs from WT or IRAK2[E525A] × IRAK1[D359A] mice were not stimulated (NS) or stimulated for 12 h with 0.05 μM of CpG B, 1 μM CpG A or 25 μg/ml of poly(dU) and the concentration of IFN-α in the cell culture medium measured by ELISA. (B) As in (A) but pDCs from WT or IRAK2[E525A] mice were compared. (C) As in (B) except WT pDCs were compared with pDCs from IRAK1[D359A] mice. The experiments were performed in 96 well plates with three wells being used for each condition, each containing pDCs from a different mouse. Bars represent the Mean ± SEM of one representative experiment. (A-C) *p ≤ 0.05, **p ≤ 0.005, ***p ≤ 0.0005. Similar results were obtained in two to three independent experiments. (D) pDCs from wild type (WT) or IRAK2[E525A] mice were stimulated for the times indicated with 0.05 μM CpG B and cell lysates subjected to SDS-PAGE followed by immunoblotting with the antibodies indicated. The blot shown is representative of three independent experiments. (E) As in (D) except pDCs from wild type (WT) or IRAK1[D359A] were compared. (F) As in (E) but pDCs cells from WT and IRAK2[E525A] × IRAK1[D359A] mice were compared. The blots shown are representative of two to three independent experiments.
Figure 9
Figure 9. Two phases of inflammatory mediator production defined by the study of IRAK2 and IRAK1 knock-in mice
(A) Inflammatory mediator production in BMDMs by TLR agonists that signal via MyD88. (B) Inflammatory mediator production in BMDMs by the TLR4 agonist LPS that signals via both MyD88 and TRIF. (C) Type 1 IFN production in pDCs by ligands that activate TLR7 and TLR9.

References

    1. Hidmark A, von Saint Paul A, Dalpke AH. Cutting edge: TLR13 is a receptor for bacterial RNA. J Immunol. 2012;189:2717–2721. - PubMed
    1. Kawai T, Akira S. The role of pattern-recognition receptors in innate immunity: update on Toll-like receptors. Nat Immunol. 2010;11:373–384. - PubMed
    1. Kagan JC, Su T, Horng T, Chow A, Akira S, Medzhitov R. TRAM couples endocytosis of Toll-like receptor 4 to the induction of interferon-beta. Nat Immunol. 2008;9:361–368. - PMC - PubMed
    1. Lin SC, Lo YC, Wu H. Helical assembly in the MyD88-IRAK4-IRAK2 complex in TLR/IL-1R signalling. Nature. 2010;465:885–890. - PMC - PubMed
    1. Motshwene PG, Moncrieffe MC, Grossmann JG, Kao C, Ayaluru M, Sandercock AM, Robinson CV, Latz E, Gay NJ. An oligomeric signaling platform formed by the Toll-like receptor signal transducers MyD88 and IRAK-4. J Biol Chem. 2009;284:25404–25411. - PMC - PubMed

Publication types

MeSH terms

LinkOut - more resources