. 2013 Sep 1;191(5):2194-204.
doi: 10.4049/jimmunol.1200646. Epub 2013 Aug 5.

Programmed death-1 is a marker for abnormal distribution of naive/memory T cell subsets in HIV-1 infection

Affiliations

Programmed death-1 is a marker for abnormal distribution of naive/memory T cell subsets in HIV-1 infection

Gaëlle Breton et al. J Immunol. .

Abstract

Chronic activation of T cells is a hallmark of HIV-1 infection and plays an important role in disease progression. We previously showed that the engagement of the inhibitory receptor programmed death (PD)-1 on HIV-1-specific CD4(+) and CD8(+) T cells leads to their functional exhaustion in vitro. However, little is known about the impact of PD-1 expression on the turnover and maturation status of T cells during the course of the disease. In this study, we show that PD-1 is upregulated on all T cell subsets, including naive, central memory, and transitional memory T cells in HIV-1-infected subjects. PD-1 is expressed at similar levels on most CD4(+) T cells during the acute and the chronic phase of disease and identifies cells that have recently entered the cell cycle. In contrast, PD-1 expression is dramatically increased in CD8(+) T cells during the transition from acute to chronic infection, and this is associated with reduced levels of cell proliferation. The failure to downregulate expression of PD-1 in most T cells during chronic HIV-1 infection is associated with persistent alterations in the distribution of T cell subsets and is associated with impaired responses to IL-7. Our findings identify PD-1 as a marker for aberrant distribution of T cell subsets in HIV-1 infection.


Figures

Figure 1
Figure 1
Disruption of T cell subsets homeostasis in HIV-1 infection is specific to each disease stage. A. Seven-parameter flow cytometry gating strategy to identify CD4+ and CD8+ T cell subsets. TN, TCM, TTM, TEM and TTD/TE subsets are identified based on their CD45RA, CCR7 and CD27 expression. B. Distribution of blood CD4+ and CD8+ T cell subpopulations in acute-untreated (n=8; black symbol), chronic-untreated (n=13; red symbol), chronic-treated (n=15; blue symbol) and uninfected (n=15; green symbol) subjects. Each symbol represents one subject. Means are shown as horizontal bars. Statistical significance was determined using the Mann-Whitney U test. * p<0.05, ** p<0.001, *** p<0.0001.
Figure 2
Figure 2
Differentiation toward senescent stages of all T cell subsets characterized by loss of CD28 expression and increased CD57 expression in HIV-1 infection. a. Percentage of ex-vivo CD28 expressing cells in CD4+ and CD8+ T cell subsets in HIV-1 infected individuals and controls. b. Percentage of ex-vivo CD57 expressing cells in CD4+ and CD8+ T cell subsets in HIV-1 infected individuals and controls. Each symbol represents one subject: acute-untreated (n=8; black symbol), chronic-untreated (n=13; red symbol), chronic-treated (n=15; blue symbol) and uninfected (n=15; green symbol) subjects. Means are shown as horizontal bars. Statistical significance was determined using the Mann-Whitney U test. * p<0.05, ** p<0.001, *** p<0.0001.
Figure 3
Figure 3
Increased percentage of Ki67+ proliferating cells in CD4+ and CD8+ T cell subsets during HIV-1 infection. Bars represent mean values of acute-untreated (n=8; black bar), chronic-untreated (n=13; red bar) chronic-treated (n=15; blue bar) and uninfected (n=15; green bar) subjects. Statistical significance was determined using the Mann-Whitney U test. * p<0.05, ** p<0.001, *** p<0.0001.
Figure 4
Figure 4
PD-1 up regulation on all T cell subsets in both acute and chronic infection. Each symbol represents one subject: acute-untreated (n=8; black symbol), chronic-untreated (n=13; red symbol), chronic-treated (n=15; blue symbol) and uninfected (n=15; green symbol) subjects. Means are shown as horizontal bars. Statistical significance was determined using the Mann-Whitney U test. * p<0.05, ** p<0.001, *** p<0.0001.
Figure 5
Figure 5
A. Concomitant expressions of Ki67 and PD-1 in CD8+ T cell subsets allow to discriminate between acute and chronic HIV-1 infection. Each symbol represents one subject: acute-untreated (n=8; black symbol), chronic-untreated (n=13; red symbol), chronic-treated (n=15; blue symbol) and uninfected (n=15; green symbol) subjects. B. Expression of PD-1 on Ki67+ cells versus Ki67 cells in the CD8 compartment is much higher in chronic than in acute HIV-1 infection. Each bar represents one group of subjects: acute-untreated (n=8; black bar), chronic-untreated (n=13; red bar), chronic-treated (n=15; blue bar) and uninfected (n=15; green bar) subjects. Means are shown as horizontal bars. Statistical significance was determined using the Mann-Whitney U test. * p<0.05, ** p<0.001, *** p<0.0001.
Figure 6
Figure 6
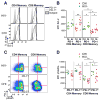
Baseline Bcl-2 and IL-7 induced Stat-5 phosphorylation in PD-1high and PD-1low CD45RA memory T cells. A. Representative dot plot analysis showing Bcl-2 expression in PD-1high and PD-1low CD45RA CD4+ or CD8+ T cells. B. Bcl-2 expression in PD-1high and PD-1low CD45RA CD4+ or CD8+ T cells of HIV-1 infected individuals and controls. Each symbol represents one subject: chronic-untreated (n=8; red symbol), and uninfected (n=5; green symbol) subjects. Means are shown as horizontal bars. Statistical significance was determined using the Mann-Whitney U test. * p<0.05, ** p<0.001, *** p<0.0001. C. Representative dot plot analysis showing pStat5a expression in PD-1high and PD-1low CD45RA CD4+ or CD8+ T cells. D. pStat5a expression in PD-1high and PD-1low CD45RA CD4+ or CD8+ T cells of HIV-1 infected individuals and controls. Each symbol represents one subject: chronic-untreated (n=8; red symbol), and uninfected (n=5; green symbol) subjects. Means are shown as horizontal bars. Statistical significance was determined using the Mann-Whitney U test. * p<0.05, ** p<0.001, *** p<0.0001.

References

    1. Brenchley JM, Price DA, Schacker TW, Asher TE, Silvestri G, Rao S, Kazzaz Z, Bornstein E, Lambotte O, Altmann D, Blazar BR, Rodriguez B, Teixeira-Johnson L, Landay A, Martin JN, Hecht FM, Picker LJ, Lederman MM, Deeks SG, Douek DC. Microbial translocation is a cause of systemic immune activation in chronic HIV infection. Nat Med. 2006;12:1365–1371. - PubMed
    1. Giorgi JV, Liu Z, Hultin LE, Cumberland WG, Hennessey K, Detels R. Elevated levels of CD38+ CD8+ T cells in HIV infection add to the prognostic value of low CD4+ T cell levels: results of 6 years of follow-up. The Los Angeles Center, Multicenter AIDS Cohort Study. J Acquir Immune Defic Syndr. 1993;6:904–912. - PubMed
    1. Liu Z, Cumberland WG, Hultin LE, Prince HE, Detels R, Giorgi JV. Elevated CD38 antigen expression on CD8+ T cells is a stronger marker for the risk of chronic HIV disease progression to AIDS and death in the Multicenter AIDS Cohort Study than CD4+ cell count, soluble immune activation markers, or combinations of HLA-DR and CD38 expression. J Acquir Immune Defic Syndr Hum Retrovirol. 1997;16:83–92. - PubMed
    1. Cohen Stuart JW, Hazebergh MD, Hamann D, Otto SA, Borleffs JC, Miedema F, Boucher CA, de Boer RJ. The dominant source of CD4+ and CD8+ T-cell activation in HIV infection is antigenic stimulation. J Acquir Immune Defic Syndr. 2000;25:203–211. - PubMed
    1. Hazenberg MD, Stuart JW, Otto SA, Borleffs JC, Boucher CA, de Boer RJ, Miedema F, Hamann D. T-cell division in human immunodeficiency virus (HIV)-1 infection is mainly due to immune activation: a longitudinal analysis in patients before and during highly active antiretroviral therapy (HAART) Blood. 2000;95:249–255. - PubMed

Publication types

MeSH terms