. 2012 Aug 6;2(4):407-16.
doi: 10.1098/rsfs.2011.0097. Epub 2012 Feb 8.

Turing's theory of morphogenesis of 1952 and the subsequent discovery of the crucial role of local self-enhancement and long-range inhibition

Affiliations

Turing's theory of morphogenesis of 1952 and the subsequent discovery of the crucial role of local self-enhancement and long-range inhibition

Hans Meinhardt. Interface Focus. .

Abstract

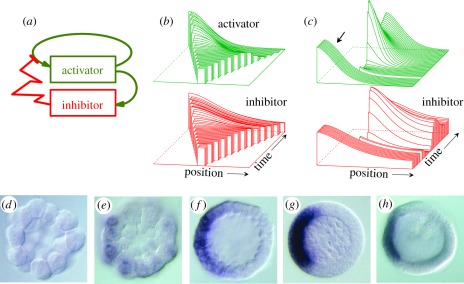
In his pioneering work, Alan Turing showed that de novo pattern formation is possible if two substances interact that differ in their diffusion range. Since then, we have shown that pattern formation is possible if, and only if, a self-enhancing reaction is coupled with an antagonistic process of longer range. Knowing this crucial condition has enabled us to include nonlinear interactions, which are required to design molecularly realistic interactions. Different reaction schemes and their relation to Turing's proposal are discussed and compared with more recent observations on the molecular-genetic level. The antagonistic reaction may be accomplished by an inhibitor that is produced in the activated region or by a depletion of a component that is used up during the self-enhancing reaction. The autocatalysis may be realized by an inhibition of an inhibition. Activating molecules can be processed into molecules that have an inhibiting function; patterning of the Wnt pathway is proposed to depend on such a mechanism. Three-component systems, as discussed in Turing's paper, are shown to play a major role in the generation of highly dynamic patterns that never reach a stable state.

Keywords: Turing's theory; Wnt pathway; activator–inhibitor systems; morphogenesis; pattern formation.


Figures

Figure 1.
Figure 1.
Pattern formation using Turing's [6] example equation (1.1). The initial (a) and two later distributions (b,c) are shown (green bars, X-concentrations; red lines, Y-concentrations). Since the removal of X in equation (1.1a) is independent of the number of X molecules, X molecules can be removed even if no X molecules are left. This can lead to negative concentrations. Without a cut-off of negative concentrations, there is no final stable steady state. The repair of this problem requires nonlinear reactions. An example is given in equation (2.1).
Figure 2.
Figure 2.
Pattern formation by an activator–inhibitor interaction. (a) Reaction scheme: the activator catalyses its own production and that of its rapidly spreading antagonist, the inhibitor [9,12]. (b) Simulation in a growing chain of cells using equation (2.1). Whenever a certain size is exceeded, random fluctuations are sufficient to initiate pattern formation. A high concentration appears at a marginal position. Thus, although the genetic information is the same in all cells, such a system is able to generate a reproducible polar pattern, appropriate to accomplish space-dependent cell differentiation and the generation of an embryonic axis. (c) Regeneration: after removal of the activated region, the remnant inhibitor fades away until a new activation is triggered. The graded profiles are restored as long as the remaining fragment is large enough. (dg) A biological example: the emerging Nodal gradient in the sea urchin embryo [13] that is responsible for the formation of the oral field. (h) Antivin (or Lefty2) acts as inhibitor [13,14] and is, as predicted, produced at the same position as the activator. (Figures dh kindly provided by Dr Thierry Lepage, see [13]; with permission from Dev. Cell.)
Figure 3.
Figure 3.
Periodic patterns. Several maxima appear if the field size is larger than the range of the antagonist. For the simulations, an activator–inhibitor mechanism was used (equation (2.1)). (a) With a substantial spread of the activator, e.g. by diffusion, the peaks are smooth. (b) If the the self-enhancement is cell local, only isolated activated cells remain. Some initially activated cells lose their activity. (c) If the self-enhancement is cell local and the activator production has an upper limit owing to saturation, many activated cells remain in a scattered arrangement. Owing to the limitation in the activator production, the inhibitor production is also limited and an activated cell has to tolerate an activated neighbour. More activated cells remain, with an activation at a lower level. (d) With saturation and some diffusion of the activator, stripe-like patterns can emerge. Diffusion causes activated cells to have the tendency to appear in coherent patches. In stripes, activated cells have activated neighbours along the stripe and non-activated cells are close by, into which the inhibitor can be dumped. The initial, two intermediate and the final stable distributions are shown. For initiation, small random fluctuations in the factor ρ (equation (2.1a)) were assumed.
Figure 4.
Figure 4.
Pattern formation by an activator–depletion mechanism. (ad) The development of a pattern in which the self-enhancing reaction proceeds at the expense of a rapidly spreading substrate or cofactor (equation (3.1)) [9]. The concentration of the antagonist is lowest in regions of high activator concentration, in contrast to the situation in an activator–inhibitor system (figure 2). (eg) Such a system is appropriate for intracellular pattern formation. In this simulation, the self-enhancing reaction is assumed to proceed by a cooperative aggregation of molecules (green) at the membrane. This aggregation proceeds at the expense of freely diffusible monomers that can spread rapidly in the cytoplasm (red). Local high concentrations emerge at a particular part of the cell membrane. Corresponding mechanisms are discussed for the yeast [21], in Dictyostelium discoideum [22] and is part of the centre-finding mechanism in E. coli (figure 7; [23]).
Figure 5.
Figure 5.
Two coupled pattern-forming systems with different wavelengths. (a) Simulation using equations (6.1). A first loop includes components that show substantial diffusion; the corresponding peaks (blue) are relatively smooth such that their place of activation can be better optimized. Assumed is that by processing Wnt molecules become converted from short-ranging activators to long-ranging inhibitors [27]. A second loop (red) is cell-local. The resulting maxima are sharp, allowing the determination of very localized structures (figure 3b). Owing to a common component, both loops appear superimposed in a centred way. (bh) Observations in the small freshwater polyp hydra [28]: Tcf (b) (and β-catenin) have a more shallow distribution around the opening of the gastric column, while Wnt3 expression (c) is more localized. (dh) After dissociation of hydra tissue into individual cells and and subsequent re-aggregation, complete and viable animals can be formed [1], one of the most impressive examples of de novo pattern formation. During re-aggregation, Tcf/β-catenin appear first in a more cloudy pattern (df), as is theoretically expected. In contrast, Wnt3 expression (gi) appears directly in sharp peaks. (Figures (bi) kindly supplied by Bert Hobmayer and Thomas Holstein [28], with permission from Nature.)
Figure 6.
Figure 6.
Already considered by Turing: tentacle patterning in hydra as an example of a periodic pattern on a ring. (a) Model for hydra patterning: the signals for head (green), foot (pink) and tentacle formation (brown) are assumed to be accomplished by activator–inhibitor systems [36]. These systems are coupled via the competence (blue). The head signal inhibits locally the tentacle signal but generates on longer range the high competence that is required for tentacle formation. Therefore, tentacles are formed only next to the head. (b,c) After treatment with a drug (alsterpaullone), tentacles are formed all over the body column [37], Wnt5 marks the tip of the tentacles (b), Wnt8 their base (c) [38]. The drug stabilizes β-catenin; all cells of the body column obtain a high competence [37]. (d,e) Model: owing to the generally elevated competence (blue), the position next to the head is no longer privileged; tentacles appear first at some distance from the existing tentacles (d), as observed (b), and later all over with a similar spacing that is normally only observed in the tentacle ring, in agreement with the observations [37,38]. (Photographs were kindly provided by Isabelle Philipp and Bert Hobmayer; see Philipp et al. [38]; with permission from Proc. Natl Acad. Sci. USA.)
Figure 7.
Figure 7.
Pattern formation by three-component systems. As Turing mentioned already in his paper, three-component systems can generate spontaneous travelling waves and out-of-phase oscillations. Modelling has shown that these patterns emerge if, in addition to the long-ranging antagonist, a local-acting but long-lasting antagonist is involved. The latter quenches a maximum shortly after it appeared [–44]. (a) Two patterns on shells of the same species and their simulations. Shell patterns are natural space–time plots since new pattern elements are added only at the growing edge. Minor changes in the parameter decide whether out-of-phase oscillations or travelling waves occur. These patterns emerge spontaneously and do not need a pacemaker. (b) The pole-to-pole oscillation of MinD in E. coli is used to localize the division plane. The division can only be initiated at positions where, on average, the MinD concentration (green) is at the lowest, i.e. at the centre of the cell. The numbers indicate seconds, a full cycle requires about 50 s [46]. (c) Simulation [23]: MinD (green) associates with the membrane. A second component, MinE (red), generates a local maximum that needs MinD to bind to the membrane but removes MinD with this binding. Thus, a MinE maximum permanently destabilizes itself by removing MinD, causing the back-and-forth shift of MinE maxima around the centre and the periodic breakdown of MinD maxima at the poles. High MinD levels appear at the poles in an alternating sequence while the centre remains free. This allows the initiation of a further patterning system, FtsZ (blue). These tubulin-like molecules initiate cell division by a constriction at the cell centre. (Photographs kindly provided by (a) Rainer Willman and (b) Piet de Boer [46].)

References

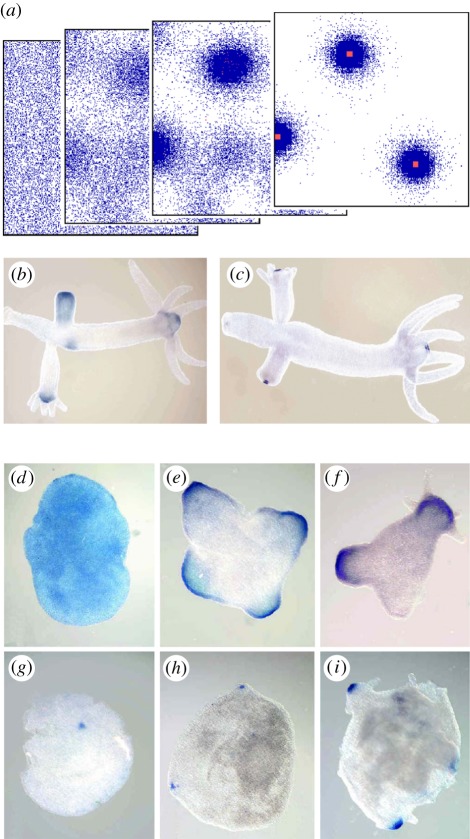
    1. Gierer A., Berking S., Bode H., David C. N., Flick K., Hansmann G., Schaller H., Trenkner E. 1972. Regeneration of hydra from reaggregated cells. Nat. New Biol. 239, 98–101. - PubMed
    1. Browne E. N. 1909. The production of new hydrants in Hydra by insertion of small grafts. J. Exp. Zool. 7, 1–23.10.1002/jez.1400070102 (10.1002/jez.1400070102) - DOI - DOI
    1. Broun M., Bode H. R. 2002. Characterization of the head organizer in hydra. Development 129, 875–884. - PubMed
    1. Spemann H., Mangold H. 1924. Über Induktion von Embryonalanlagen durch Implantation artfremder Organisatoren. Wilhelm Roux' Arch. Entw. Mech. Org. 100, 599–638.
    1. De Robertis E. M. 2009. Spemann's organizer and the selfregulation of embryonic fields. Mech. Dev. 126, 925–941.10.1016/j.mod.2009.08.004 (10.1016/j.mod.2009.08.004) - DOI - DOI - PMC - PubMed

LinkOut - more resources