. 2013 Aug 7:14:536.
doi: 10.1186/1471-2164-14-536.

Sources of bias in measures of allele-specific expression derived from RNA-sequence data aligned to a single reference genome

Affiliations

Sources of bias in measures of allele-specific expression derived from RNA-sequence data aligned to a single reference genome

Kraig R Stevenson et al. BMC Genomics. .

Abstract

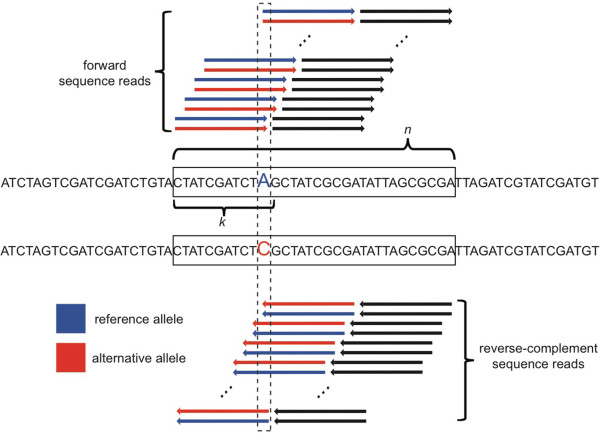
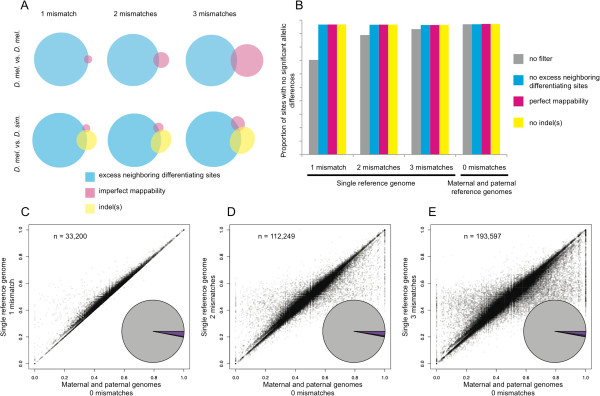
Background: RNA-seq can be used to measure allele-specific expression (ASE) by assigning sequence reads to individual alleles; however, relative ASE is systematically biased when sequence reads are aligned to a single reference genome. Aligning sequence reads to both parental genomes can eliminate this bias, but this approach is not always practical, especially for non-model organisms. To improve accuracy of ASE measured using a single reference genome, we identified properties of differentiating sites responsible for biased measures of relative ASE.

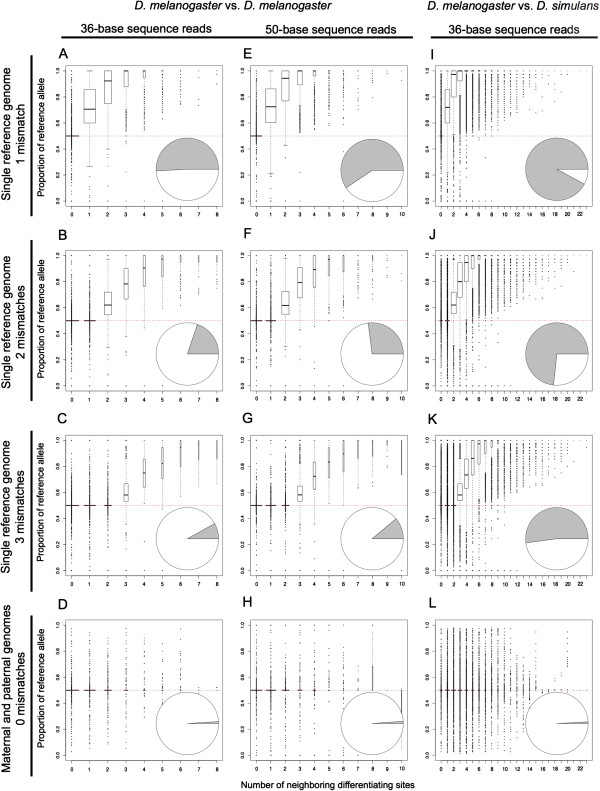
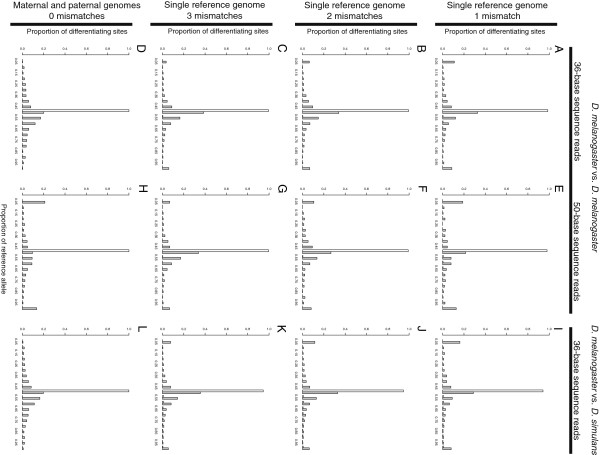
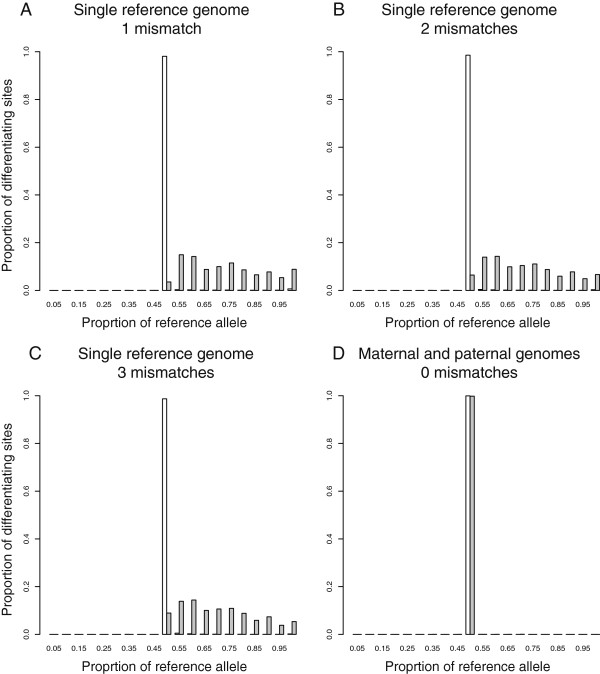
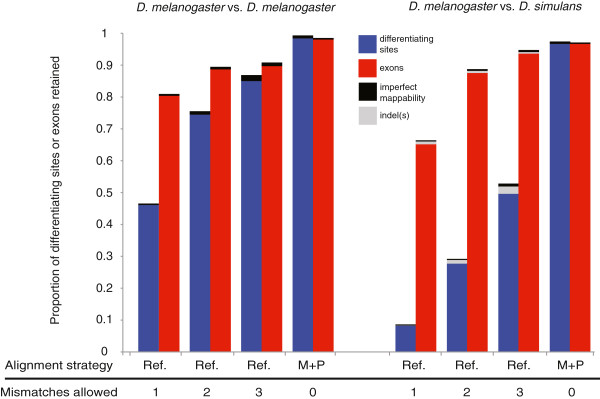
Results: We found that clusters of differentiating sites prevented sequence reads from an alternate allele from aligning to the reference genome, causing a bias in relative ASE favoring the reference allele. This bias increased with greater sequence divergence between alleles. Increasing the number of mismatches allowed when aligning sequence reads to the reference genome and restricting analysis to genomic regions with fewer differentiating sites than the number of mismatches allowed almost completely eliminated this systematic bias. Accuracy of allelic abundance was increased further by excluding differentiating sites within sequence reads that could not be aligned uniquely within the genome (imperfect mappability) and reads that overlapped one or more insertions or deletions (indels) between alleles.

Conclusions: After aligning sequence reads to a single reference genome, excluding differentiating sites with at least as many neighboring differentiating sites as the number of mismatches allowed, imperfect mappability, and/or an indel(s) nearby resulted in measures of allelic abundance comparable to those derived from aligning sequence reads to both parental genomes.


Figures

Figure 1
Figure 1
Simulating an allele-specific RNA-seq experiment. Reads were generated from the “reference” D. melanogaster (dm3) allele (blue) and from an “alternative” allele (red) that contained all homozygous single nucleotide variants found in the DGRP strain “line_40”. For each exon, one read (arrow) was generated starting at each position for each allele from 1 to n-k, where n is the length of the exon and k is the length of the read, both in bases. This process was repeated for the reverse complement of each exon. The black arrows indicate reads with no allele-specific information.
Figure 2
Figure 2
The density of differentiating sites affects relative allelic abundance when simulated reads are mapped to only one genome. Relative allelic abundance was measured using the 36-base (A-D) and 50-base (E-H) reads simulated from the two D. melanogaster genotypes as well as using the 36-base reads simulated from D. melanogaster and D. simulans(I-L) aligned to a single reference genome, allowing either one mismatch (A, E, I), two mismatches (B, F, J), or three mismatches (C, G, K), as well as by aligning reads to both allele-specific genomes allowing no mismatches (D, H, L). The number of neighboring differentiating sites is shown on the x-axis of each panel for each differentiating site and describes the maximum number of other sites that differ between the two alleles in any potential read overlapping the focal differentiating site. The y-axis shows the proportion of reads that were assigned to the reference allele for each differentiating site, summarized in box plots where the width of each box is proportional to the number of sites in that class. A proportion of 0.5 (indicated with a red dotted line in each panel) is expected if all reads overlapping a differentiating site are correctly assigned to alleles. The pie chart inset in each panel shows the total number of differentiating sites with equal (white) and unequal (grey) abundance of reads assigned to each allele.
Figure 3
Figure 3
Imperfect mappability causes inaccurate measures of relative allelic abundance. For unbiased differentiating sites (i.e., those with fewer neighboring differentiating sites than the number of mismatches allowed) with either perfect (white) or imperfect (grey) mappability, the distribution of relative allelic abundance (measured as the proportion of mapped reads assigned to the reference allele) is shown for the 36-base (A-D) and 50-base (E-H) reads simulated from the two D. melanogaster genotypes as well as for the 36-base reads simulated from D. melanogaster and D. simulans(I-L) aligned to a single genome, allowing one (A, E, I), two (B, F, J), or three (C, G, K) mismatches. The distribution of relative allelic abundance for unbiased differentiating sites with perfect (white) and imperfect (grey) mappability is also shown for all three simulated datasets after aligning reads to both the reference and alternative genomes, allowing no mismatches (D, H, L).
Figure 4
Figure 4
Insertions and deletions (indels) cause biased allele-specific assignment when reads are aligned to a single reference genome. For differentiating sites with perfect mappability and fewer neighboring differentiating sites than the number of mismatches allowed, the distributions of relative allelic abundance are shown for differentiating sites with (grey) and without (white) one or more nearby indel(s) after aligning the 36-base reads simulated from D. melanogaster and D. simulans to either the D. melanogaster genome with one (A), two (B), or three (C) mismatches allowed or to both the D. melanogaster and D. simulans genomes with no mismatches allowed (D).
Figure 5
Figure 5
Real reads aligned to a single reference genome produce reliable measures of allelic abundance after excluding problematic differentiating sites. (A) The relative proportions of sites with an excess of neighboring differentiating sites (cyan), imperfect mappability (magenta), an indel(s) nearby (yellow), or more than one of these properties are shown for the simulated 36-base intra- (mel-mel) and interspecific (mel-sim) datasets allowing one (1 mm), two (2 mm), or 3 (3 mm) mismatches during alignment to a single reference genome. (B) The proportion of differentiating sites with no statistically significant difference in relative allelic expression is shown for the real reads from F1 hybrids between D. melanogaster and D. simulans after aligning to either a single reference genome with one, two, or three mismatches allowed or to both the maternal and paternal genomes with zero mismatches allowed before excluding any sites (grey) and after sequentially excluding differentiating sites with an excess of neighboring differentiating sties (cyan), imperfect mappability (magenta), or an indel(s) nearby (yellow). (C-E) For each differentiating site retained after filtering based on neighboring differentiating sites, mappability, and indels, the proportion of reads assigned to the reference allele is plotted after aligning reads to a single reference genome (y-axis) or to separate allele-specific genomes (x-axis), allowing one (C), two (D), or three (E) mismatches. The pie chart insets reflect the total number of differentiating sites that showed either no statistically significant difference in relative allelic abundance using either alignment strategy (grey), a statistically significant difference when reads were aligned to either a single reference genome (blue) or both the maternal and paternal genomes (red), or a significant difference with both alignment methods (purple). Binomial exact tests and a false discovery rate of 0.05 were used to assess statistical significance in all cases.
Figure 6
Figure 6
Relative allelic abundance can be estimated for most exons after excluding sites problematic sites. The proportion of differentiating sites (blue) and exons with at least one differentiating site (red) suitable for quantifying ASE after excluding sites with an excess of neighboring differentiating sites, imperfect mappability (black) and an indel(s) nearby (grey) are shown for the 36-base reads simulated from the two D. melanogaster genotypes (left) and from the D. melanogaster and D. simulans exomes (right). Each pair of bars results from aligning reads to either a single reference genome (Ref) or both the maternal and paternal genomes (M + P) with zero (0), one (1), two (2), or three (3) mismatches allowed. The two D. melanogaster genotypes compared did not include any indels, as described in the main text.

References

    1. Marioni JC, Mason CE, Mane SM, Stephens M, Gilad Y. RNA-seq: an assessment of technical reproducibility and comparison with gene expression arrays. Genome Res. 2008;18:1509–1517. doi: 10.1101/gr.079558.108. - DOI - PMC - PubMed
    1. Metzker ML. Sequencing technologies - the next generation. Nat Rev Genet. 2010;11:31–46. doi: 10.1038/nrg2626. - DOI - PubMed
    1. Wang Z, Gerstein M, Snyder M. RNA-Seq: a revolutionary tool for transcriptomics. Nat Rev Genet. 2009;10:57–63. doi: 10.1038/nrg2484. - DOI - PMC - PubMed
    1. Mortazavi A, Williams BA, McCue K, Schaeffer L, Wold B. Mapping and quantifying mammalian transcriptomes by RNA-Seq. Nat Methods. 2008;5:621–628. doi: 10.1038/nmeth.1226. - DOI - PubMed
    1. Brawand D, Soumillon M, Necsulea A, Julien P, Csárdi G, Harrigan P, Weier M, Liechti A, Aximu-Petri A, Kircher M, Albert FW, Zeller U, Khaitovich P, Grützner F, Bergmann S, Nielsen R, Pääbo S, Kaessmann H. The evolution of gene expression levels in mammalian organs. Nature. 2011;478:343–348. doi: 10.1038/nature10532. - DOI - PubMed

Publication types