

Functional somatotopy revealed across multiple cortical regions using a model of complex motor task
- PMID: 23920009
- PMCID: PMC3931839
- DOI: 10.1016/j.brainres.2013.07.050
Functional somatotopy revealed across multiple cortical regions using a model of complex motor task
Abstract
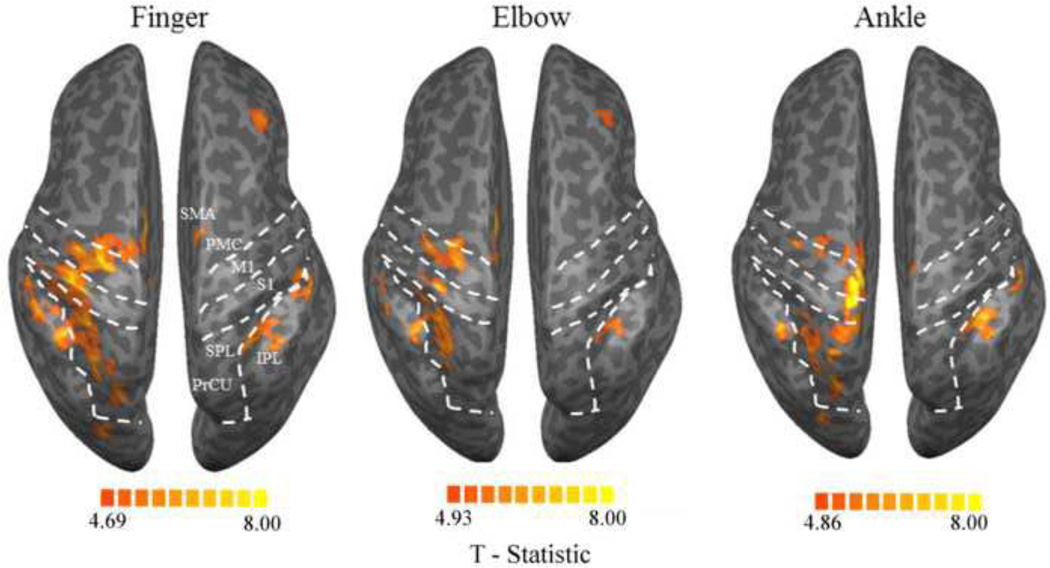
The primary motor cortex (M1) possesses a functional somatotopic structure-representations of adjacent within-limb joints overlap to facilitate coordination while maintaining discrete centers for individuated movement. We examined whether similar organization exists across other sensorimotor cortices. Twenty-four right-handed healthy subjects underwent functional magnetic resonance imaging (fMRI) while tracking complex targets with flexion/extension at right finger, elbow and ankle separately. Activation related to each joint at false discovery rate of 0.005 served as its representation across multiple regions. Within each region, we identified the center of mass (COM) for each representation, and the overlap between the representations of within-limb (finger and elbow) and between-limb joints (finger and ankle). Somatosensory (S1) and premotor cortices (PMC) demonstrated greater distinction of COM and minimal overlap for within- and between-limb representations. In contrast, M1 and supplementary motor area (SMA) showed more integrative somatotopy with higher sharing for within-limb representations. Superior and inferior parietal lobule (SPL and IPL) possessed both types of structure. Some clusters exhibited extensive overlap of within- and between-limb representations, while others showed discrete COMs for within-limb representations. Our results help to infer hierarchy in motor control. Areas such as S1 may be associated with individuated movements, while M1 may be more integrative for coordinated motion; parietal associative regions may allow switch between both modes of control. Such hierarchy creates redundant opportunities to exploit in stroke rehabilitation. The use of complex rather than traditionally used simple movements was integral to illustrating comprehensive somatotopic structure; complex tasks can potentially help to understand cortical representation of skill and learning-related plasticity.
Keywords: Functional MRI or fMRI; Motor control; Motor map; Movement; Posterior parietal cortex; Primary motor cortex or M1; Representation; Somatotopy.
© 2013 Elsevier B.V. All rights reserved.
Figures


Similar articles
-
Within-limb somatotopy in primary motor cortex--revealed using fMRI.Cortex. 2010 Mar;46(3):310-21. doi: 10.1016/j.cortex.2009.02.024. Epub 2009 Apr 7. Cortex. 2010. PMID: 19446804
-
Pilot fMRI investigation of representational plasticity associated with motor skill learning and its functional consequences.Brain Imaging Behav. 2012 Sep;6(3):437-53. doi: 10.1007/s11682-012-9158-3. Brain Imaging Behav. 2012. PMID: 22454141 Free PMC article.
-
Cortical activation during finger tracking vs. ankle tracking in healthy subjects.Restor Neurol Neurosci. 2009;27(4):253-264. Restor Neurol Neurosci. 2009. PMID: 19813287
-
Integrated technology for evaluation of brain function and neural plasticity.Phys Med Rehabil Clin N Am. 2004 Feb;15(1):263-306. doi: 10.1016/s1047-9651(03)00124-4. Phys Med Rehabil Clin N Am. 2004. PMID: 15029909 Review.
-
Constraints on somatotopic organization in the primary motor cortex.J Neurophysiol. 2001 Nov;86(5):2125-43. doi: 10.1152/jn.2001.86.5.2125. J Neurophysiol. 2001. PMID: 11698506 Review.
Cited by
-
Task-Based Functional Connectivity and Blood-Oxygen-Level-Dependent Activation During Within-Scanner Performance of Lumbopelvic Motor Tasks: A Functional Magnetic Resonance Imaging Study.Front Hum Neurosci. 2022 Mar 2;16:816595. doi: 10.3389/fnhum.2022.816595. eCollection 2022. Front Hum Neurosci. 2022. PMID: 35308606 Free PMC article.
-
Brain white matter correlates of learning ankle tracking using a wearable device: importance of the superior longitudinal fasciculus II.J Neuroeng Rehabil. 2022 Jun 27;19(1):64. doi: 10.1186/s12984-022-01042-2. J Neuroeng Rehabil. 2022. PMID: 35761285 Free PMC article.
-
Egomotion-related visual areas respond to active leg movements.Hum Brain Mapp. 2019 Aug 1;40(11):3174-3191. doi: 10.1002/hbm.24589. Epub 2019 Mar 28. Hum Brain Mapp. 2019. PMID: 30924264 Free PMC article.
-
Brain activity associated with Dual-task performance of Ankle motor control during cognitive challenge.Brain Behav. 2019 Aug;9(8):e01349. doi: 10.1002/brb3.1349. Epub 2019 Jul 2. Brain Behav. 2019. PMID: 31265216 Free PMC article.
-
Internally Guided Lower Limb Movement Recruits Compensatory Cerebellar Activity in People With Parkinson's Disease.Front Neurol. 2019 Jun 7;10:537. doi: 10.3389/fneur.2019.00537. eCollection 2019. Front Neurol. 2019. PMID: 31231297 Free PMC article.
References
-
- Beisteiner R, Windischberger C, Lanzenberger R, Edward V, Cunnington R, Erdler M, Gartus A, Streibl B, Moser E, Deecke L. Finger somatotopy in human motor cortex. Neuroimage. 2001;13:1016–1026. - PubMed
-
- Bhatt E, Nagpal A, Greer KH, Grunewald TK, Steele JL, Wiemiller JW, Lewis SM, Carey JR. Effect of finger tracking combined with electrical stimulation on brain reorganization and hand function in subjects with stroke. Exp Brain Res. 2007;182:435–447. - PubMed
-
- Brashers-Krug T, Shadmehr R, Bizzi E. Consolidation in human motor memory. Nature. 1996;382:252–255. - PubMed
Publication types
MeSH terms
Grants and funding
- M01 RR000400/RR/NCRR NIH HHS/United States
- M01-RR00400/RR/NCRR NIH HHS/United States
- R01 HD061363/HD/NICHD NIH HHS/United States
- R01 NS035130/NS/NINDS NIH HHS/United States
- R01 CA189665/CA/NCI NIH HHS/United States
- R01 HD053153/HD/NICHD NIH HHS/United States
- 1RC1HD063838-01/HD/NICHD NIH HHS/United States
- P41 RR008079/RR/NCRR NIH HHS/United States
- P41RR008079/RR/NCRR NIH HHS/United States
- K01 HD069504/HD/NICHD NIH HHS/United States
- RC1 HD063838/HD/NICHD NIH HHS/United States
- 1R01HD053153-01A2/HD/NICHD NIH HHS/United States
- 1K01HD069504/HD/NICHD NIH HHS/United States
LinkOut - more resources
Full Text Sources
Other Literature Sources
Medical
